A Study to Evaluate the Effectiveness of Motivational Intervention on Anxiety...
HMS Poster 032012
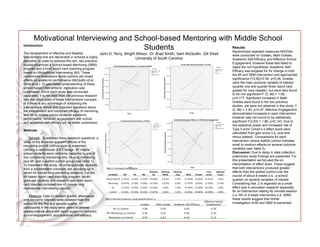
1. Results:
Randomized repeated measures ANOVAs
were conducted on Grades, Math Grades,
Academic Self-Efficacy, and Affective School
Engagement; however these test failed to
reject the null hypothesis. Academic Self-
Efficacy was targeted for for change in both
the MI and SBM intervention and approached
significance F(3,85)=2.56, p=0.06. Grades
were the main outcome variable of interest
(quarter one and quarter three report card
grades for core classes), but were also found
to be non significant F (3, 88) = 1.68,
p=0.177. Significant increases in Math
Grades were found in the two previous
studies, yet were not obtained in this study F
(2, 88) = 2.40, p=0.07. Affective Engagement
demonstrated increases in each intervention,
however was not sound to be statistically
significant F(3,83) = 1.86, p=0.143. Due to
low statistical power and increased risk of
Type II error Cohen’s d effect sized were
calculated from gain score (i.e. post test
minus pretest). Comparisons for each
intervention versus waitlist control indicates
small to medium effects on several outcome
variables (see Table 2).
Discussion: Due to delay in data collection,
preliminary study findings are presented. For
this presentation we focused the on
interpretation of effect sizes. These suggest
that both interventions produced greater
effects than the waitlist control over the
course of about 8 weeks (i.e., a school
quarter) on several variables of interest.
Considering that .2 is regarded as a small
effect size in education research especially
for an intervention lasting 45 minutes session
(i.e. MI) or 8 week intervention (i.e. SBM)
these results suggest that further
investigation of MI and SBM is warranted.
Motivational Interviewing and School-based Mentoring with Middle School
Students
John D. Terry, Wright Wilson, Dr. Brad Smith, Sam McQuillin, Gill Strait
University of South Carolina
Introduction:
The development of effective and feasible
interventions that are deliverable in schools is highly
desirable. In order to address this aim, two previous
studies examined a School-based Mentoring (SBM)
program and a brief report card coaching program
based on Motivational Interviewing (MI). These
randomized evaluations found positive yet mixed
effects on academic performance (McQuillin et al.;
Strait et al.). To gain better understanding of these
school-based interventions, replication was
undertaken. Since each study was conducted
separately, it is not clear from the previous research
how the effect sizes of these interventions compare,
or if there is any advantage of combining the
interventions. Novel and important questions about
the independent and combined efficacy of mentoring
and MI on middle school students’ academic
performance, behavior, engagement with school,
and academic self-efficacy will be better understood.
Methods:
Sample:. To address these research questions, a
study of the separate and joint effects of the
mentoring and MI interventions is presented.
Utilizing a randomized 2 X 2 design, 97 middle
school students were randomly assigned to one of
four conditions: mentoring only, MI only, mentoring
plus MI, and a waitlist control group (see Table 1).
To implement this study, 42 undergraduate students
from a southeastern university are providing up to
seven 45 minute long mentoring sessions. For the
MI-based report card coaching program, seven
graduate students and research specialist report
card coaches provided one 45 minute long
motivational interviewing session.
Measure: Data on student grades, attendance,
and discipline referrals were obtained from the
school for the first and second quarter. All
participants in the study were asked to answer
questionnaires about self-report academic behavior,
school engagement, and academic self-efficacy.
Table
1:
Par+cipant
Demographics
Condi&on
6th
7th
8th
Ethnicity
AA
Ethnicity
White
Ethnicity
Hisp
Male
Female
Free
Lunch
Reduced
Lunch
Mentoring+MI
11
(42%)
9
(34%)
6
(23%)
18
(69%)
6
(23%)
2
(7%)
13
(50%)
13
(50%)
16
(61%)
1
(3%)
Mentoring
10
(47%)
5
(23%)
6
(28%)
16
(76%)
5
(23%)
0
(0%)
12
(57%)
9
(42%)
11
(52%)
3
(14%)
MI
13
(52%)
6
(24%)
6
(24%)
23
(92%)
1
(4%)
1
(4%)
10
(40%)
15
(60%)
19
(76%)
1
(4%)
Control
8
(33%)
8
(33%)
8
(33%)
21
(87%)
2
(8%)
1
(4%)
8
(33%)
16
(66%)
14
(58%)
2
(8%)
Table
2:Planned
Comparison
using
Adjusted
Cohen's
d
Grades Math Grades Academic Self-Efficacy
Affective School
Engagement
MI vs Control 0.08 0.69 0.82 0.30
MI+Mentoring vs Control 0.46 0.62 0.40 0.25
Mentoring vs Control 0.54 0.63 0.44 0.10