Expression, purification and spectroscopic characterization of the cytochrome...
Transcriptome Changes in Chlamydomonas reinhardtii Gene Expression
1. Transcriptome-Wide Changes in Chlamydomonas reinhardtii
Gene Expression Regulated by Carbon Dioxide and the
CO2-Concentrating Mechanism Regulator CIA5/CCM1 W OA
Wei Fang,a Yaqing Si,b Stephen Douglass,c,d David Casero,c,d Sabeeha S. Merchant,d,e Matteo Pellegrini,c,d
Istvan Ladunga,f Peng Liu,b and Martin H. Spaldinga,1
a Department of Genetics, Development, and Cell Biology, Iowa State University, Ames, Iowa 50011-3260
b Department of Statistics, Iowa State University, Ames, Iowa 50011-1210
c Department of Molecular, Cell, and Developmental Biology, University of California, Los Angeles, California 90095–1606
d Institute of Genomics and Proteomics, University of California, Los Angeles, California 90095-1569
e Department of Chemistry and Biochemistry, University of California, Los Angeles, California 90095-1569
f Department of Statistics, University of Nebraska, Lincoln, Nebraska 68588-0665
We used RNA sequencing to query the Chlamydomonas reinhardtii transcriptome for regulation by CO2 and by the
transcription regulator CIA5 (CCM1). Both CO2 and CIA5 are known to play roles in acclimation to low CO2 and in induction of
an essential CO2-concentrating mechanism (CCM), but less is known about their interaction and impact on the whole
transcriptome. Our comparison of the transcriptome of a wild type versus a cia5 mutant strain under three different CO2
conditions, high CO2 (5%), low CO2 (0.03 to 0.05%), and very low CO2 (<0.02%), provided an entry into global changes in the
gene expression patterns occurring in response to the interaction between CO2 and CIA5. We observed a massive impact of
CIA5 and CO2 on the transcriptome, affecting almost 25% of all Chlamydomonas genes, and we discovered an array of gene
clusters with distinctive expression patterns that provide insight into the regulatory interaction between CIA5 and CO2.
Several individual clusters respond primarily to either CIA5 or CO2, providing access to genes regulated by one factor but
decoupled from the other. Three distinct clusters clearly associated with CCM-related genes may represent a rich source of
candidates for new CCM components, including a small cluster of genes encoding putative inorganic carbon transporters.
INTRODUCTION
The photosynthetic conversion of inorganic carbon (Ci) into or-
ganic form is responsible for the abundance of biomass on
earth. In this process, ribulose-1,5-bis-phosphate carboxylase/
oxygenase (Rubisco) catalyzes the initial incorporation of CO2
via the carboxylation of ribulose bisphosphate by CO2 (reviewed
in Andersson, 2008). Although critically important, the catalytic
activity of Rubisco is slow compared with many other enzymes
and also cannot discriminate completely between CO2 and O2;
the oxygenation of ribulose bisphosphate is competitive with the
carboxylation reaction. Under present atmospheric conditions,
CO2 assimilation rates often are limited by the CO2 concentration,
and in many photosynthetic species, ranging from cyanobacteria
and algae to C4 vascular plants, an active CO2-concentrating
mechanism (CCM) has evolved to help offset the deficiencies of
Rubisco (Raven et al., 2008). CCMs are especially prevalent in
aquatic photosynthetic organisms.
Chlamydomonas reinhardtii, a unicellular green alga that serves
as a reference organism, also exhibits acclimations to varied CO2
levels (reviewed in Spalding, 2009). C. reinhardtii must over-
come the 10,000-fold slower diffusion of CO2 in water relative to
air. Thus, active transport and accumulation of Ci, either as CO2
or as HCO3
2, plays a critical role in the C. reinhardtii CCM
(Moroney and Ynalvez, 2007; Spalding, 2008). Internal accu-
mulation of Ci occurs against a large concentration gradient, so
accumulation must occur as HCO3
2 because its permeability
across lipid membranes is 1000-fold lower than that of CO2.
However, Rubisco uses CO2 as substrate, so, along with Ci
transporters, carbonic anhydrases (CAs), which catalyze in-
terconversion of CO2 and HCO3
2, also play important roles in
the CCM, (Spalding et al., 1983a; Coleman and Grossman,
1984; Moroney et al., 2011).
The C. reinhardtii CCM is induced by low CO2 concentrations,
and the discovery of CCM-related genes has been based on
identifying genes with elevated expression under limiting CO2
(lower than 0.05%) compared with high CO2 (1 to 5% CO2)
(Spalding and Jeffrey, 1989; Chen et al., 1997; Somanchi and
Moroney, 1999; Miura et al., 2004; Yamano and Fukuzawa,
2009). Many CAs and putative transporters or other LCI (for low
CO2 inducible) genes have been discovered by this criterion and
have been hypothesized to relate to the CCM of C. reinhardtii
(Miura et al., 2004; Yamano and Fukuzawa, 2009).
The detailed regulatory mechanisms of the CCM remain un-
clear, but two important transcription regulators have been
1 Address correspondence to mspaldin@iastate.edu.
The authors responsible for distribution of materials integral to the
findings presented in this article in accordance with the policy described
in the Instructions for Authors (www.plantcell.org) are: Wei Fang
(fangwei@iastate.edu) and Martin H. Spalding (mspaldin@iastate.edu).
W
Online version contains Web-only data.
OA
Open Access articles can be viewed online without a subscription.
www.plantcell.org/cgi/doi/10.1105/tpc.112.097949
The Plant Cell, Vol. 24: 1876–1893, May 2012, www.plantcell.org ã 2012 American Society of Plant Biologists. All rights reserved.
2. identified and characterized based on their relationship to the
CCM. A zinc-finger type transcription regulator, CIA5 (or CCM1),
was identified by complementation of the cia5 mutant (Moroney
et al., 1989), which is unable to acclimate to limiting CO2 con-
ditions, and, independently, by cloning of a tagged allele of cia5,
ccm1 (Fukuzawa et al., 2001; Xiang et al., 2001). Expression of
most putative Ci transporters and induced CAs requires CIA5,
even though the expression of CIA5 itself does not depend
on the CO2 level, so posttranslational activation of CIA5 in low
CO2 apparently is required for CIA5 to regulate these genes
(Fukuzawa et al., 2001; Xiang et al., 2001; Miura et al., 2004).
Another transcription regulator, low-CO2 response regulator1
(LCR1), has a Myb domain and appears to regulate the ex-
pression of at least three limiting CO2 induced genes, carbonic
anhydrase1 (CAH1), low-CO2-induced gene1 (LCI1), and LCI6.
LCR1 itself also is induced by limiting CO2, and this induction
requires Ci accumulation5 (CIA5) (Yoshioka et al., 2004). Be-
cause of the extensive connection of CIA5 to regulation of the
CCM-related genes, including LCR1, CIA5 is often called the
master regulator of the CCM.
Regarding the mechanism of Ci transport and accumulation in
the CCM, the first barrier to Ci uptake is the plasma membrane.
Two CIA5-regulated genes encoding candidate transporters
have been implicated in Ci transport across the plasma mem-
brane: high light–induced gene3 (HLA3) encodes a putative ATP
binding cassette type transporter and is induced under low CO2
conditions, and knockdown of its expression impairs photo-
synthesis, Ci uptake, and growth in alkaline conditions (Duanmu
et al., 2009a). LCI1 encodes a plasma membrane protein re-
ported to increase Ci uptake in LCR1 mutants when expressed
transgenically (Ohnishi et al., 2010). Two Rhesus-like proteins,
RHP1 and RHP2, also are predicted to be plasma membrane
located (Yoshihara et al., 2008). The RHP1 protein has been
proposed as a CO2 channel to facilitate CO2 influx under high
CO2 conditions (Soupene et al., 2002, 2004), and its expression
is reportedly upregulated in high CO2.
Some chloroplast envelope proteins also are candidates to
transport Ci into the stroma. The low CO2–induced gene A (LCIA
[NAR1.2]) gene, which encodes a Formate/Nitrite Transporter
family protein targeted to the chloroplast envelope, is induced in
low CO2 and requires CIA5 for expression (Galván et al., 2002;
Miura et al., 2004). LCIA has been reported to increase HCO3
2
transport when transfected into Xenopus laevis oocytes
(Mariscal et al., 2006), and its product has been implicated in Ci
transport in HLA3-LCIA coknockdown C. reinhardtii strains
(Duanmu et al., 2009a). RNA interference knockdown of chloro-
plast carrier protein1 (CCP1) and CCP2, which encode nearly
identical, LCI chloroplast envelope proteins (Spalding and
Jeffrey, 1989; Ramazanov et al., 1993; Chen et al., 1997) re-
sulted in poor growth under low CO2 conditions, although no
direct evidence for a defect in Ci transport or photosynthesis
was demonstrated (Pollock et al., 2004).
The combined transport of HCO3
2 across the plasma mem-
brane and the chloroplast envelope results in the accumulation
of HCO3
2 in the chloroplast stroma. Since Rubisco, located in
the pyrenoid, cannot use HCO3
2, a specific CA, carbonic an-
hydrase3 (CAH3), dehydrates the accumulated HCO3
2 to CO2 in
the thylakoid lumen, taking advantage of the acidic lumen
environment to drive nearly complete conversion of HCO3
2 to
CO2 (Spalding, 2008; Moroney et al., 2011). This essential role of
CAH3 also mandates the transport or facilitated diffusion of
HCO3
2 across the thylakoid membrane, but this has not yet
been demonstrated.
Another set of low CO2–induced genes, low CO2–induced
gene B (LCIB) and three related genes, LCIC, LCID, and LCIE,
also have been implicated in Ci transport and accumulation even
though they are predicted to be soluble chloroplast proteins
(Wang and Spalding, 2006; Moroney and Ynalvez, 2007;
Spalding, 2008). LCIB mutants fail to accumulate internal Ci in
low CO2 conditions and are thus unable to grow in air levels of
CO2 (Spalding et al., 1983b; Wang and Spalding, 2006). Notably,
LCIB mutants have revealed the existence of a third acclimation
state at very low CO2 concentrations (<0.02%): Both LCIB allelic
mutants pmp1 and ad1 die under low CO2 conditions (<0.05 and
>0.02%) but are able to grow slowly under very low CO2
(<0.02%) conditions (Wang and Spalding, 2006).
Because transmembrane domains are not evident, these LCIB
family proteins cannot be stand-alone Ci transporters. It has
been suggested that they might serve as Ci transport regulators
or as Ci transport complex subunits (Wang and Spalding, 2006),
but LCIB either distributes through the stroma or concentrates
around the pyrenoid (Duanmu et al., 2009b; Yamano et al.,
2010), making interaction with Ci transporters unlikely. Mutants
defective in the thylakoid lumen CA, CAH3, suppress the LCIB
mutation phenotype (Duanmu et al., 2009b), suggesting a role
for LCIB and LCIC, with which LCIB forms a heteromeric com-
plex (Yamano et al., 2010), in preventing the leakage of CO2 from
the stroma. CAH6, a putative chloroplast stromal CA, also may
be involved in CO2-to-HCO3
2 conversion in the stroma to re-
duce diffusive loss of CO2 from the chloroplast (Mitra et al.,
2004).
Even though the C. reinhardtii CCM has been extensively
studied in recent years, we still know little about the limiting CO2
acclimation process, and the potential for discovery of new
genes involved in this process is very high. The acclimation to
limiting CO2 and induction of the CCM in C. reinhardtii appear to
be regulated by the master regulator, CIA5 (or CCM1) (Miura
et al., 2004). The cia5 mutant appears to completely lack in-
duction of the CCM, although it is viable under high CO2 con-
ditions and grows more slowly than the wild type in air levels of
CO2. Also, most identified LCI genes remain uninduced when
cia5 is exposed to low CO2 (Moroney et al., 1989; Spalding et al.,
2002). Aside from being a critical upstream regulator of the CCM
and other low CO2 acclimation responses and likely requiring
posttranslational activation in low CO2, the details of CIA5
function remain undiscovered. CIA5 has been proposed to be
a transcription regulator (Fukuzawa et al., 2001; Xiang et al.,
2001), but we know very little about sequences recognized by its
putative DNA binding domain or the genes it directly regulates
downstream.
To better understand the CCM and low CO2 acclimation of C.
reinhardtii in general, as well as the function of CIA5, we con-
ducted RNA sequencing (RNA-Seq) experiments employing the
Illumina Genome Analyzer II because of its superiority over the
traditional microarray methods (González-Ballester et al., 2010;
Wang et al., 2010; Castruita et al., 2011) using two C. reinhardtii
Transcriptome Profile for C. reinhardtii CCM 1877
3. strains: the 137c wild type (cc125) and cia5 (cc2702), a mutant in
the 137c background with a point mutation in CIA5. To also gain
insight into the multiple acclimation states, the strains were
grown at three different CO2 concentrations as quantified below:
high CO2 (H-CO2), low CO2 (L-CO2), and very low CO2 (VL-CO2).
Our transcriptome comparison identified a massive impact of
CIA5 and CO2 on the transcriptome and revealed an array of
gene clusters with distinctive expression patterns that provide
insight into the regulatory interaction between CIA5 and CO2.
Individual gene clusters responded primarily to CIA5, to CO2, or
to an interaction between the two. This study of transcriptome-
wide gene expression patterns provides insight into the massive
impact of these two factors and their interaction on C. reinhardtii
gene expression in addition to identifying compelling new can-
didates for CCM functional components.
RESULTS
Identification of Differentially Expressed Genes
This transcriptome study was designed employing three CO2
acclimation states, H-CO2 (5% CO2), L-CO2 (0.033 to 0.041%),
and VL-CO2 (0.011 to 0.015%), and two strains (genotypes):
the cia5 mutant and its original wild-type progenitor, 137c.
Processing of RNA samples on the Illumina Genome Ana-
lyzer system yielded more than 12 million reads mapped to
the transcriptome for each sample, and more than 90% of
these were uniquely mapped to the C. reinhardtii genome (see
Supplemental Table 1 online). We detected expression for 15,649
of 15,818 filtered Augustus 5.0 gene models (>99% coverage).
Since Augustus 5.0 predictions were based on the Chlamydo-
monas Version 4 genome assembly, we also acquired annota-
tion information from the filtered Version 4 model set available
from the Joint Genome Initiative database as user annotation
references and sources for the common gene names.
As an aid to examining gene expression level distributions, we
calculated the reads per kilobase of exon model per million of
aligned reads (RPKM) values as normalized expression esti-
mates for each gene model in each sample. The shape of dis-
tributions for the average RPKM values are very similar among
the six conditions, as are the 5th, 50th, and 95th percentiles of
these distributions (see Supplemental Figure 1 online). Also, the
calculated correlation coefficients, based on the log-transformed
RPKM values after eliminating genes with zero count in either of
the two replicates, between the two biological replicates for
each condition range from 0.935 to 0.983, indicating high cor-
relation between replicates.
To evaluate the reliability of our RNA-Seq results, we per-
formed quantitative PCR (qPCR) on eight previously studied
genes (CAH1, CAH3, CAH6, CIA5/CCM1, HLA3, LCIB, LCIE,
and RHP1) using the same RNA samples as those used for
RNA-Seq. These genes were selected to represent a wide range
of expression levels and expression patterns under the con-
ditions used. For all eight genes, the expression patterns from
RNA-Seq and qPCR agree very well visually and also are highly
correlated, with correlation coefficients ranging from 0.92 to
0.995 (see Supplemental Figure 2 online).
After validating our RNA-Seq results with qPCR, we applied
a generalized linear model analysis based on a negative binomial
distribution and conducted an overall test to determine which
genes vary in expression among any of the six treatment groups,
where a treatment group is defined by a strain-by-induction
condition combination (see Methods for details). While control-
ling the false discovery rate (FDR) at 2.5% using Benjamini and
Hochberg’s method (Benjamini and Hochberg 1995), we iden-
tified 3678 genes as differentially expressed (DE) among the six
treatment groups (see Supplemental Data Set 1 online). This
number is similar in scale to the 5884 DE genes at 30, 60, or 180
min after CO2 deprivation in wild-type C. reinhardtii cells re-
ported in the companion publication (Brueggeman et al., 2012).
The overall test identified genes with differential expression in
any of the six treatment groups. The transcript levels of these
genes might be affected by: (1) the CO2 concentration, (2) the
presence/absence of functional CIA5, and/or (3) the interaction
of CO2 concentration and the presence/absence of functional
CIA5. To provide more detailed information about how the CO2
level or the presence/absence of CIA5 affects gene expression,
we used a C/S impact model. Under this model, we separately
tested for a CO2 effect (due to varied CO2 levels; C-effect),
a strain effect (due to varied genotypes; S-effect), and an in-
teraction effect between CO2 levels and genotype (CS-effect)
using the generalized linear model (C/S impact test) as de-
scribed in Methods. When we control the FDR level at 2.5%, this
C/S impact test identifies most of the DE genes, with only 165 of
the 3678 DE genes identified from the overall test failing to show
significance for any one of the three possible effects. Among the
other 3513 genes, 2230 exhibit significant C-effect, 2787 exhibit
significant S-effect, and 372 exhibit significant CS-effect (see
Supplemental Data Set 1 online).
To facilitate a closer comparison of previously reported LCI
genes with our results, we also conducted a pairwise compari-
son of our expression data for the wild type in H-CO2, L-CO2,
and VL-CO2 conditions using the DESeq package (Anders and
Huber, 2010), which was reported to be one of the best methods
for identifying DE genes between two treatment groups (Kvam
et al., 2012). When we controlled FDR at level 2.5% using
Benjamini and Hochberg’s method (Benjamini and Hochberg,
1995), we identified 345 genes DE for the L-CO2 versus H-CO2
pairwise comparison and 696 genes DE for the VL-CO2 versus
H-CO2 pairwise comparison (see Supplemental Data Set 2 on-
line). Surprisingly, no genes were identified as DE for the VL-CO2
versus L-CO2 pairwise comparison.
Reproducibility across Laboratories
The companion study by Brueggeman et al. (2012) focused
exclusively on the effects of CO2 deprivation on gene expres-
sion. Their focus on the time course for induction from 0 to 3 h
nicely complements our study, which compares the impact of
CO2 deprivation and CIA5 on gene expression following a 4-h
induction in limiting CO2. Their findings support many of our
observations and conclusions regarding transcriptome changes
associated with CO2 deprivation. Nonetheless, the two studies
were conducted completely independently and involved sig-
nificant differences in experimental conditions (e.g., light and
1878 The Plant Cell
4. temperature) and in the C. reinhardtii strains used. Therefore, the
differences found in the patterns and the magnitude of gene
expression between these two studies are not unexpected (i.e.,
considerably lower interlaboratory reproducibility than intra-
laboratory reproducibility is expected). Further details about the
reproducibility of our expression estimates and their correlation
with results from our companion article can be found at the end
of Methods and in Supplemental Figures 3 to 5 online.
Clusters of Genes with Similar Expression Patterns
We applied a model-based clustering algorithm to identify dis-
tinct gene expression profiles among identified DE genes and
chose a total of 16 clusters to maintain as few tight clusters as
possible while including most of the distinct expression patterns
(Figure 1). Each gray line in Figure 1 represents the expression
pattern for an individual gene, and the single black line indicates
the average behavior for all genes in that cluster.
When sorted by cluster, the C/S impact test results (see
Supplemental Figure 6 online) confirmed many of the visually
observed patterns in the clusters. For example, gene expression
patterns in clusters 1, 2, 3, 10, 11, and 13, the CIA5 clusters,
appear to be affected mainly by the presence/absence of CIA5
but only minimally by CO2. In agreement with this, 1060 (;76%)
of the 1396 genes in these six CIA5 clusters exhibit only a sig-
nificant S-effect (no C-effect or CS-effect).
By contrast, the expression patterns in clusters 4, 7, and 9,
the CO2 clusters, appear to respond to variation in CO2, with
little apparent difference between the genotypes. Accordingly,
415 of the 764 genes in these three CO2 clusters exhibit only
a significant C-effect (no S-effect or CS-effect). Like those in the
CO2 clusters, genes in clusters 6 and 12 also exhibit visually
parallel changes in response to changing CO2 between the
genotypes but also show a slightly larger expression shift be-
tween the genotypes (Figure 1). Many genes in these two
pseudo-CO2 clusters exhibit C+S effects or only C-effect, but
the larger proportion of genes exhibiting S-effect distinguishes
them from the CO2 clusters (see Supplemental Figure 6 online).
Clusters 8, 14, and 15, the CCM clusters, exhibit a pattern of
induction or upregulation under limiting CO2 and repression by
the absence of CIA5. These three CCM clusters also contain a
considerable number of genes exhibiting significant C+S-effects
(both C- and S-effects) and C+S+CS-effects (all C-, S-, and CS-
effects) as well as a large number of genes exhibiting only S-effects
and few or no genes exhibiting only C-effects (see Supplemental
Figure 6 online).
Genes in clusters 5 and 16 show the mildest changes over the
six strain-by-treatment combinations (see Supplemental Figure
6 online) and exhibit a mix of genes with all three effects
(C-effect, S-effect, and CS-effect). These two clusters also in-
clude the largest proportion of genes that were detected by the
overall test but not the individual test for any one of the three
possible effects from the C/S impact model.
Functional Implications of the Gene Expression Clusters
In addition to the distribution of genes into clusters based on
similar expression patterns, we used two complementary methods
to examine the DE genes within each cluster for commonalities of
function: the Algal Functional Annotation Tool (Lopez et al., 2011)
and manual curation. In employing the Algal Functional Annotation
Tool, we used the Gene Ontology (GO) terms based on orthology
to Arabidopsis thaliana to overcome the limitation of available
annotations for C. reinhardtii. We compiled all GO terms that
showed statistical significance (P < 0.01) in at least one gene
cluster and generated a summary heat map to visualize an over-
view of the resulting functional information by clusters (see
Supplemental Figure 7 online). A detailed list of GO terms identi-
fied for the clusters can be found in Supplemental Data Set 3
online. In the heat map, GO terms were subjected to hierarchical
clustering so that gene clusters with common significant ontology
terms are placed close to each other in the tree. Although details
of the identified GO terms and associated genes corresponding to
the heat map are found in Supplemental Data Set 3 online,
Supplemental Figure 7 online illustrates that very few of the sig-
nificant GO terms (20 out of 210) overlap among any of the 16
cluster entries, which suggests that the genes separated into
clusters based on distinctive expression patterns also tend to be
involved in varied biological processes, providing independent
support for our clustering results.
In addition to tabulating the significant GO terms associated
with each gene cluster, the total number of unique genes rep-
resented within all of the significant GO categories for each
cluster was determined. For example, Table 1 indicates that 22
GO terms were identified by the Algal Functional Annotation
Tool to be associated with cluster 1, but these 22 GO terms
represent only three unique genes, since each of the three genes
is associated with multiple GO terms. This example is not
unique; in many of the clusters, the significant GO category hits
represented only a small number of individual genes, even if the
number of GO category hits was high. On the other hand, 60
unique genes (32.1% of the genes) in cluster 5 were included
among the significant GO term hits. However, only in six of the
clusters, (4, 5, 6, 9, 10, and 11) were at least 8% of the genes in
the cluster identified among the GO hits.
Because of the relative paucity of functional annotation in the
C. reinhardtii genome, the Algal Functional Annotation Tool was
unable to provide much functional information for more than
a few gene clusters. Therefore, we also employed manual cu-
ration to place DE genes into eight broad functional categories
(see Supplemental Data Set 4 online). Not surprisingly, the most
abundant manual functional category of DE genes in all 16
clusters was “unknown,” which is represented by the difference
between 100% and the sum of all other functional categories for
each cluster in Figure 2 and accounts for 38 to 62% of the genes
in each. Among the 16 clusters, the most abundant of the eight
manual categories after “unknown,” are “metabolism,” “signaling,”
and “gene expression and regulation.” The relative distribution
of DE genes among these eight manually curated categories is
illustrated for each gene cluster in Figure 2, and a compilation of
the primary functional category in each cluster identified as in-
cluding the largest proportion of genes (excluding the “un-
known” category) is summarized in Table 1.
No single functional category among the genes in each major
cluster group (CIA5, CO2, and CCM clusters) was consistently
apparent by either method. However, those CIA5 clusters (1, 3,
Transcriptome Profile for C. reinhardtii CCM 1879
5. and 10) with higher gene expression in the wild type all have
signaling as the primary functional category, whereas those
clusters (2, 11, and 13) with higher gene expression in cia5 have
metabolism as the primary functional category. Furthermore, the
functional categories of signaling and gene expression together
accounted for more than half of the genes in CIA5 clusters 1, 3,
and 10, excluding the unknown category. Of these CIA5 clus-
ters, only clusters 10 and 11 contained more than 8% of the
genes identified as GO category hits, but these GO hits agreed
with the primary functional category of signaling for cluster 10, in
that they fell in the general areas of intracellular trafficking,
proteolysis, and regulation of processes, and of metabolism for
cluster 11, in that they fell in the general area of metabolic
processes (see Supplemental Data Set 3 online).
Similarly, the CO2 cluster 9 with increased transcript abun-
dance at higher CO2 concentrations has gene expression as the
primary functional category, whereas those clusters (4 and 7)
with increased gene expression at lower CO2 concentration
Figure 1. Clustering.
The expression patterns of 3678 selected DE genes for 16 clusters. The horizontal axis indicates each strain and CO2 induction condition: WV, the wild
type under VL-CO2 induction; WL, the wild type under L-CO2 induction; WH, the wild type under H-CO2 induction; MV, cia5 under VL-CO2 induction;
ML, cia5 under L-CO2 induction; MH, cia5 under H-CO2 induction. The vertical axis indicates the log2 fold change calculated between each condition
and the average across all six conditions. Each gray line symbolizes the expression pattern of one gene, and the bold back line illustrates the average
expression pattern of all genes in each cluster.
1880 The Plant Cell
6. have metabolism as the primary functional category. Further-
more, the functional categories of gene expression and signaling
combined accounted for more than half of the genes in CO2
cluster 9, excluding the unknown category. Of the three CO2
clusters, only 4 and 9 each contained more than 8% of the
genes identified as GO category hits, and in both cases, these
GO hits agreed with the primary functional category identified. In
CO2 cluster 9, which had gene expression as its primary func-
tional category, the GO category hits fell in the general areas of
RNA processes and nitrogen metabolism (see Supplemental
Data Set 3 online). For CO2 cluster 4, which had metabolism
identified as its primary functional category, the GO category hits
fell in the general area of catabolic processes (see Supplemental
Data Set 3 online), and a large proportion of the cluster 4 genes
in the manually curated metabolism category were putative
catabolic genes (see Supplemental Data Set 4 online).
Among the CCM clusters, the various functional categories
appeared to be relatively evenly dispersed, with the exception of
cluster 15. Although cluster 15 had the somewhat common
category of metabolism as its primary functional category, it is
notable in having, among all the clusters, the highest proportion
(;14%) of manually curated genes in the transport functional
category.
Key CO2 Assimilation-Related Genes and Pathways
In addition to the segregation of genes into broad functional
categories, we also analyzed the distribution of specific groups
of genes among the gene expression pattern clusters, such as
previously reported LCI genes, Calvin cycle genes, photo-
respiratory pathway genes, and CA genes.
Of 2274 genes exhibiting a C-effect and/or a CS-effect (see
Supplemental Data Set 1 online), and thus indicating a statistically
significant response to CO2 concentration, 1350 were upregulated
in wild-type L-CO2 versus H-CO2, and 418 had a fold change of
2 or greater. This selection of genes is the most comparable to
Table 1. GO Categories of Clusters
Clusters Functional Annotation Tool Manual Curation
Cluster
Total
Genes
Cluster
Group
GO
Terms
Unique
Genes
Unique
Genes (%) Main GO Termsa
Primary Functional
Category Total (%)
1 124 CIA5 22 3 2.4% N/S Signaling 16%
2 95 CIA5 9 4 4.2% N/S Metabolism 19%
3 387 CIA5 25 8 2.1% N/S Signaling 14%
4 150 CO2 45 15 10.0% Catabolic processes Metabolism 24%
5 187 – 33 60 32.1% Biosynthetic processes Metabolism 29%
6 240 – 10 30 12.5% RNA modification; protein localization Gene expression regulation 23%
7 243 CO2 4 7 2.9% N/S Metabolism 16%
8 360 CCM 6 8 2.2% N/S Metabolism 12%
9 371 CO2 23 49 13.2% RNA processes, nitrogen metabolism Gene expression regulation 28%
10 460 CIA5 34 63 13.7% Intracellular trafficking, proteolysis,
regulation of processes
Signaling 19%
11 183 CIA5 10 15 8.2% Small molecule metabolic processes Metabolism 22%
12 463 – 1 3 0.7% N/S Signaling 13%
13 147 CIA5 2 3 2.0% N/S Metabolism 32%
14 138 CCM 6 3 2.2% N/S Signaling 14%
15 35 CCM 3 1 2.9% N/S Metabolism 20%
16 95 – 1 3 3.2% N/S Metabolism 20%
Summary of the identified GO terms and primary functional categories within the 16 clusters using the Algal Functional Annotation tool and manual
curation, respectively.
aN/S indicates that significant GO term hits included less than 5% of the unique genes in the cluster.
Figure 2. Distribution of Genes in Manual Functional Categories within
Each Cluster.
The functional categories (protein modification and regulation, cell
structure and function, stress and cell death, metabolism, transport,
gene expression and regulation, and signaling) were determined manu-
ally based on a combination of existing annotation and automated
identification of functional domains. Percentages indicate the sum of
genes in each functional category (indicated by color). The difference
between the summed percentage and 100% represents the “unknown”
category, which is not included.
Transcriptome Profile for C. reinhardtii CCM 1881
7. classic LCI genes reported previously (Chen et al., 1996;
Somanchi and Moroney, 1999; Miura et al., 2004; Wang et al.,
2005; Wang and Spalding, 2006; Yamano and Fukuzawa, 2009).
We selected 106 of these previously reported LCI genes for
a direct comparison with genes identified as having a C-effect or
CS-effect. Among these 106 previously reported LCI genes, 49
exhibit a C-effect or CS-effect, and 45 of these were upregu-
lated in either L-CO2 or VL-CO2 conditions compared with
H-CO2 in the wild-type strain (see Supplemental Data Set 5
online). We also used a recently proposed statistical method
implemented in the Bioconductor package DESeq (Anders and
Huber, 2010) to perform a direct, pairwise comparison of gene
expression for H-CO2 versus either L-CO2 or VL-CO2, which
identified a highly overlapping but slightly different list of 40
previously reported LCI genes as upregulated in our experiment.
In combination with the C/S impact model, the DESeq analysis
supports 53 of the previously reported LCI genes as upregulated
in either L-CO2 or VL-CO2 (see Supplemental Data Set 5 online).
Data included in our companion article (Brueggeman et al.,
2012) demonstrate a low-CO2 upregulation of 40 of the 106
previously identified LCI genes, and 35 of these overlap with the
53 genes identified here as being upregulated by L-CO2 or VL-
CO2. In combination, our data and the data from Brueggeman
et al. (2012) provide support for upregulation of 60 of the 106
previously reported LCI genes. In addition to showing down-
regulation for three of the same four previously reported LCI
genes that our data identify as downregulated, our companion
article identifies an additional two previously reported LCI genes
that exhibit downregulation under their experimental conditions
(see Supplemental Data Set 5 online).
From our list of 49 previously reported LCI genes showing
a C-effect or CS-effect, 36 genes fall into the CCM clusters (8,
14, and 15), and an additional seven genes in the CCM clusters
were identified as upregulated in L-CO2 or VL-CO2 based on the
pairwise DESeq analysis (see Supplemental Data Set 5 online).
To explore this relationship further, we selected 10 intensively
studied, CIA5-regulated, LCI genes (CAH1, CAH3, CCP1,
CCP2, HLA3, LCIA, LCIB, LCIC, LCI1, and LCR1; highlighted
in Supplemental Data Set 5 online) implicated as functionally
involved in the CCM (Spalding, 2008; Wang et al., 2011) and
found all to be contained in CCM clusters 8, 14, and 15, and all
except CAH3 were identified as DE by our companion article
(Brueggeman et al., 2012). Figure 3 provides a schematic model
of the proposed C. reinhardtii CCM, including Ci uptake and
accumulation processes (modified from Wang et al., 2011), in-
cluding identified and proposed locations of the various CAs
(Moroney et al., 2011). A major proportion of the CCM/CA genes
in this model were included in CCM clusters 15, 14, or 8, pro-
viding additional validation of our clustering results.
Although a large proportion of the previously reported LCI
genes identified here as DE genes were found to be associated
with CCM clusters 8, 14, and 15, a substantial number also were
associated with CO2 clusters 7 and 9. Of the 53 previously re-
ported LCI genes supported by our data, seven fell into CO2
cluster 7, four genes fell into CO2 cluster 9, and one each into
CIA5 clusters 11 and 12 (see Supplemental Data Set 5 online).
Six previously reported LCI genes that were not supported as
LCI genes by our data (i.e., no C-effect or CS-effect and not DE
based on the DESeq analysis) were identified as DE genes but
fell mostly into CIA5 clusters 3, 10, 11, and 13.
By visual inspection, the gene expression pattern in CCM
cluster 15 shows very low expression in H-CO2 and induction in
VL-CO2 and L-CO2 conditions for the wild type and very low
expression in any CO2 conditions for the cia5 mutant. CCM
clusters 8 and 14, on the other hand, show only upregulation of
expression under VL-CO2 and L-CO2 conditions for the wild
type, relative to the modest expression in H-CO2 conditions, and
almost equally low expression under any CO2 conditions for the
cia5 mutant. Thus, the patterns for CCM clusters 8, 14, and 15
progress from mild upregulation of expression to high-level in-
duction, respectively. Only 35 genes showed the high-level in-
duction and were grouped in CCM cluster 15, so every gene in
this cluster is listed in Table 2, and all genes in clusters 8, 14,
and 15 are listed in Supplemental Data Set 6 online.
Based on our manual functional curation, CCM cluster 15
contains a relatively large proportion of genes in the manually
annotated transport functional category (Figure 2) and includes
essentially all the genes for which there is either compelling
evidence for a Ci transport role for the gene product in the CCM
(LCIA, LCI1, and HLA3) or a strong argument for the gene
product as a good candidate for Ci transport (CCP1). As with all
Figure 3. Gene Cluster Distribution within a Hypothetical CCM/Ci
Transport Model.
The cluster label for each gene is indicated by a yellow octagon con-
taining a cluster number. In this schematic representation of the CCM,
most of the putative CCM elements and many previously identified CO2-
responsive genes, including the putative Ci transporters HLA3, LCI1,
LCIA, CCP1, and CCP2 and CCM-related CAs CAH1 and CAH3, and
other indentified CCM genes like LCIB and LCIC are indicated as having
expression patterns categorized in the “CCM clusters (clusters 8, 14, and
15).” This figure is modified from Wang et al. (2011), with the addition of
the LCI chloroplast membrane proteins CCP1 and CCP2 (Chen et al.,
1997) and CA locations (Moroney et al., 2011). Transport proteins with
demonstrated CCM function are shown in dark blue, known transport
proteins with suspected CCM function are shown in purple, predicted
but unknown transport proteins are shown in light blue, known soluble
enzymes are shown in red, and the soluble LCIB/LCIC complex is shown
in orange and yellow.
1882 The Plant Cell
8. the clusters, a large proportion (15/35) of the genes in CCM
cluster 15 falls into the “unknown” functional category. How-
ever, it is notable that five of the 15 genes of unknown function
in cluster 15 are putative transmembrane proteins.
Within CCM cluster 15, all 17 genes with significant C-effects
also exhibit S-effects (includes CAH1, CAH4, CAH5, LCI1,
LCR1, CCP1, HLA3, and LCIA), and eight of these (includes
CAH1, CAH4, CAH5, and CCP1) also have a significant CS-
effect. Seven genes that did not exhibit any significant C/S im-
pact effects have expression levels in the lowest 3% of genes,
with a mean RPKM lower than 0.023 for all seven genes. Of the
remaining 11 genes in CCM cluster 15 with significant expres-
sion levels, all exhibit only S-effect except one (protein ID
520458; also shows CS-effect).
CAs catalyze the reversible hydration of CO2 to HCO3
2 and
serve critical roles for the CCM (Moroney et al., 2011) (Figure 3).
Among the nine identified a and b CA genes (Table 3), CAH1,
CAH4, and CAH5 fell into CCM cluster 15 and have all three
significant C+S+CS-effects, as described above. These three
CA genes are strongly induced in low CO2 and thus may be
directly involved in the Ci transport and accumulation process of
the CCM or at least in the acclimation to low CO2. CAH3, the
thylakoid lumen CA required for dehydration of stromal HCO3
(Moroney et al., 2011), exhibits both significant C+S-effects and
was placed in cluster 8, which contains genes whose visual
expression patterns indicate modest upregulation in response to
limiting CO2. CA genes CAH8 and CAH9 showed mainly
S-effects and fell into CIA5 clusters 11 and 13, respectively, and
Table 2. Genes in Cluster 15
Name Protein IDa Descriptionb Average RPKMc Significant Effectsd Primary Functional Categorye
CAH1 522126 CA, periplasmic, a type 1223.8 C+S+CS Metabolism
CAH4 522732 Mitochondrial CA, b type 226.5 C+S+CS Metabolism
CAH5 522733 Mitochondrial CA, b type 157.3 C+S+CS Metabolism
CCP1 522130 LCI chloroplast envelope protein 162.0 C+S+CS Transport
CGL28 510019 RNA binding protein 200.7 C+S+CS Unknown
CYC6 516039 Cytochrome c6 1.2 S Metabolism
DNJ15 514023 DnaJ-like protein 12.8 S Gene Expression
DNJ31 518238 DnaJ-like protein 13.1 S Gene Expression
*HFO7 523344 Histone H4 <0.1 – Gene Expression
HLA3 518934 ATP binding cassette transporter 289.5 C+S Transport
*KIR1 526069 Keto acid isomerase-like protein <0.1 – Unknown
LCI1 520703 LCI membrane protein 224.0 C+S Transport
LCI23 523507 LCI protein 75.8 C+S Unknown (TM)
LCIE 522129 LCIB-like gene 1.6 S Metabolism
LCR1 519760 Low-CO2 response regulator 79.0 C+S Gene Expression
LHCSR2 525378 Stress-related chlorophyll a/b binding protein 2 45.7 C+S+CS Metabolism
LHCSR3 525376 Stress-related chlorophyll a/b binding protein 3 51.7 C+S+CS Metabolism
NAR1.2 524076 Anion transporter; LCIA 209.7 C+S Transport
– 516770 PRLI-interacting factor L 44.9 S Signaling
– 509757 Acetyltransferase 27.5 C+S Unknown
– 519249 Ser/Thr protein kinase 53.5 S Signaling
– 522781 ND 4.85 S Unknown (TM)
– 516290 ND 51.5 C+S Transport
– 510680 ND 44.6 C+S Unknown (TM)
– 520458 ND 20.7 S+CS Unknown
– 512353 ND 16.8 C+S+CS Unknown (TM)
– 522486 ND 8.7 C+S Signaling
– 524386 ND 6.4 S Unknown (TM)
– 524387 ND 2.3 S Unknown
*– 512735 ND <0.1 S Unknown
*– 519540 ND <0.1 – Unknown
*– 522103 ND <0.1 – Unknown
*– 510710 ND <0.1 – Signaling
*– 518019 ND <0.1 – Unknown
*– 511100 ND <0.1 – Unknown
Asterisks indicate genes with an average expression level lower than 0.05 RPKM and “–” indicates unnamed gene.
a
Augustus 5.0 gene model protein ID.
b
ND means no description available.
c
Average RPKM across all six treatment conditions.
d
Individual effect having a q-value <0.025 by C/S impact test, where “C” means CO2 effect, “S” means strain effect, “CS” means interaction effect, and
“–” means no significant C/S impact effect.
e
Result from our manual curation, where “unknown (TM)” indicates gene of unknown function containing at least one putative transmembrane domain.
Transcriptome Profile for C. reinhardtii CCM 1883
9. CAH6 showed both C+S-effects and fell into cluster 12. CAH2
and CAH7 were not identified as DE genes.
We also scrutinized the genes encoding enzymes of the
Calvin cycle and the photorespiratory pathway (Spalding, 2009),
since these important carbon metabolism pathways are ex-
pected to respond to CO2 concentration (Figure 4). Eight of the
15 genes involved in the Calvin cycle were DE in our experiment.
Two fructose bisphosphate aldolase genes FBA1 and FBA3, the
sedoheptulose bisphosphatase gene SEBP1, and one of the
two Rubisco small subunit genes, RBCS1, were found in CIA5
clusters 11 and 13, both of which show increased gene ex-
pression in the cia5 mutant but relatively little effect of CO2
concentration. Two critical kinase-encoding genes, phospho-
glycerate kinase1 (PGK1) and phosphoribulokinase1 (PRK1), and
the fructose bisphosphatase gene FBP1 were included in cluster
5, which shows a pattern of mildly increasing gene expression
with increasing CO2 concentration as well as mildly increased
gene expression in the cia5 mutant. The ribose-5-phosphate
isomerase1 (RPI1) gene was in CO2 cluster 9, which shows
significantly increased expression under higher CO2 concen-
tration but only modest expression increase in the cia5 mutant.
Thus, aside from PGK1 and RPI1, in which both C-effect and
S-effect were detected, all DE genes from the Calvin cycle show
only S-effects and increased expression in cia5.
On the other hand, the expression of photorespiratory path-
way genes was strongly affected by the CO2 concentration;
many of the genes were upregulated in L-CO2 and VL-CO2
(Figure 4). Accordingly, the photorespiratory genes alanine
aminotransferase1 (AAT1), glycerate kinase (GLYK), glycolate
dehydrogenase (GYD1), hydroxypyruvate reductase1 (HPR1),
and serine glyoxylate aminotransferase1 (SGA1) and all Gly de-
carboxylase complex subunit genes, except glycine cleavage
system, H-protein (GCSH) and dihydrolipoyl dehydrogenase1
(DLDH1), fell into CCM cluster 8, even though the Algal Func-
tional Annotation Tool only identified two genes, AAT1 and
HPR, among the GO hits for photorespiration in cluster 8
(see Supplemental Data Set 3 online). These cluster 8 photo-
respiratory genes, which encode enzymes spanning the entire
pathway from glycolate to phosphoglycerate, appear to be
regulated by both CIA5 and CO2; accordingly, all exhibited
C-effects and S-effects, and all, except AAT1 and HPR1, ex-
hibited CS-effects.
Of those photorespiratory pathway genes not in CCM cluster
8, GCSH and serine hydroxymethyltransferase3 (SHMT3) were
found in CIA5 clusters 10 and 13, respectively, with S-effects
only, SHMT1 was captured in CO2 cluster 7 with only significant
C-effect, and alanine-glyoxylate transaminase1 (AGT1) was
found in cluster 12 with a significant C+S-effect. Some photo-
respiratory genes, such as the three phosphoglycolate phos-
phatase genes PGP1, PGP2, and PGP3, were not identified as
being DE in our experiment even though phosphoglycolate
phosphatase activity was reported to increase in response to
limiting CO2 (Marek and Spalding, 1991; Tural and Moroney,
2005). One isoform of Ala-glyoxylate transaminase (AGT2), one
isoform of Ser hydroxymethyltransferase (SHMT2), and the Gly
decarboxylase complex subunit DLDH1 also were not identified
as DE genes under the conditions used.
DISCUSSION
Identification of DE Genes
In this article, our primary objective was to gain insight into the
transcriptome-wide changes in the patterns of gene expression
that occur in response to the interaction between CO2 con-
centration and the transcription regulator CIA5. An additional
benefit expected was the identification of candidate genes that
may play significant roles in the CCM. To address these ob-
jectives, we analyzed the gene expression profiles of two gen-
otypes, the wild type (137c) and cia5, under three different CO2
concentrations using an overall test to identify 3678 genes that
showed differential expression in at least one of the six treat-
ments (two genotypes 3 three conditions). This identification of
over 3600 DE genes, which represents almost 20% of the C.
reinhardtii transcriptome, revealed massive changes in gene
expression in response to the combination of CO2 concentration
changes and the presence/absence of CIA5.
Table 3. CAs
Name Protein IDa Description and Subcellular Location q-Valuesb Clusterc Significant Effectsd
CAH1 522126 a-CA, periplasm 3.4E-04 15 C+S+CS
CAH2 522125 a-CA, periplasm 3.2E-01 – –
CAH3 526413 a-CA, thylakoid lumen 1.5E-02 8 C+S
CAH4 522732 b-CA, mitochondria 2.7E-03 15 C+S+CS
CAH5 522733 b-CA, mitochondria 3.4E-03 15 C+S+CS
CAH6 512520 b-CA, chloroplast stroma 5.4E-03 12 C+S
CAH7 515107 b-CA, unknown 2.5E-02 – –
CAH8 526207 b-CA, plasma membrane 1.6E-02 11 S
CAH9 522626 b-CA, cytoplasm 2.3E-02 13 S
a
Augustus 5.0 gene model protein ID.
b
q-values calculated by overall test.
c
A “–” indicates the gene was not identified as DE in overall test.
d
Individual effect having a q-value <0.025 by C/S impact test, where “C” means CO2 effect, “S” means strain effect, “CS” means interaction effect, and
“–” indicates the gene was not identified as DE in overall test so was not included in C/S impact test.
1884 The Plant Cell
10. Figure 4. Genes Involved in the Calvin Cycle and Photorespiration.
(A) Schematic of the Calvin cycle and photorespiration pathway in C. reinhardtii (Spalding, 2009). Yellow boxes indicate genes involved in each reaction,
and the red numbers in parentheses indicate the cluster in which each gene was found.
(B) Summary of detailed information about each gene. C, cluster number (a “-” indicates the gene was not identified as DE in overall test and not
assigned a cluster); S.E., significant effects, which are individual effects having a q-value <0.025 by the C/S impact test, where C is CO2 effect, S is
strain effect, CS is CO2 and strain interaction effect, and “-” indicates the gene was not identified as DE in overall test so was not included in C/S impact
test.
Transcriptome Profile for C. reinhardtii CCM 1885
11. Further detailed analysis of the 3678 DE genes was performed
using two additional methods: (1) C/S impact tests for C-effects,
S-effects, and CS-effects, for each gene; and (2) a cluster anal-
ysis of the gene expression patterns across the six conditions.
Whereas cluster analysis grouped DE genes with similar ex-
pression patterns, the C/S impact test provided quantitative
evaluations of individual environmental induction and strain
effects. The majority of genes identified as DE genes by the
overall test showed one or more significant C/S impact effects
when tested for C-, S-, and CS-effects. Only ;5% (165 out of
3678) of the DE genes identified by the overall test were not
identified as having significant individual effects in the C/S im-
pact test, possibly due to different power of detection inherent
in the overall test and the C/S impact test.
Cluster analysis, in combination with identification of indi-
vidual C-effects, S-effects, and CS-effects, revealed clusters of
genes regulated primarily by CIA5 (predominantly S-effects;
CIA5 clusters), regulated primarily by CO2 (predominantly
C-effects; CO2 clusters), and regulated by interaction of CO2 and
CIA5 (predominately CS-effects and combinations of C-effects,
S-effects, and CS-effects). The delineation of these clusters
directly addressed our overall objective of gaining insight into
the patterns of gene expression in response to interaction be-
tween CO2 and CIA5, as well as revealing specific genes regu-
lated by CO2, by CIA5, and by the interaction of CO2 and CIA5.
Based on reports of induction or upregulation of CCM-related
genes in low CO2, genes functionally involved in the C. rein-
hardtii CCM were expected to be among the third general group
of genes, those regulated by both CO2 and CIA5.
Comparison with Previously Reported LCI Genes
Although our major objective was to discover a spectrum of
gene expression patterns in response to the interaction between
CO2 and CIA5, we also performed direct pairwise comparisons
in the wild-type strain between H-CO2 and either L-CO2 or VL-
CO2 to provide a more detailed analysis of the differential ex-
pression of genes in response to low or limiting CO2. Because of
the historical connection between low-CO2 upregulated genes
and the CCM, we included these DESeq analyses to enrich the
comparisons between previously reported LCI genes and DE
genes identified in this study.
Because of the interest in the CCM specifically, at least 106
genes have been reported as LCI genes, many of which also
reportedly require CIA5 for differential expression (Chen et al.,
1996; Somanchi and Moroney, 1999; Miura et al., 2004; Wang
et al., 2005; Wang and Spalding, 2006; Yamano and Fukuzawa,
2009). Some of these LCI genes, such as CAH3, LCI1, LCIA,
LCIB, and HLA3, reportedly play important roles in the C. rein-
hardtii CCM (Galván et al., 2002; Wang and Spalding, 2006;
Duanmu et al., 2009a, 2009b; Ohnishi et al., 2010), and the
function of others, such as CCP1, CCP2, and LCIC, in the CCM
also has been implicated (Pollock et al., 2004; Wang and
Spalding, 2006; Yamano et al., 2010). However, only 53 of 106
previously reported LCI genes were supported as L-CO2 or VL-
CO2 upregulated DE genes in this study. This discrepancy is not
unexpected because the different strains and different light, CO2
concentration, and other environmental conditions used among
the various studies almost certainly will result in variations in the
genes responding and because DE gene identification may be
impacted by a shifting in the population distribution among the
cell division cycle phases in response to a shift from H-CO2 to
L-CO2 conditions (Dillard et al., 2011). In addition, the 4-h induction
time used here may not identify genes that are DE only earlier or
later than 4 h. Indeed, the companion article by Brueggeman et al.
(2012) documents significant changes in gene expression during
a 3-h time course following CO2 depletion but also reports the lack
of induction of several previously reported LCI genes. Only 40
previously reported LCI genes were supported by Brueggeman
et al. (2012) as low-CO2 upregulated. In combination with those
supported by our data, 60 previously reported LCI genes are
supported as upregulated under the conditions used in the two
studies combined.
Many previously reported LCI genes have not been further
characterized or confirmed beyond initial observations, which in
many cases used no statistical procedure to control FDRs
(Miura et al., 2004; Yamano and Fukuzawa, 2009). The greater
sensitivity of RNA-Seq and our more reliable statistical approach
provide significant advantages over previous studies. Therefore,
in addition to the impact of environmental and strain differences
on the absence of some LCI genes from our list of DE genes,
some previously reported LCI genes may not represent bona
fide LCI genes. Our data indicate that four previously reported
LCI genes are actually downregulated by L-CO2 or VL-CO2, and,
in addition to supporting the downregulation of three of these
four genes, our companion article (Brueggeman et al., 2012)
identified two more previously reported LCI genes as down-
regulated by low CO2.
The results reported here and in our companion article
(Brueggeman et al., 2012) complement and extend past reports
of differential expression by supporting 60 previously reported LCI
genes, directly contradicting six others, and leaving the remaining
40 as not clearly supported under the conditions used in the two
studies. In addition, the two companion studies identified a large
number of additional genes as regulated by CO2, CIA5, or both.
CCM Clusters
Of 57 previously reported LCI genes identified in this study as
DE genes, 43 fell into the CCM clusters 8, 14, and 15, all of
which exhibited expression patterns expected for classic LCI
genes (i.e., high expression for the wild type in L-CO2 and VL-
CO2 but lower expression in H-CO2 and consistently lower ex-
pression in cia5 under all CO2 concentrations). In addition to
those in the CCM clusters, 11 of the previously reported LCI
genes, including four that were downregulated by low CO2, fell
into CO2 clusters 7 and 9, which exhibit little impact of the
presence/absence of CIA5, suggesting that the genes included
are not likely to be involved in the CCM. This illustrates an im-
portant value of sorting gene expression patterns into clusters,
which provide richer insight into the identification of likely
functional CCM genes than provided by the LCI approach alone.
The CCM cluster 15 contains only 35 of the 3678 DE genes
but may be a rich source of candidate functional CCM genes. Of
the 35 genes in cluster 15, eight have RPKM expression levels
lower than 0.05 across all conditions, making them unlikely
1886 The Plant Cell
12. candidates for a significant role in the CCM. The remaining 27
genes in CCM cluster 15, which includes all the genes that
encode transport proteins strongly implicated or suspected as
Ci transporters as well as the CCM regulatory gene LCR1, the
LCIB-like gene LCIE, and the well-studied CA genes CAH1,
CAH4, and CAH5 must be good candidates for a functional or
regulatory role in the C. reinhardtii CCM. Considering the burden
of transporting one of the highest flux inorganic nutrients, as well
as the selection against wasting energy on transport when CO2
is abundant, such an expression pattern is not surprising for
genes encoding Ci transporters and other conditionally critical
CCM components.
Among the remaining genes of CCM cluster 15, four encoding
stress-induced light harvesting chlorophyll proteins, stress-
related light harvesting complex protein2 (LHCSR2) and LHCSR3,
and DnaJ-like, putative chaperonins, DNJ15 and DNJ31, may
represent general stress response elements, and a few genes,
such as 522486 (putative guanylate cyclase), 519249 (putative
protein kinase), and 516770 (putative PRLI interacting factor),
encode potential signaling elements. However, the most intriguing
group of cluster 15 genes may be the six unknown or little known
transmembrane protein–encoding genes, including 524386,
512353, 510680, 522781, 516290, and 523507, since their ex-
pression patterns parallel those of all likely transporter-encoding
genes so far identified. Therefore, these genes rank high as pos-
sible undiscovered Ci transporters.
Key CO2 Assimilation-Related Genes and Pathways
outside the CCM
CAs are expected to play important roles in microalgae because
of the poor solubility and diffusion rate of CO2 in water and the
critical importance of interconversion of these Ci forms in-
ternally. Of the nine confirmed a-CA and b-CA genes (Moroney
et al., 2011), seven were identified as DE genes in our experi-
ment (Table 3, Figure 3), which is not unexpected given the
importance of Ci uptake and accumulation in the CCM and the
well-known differential expression of the three CCM cluster 15
CA genes. S-effect appeared to influence more CA genes than
C-effect and CS effect, which reinforces our thoughts about the
extent of CIA5 influence. Also, this study confirms CAs as im-
portant functional targets for further study regarding the dy-
namics of the CCM.
The expression of a number of Calvin cycle genes, including
one Rubisco small subunit gene, was impacted by the cia5
mutation. DE genes encoding Calvin cycle enzymes were found
in clusters 5, 9, 11, and 13, all of which exhibit increased ex-
pression in cia5 relative to the wild type but which vary in their
responses to changes in CO2 concentration. Reinforcing the
implication that the Calvin cycle DE genes respond primarily to
CIA5, all these genes exhibited a significant S-effect, with only
two, PGK1 (cluster 5) and RPI1 (CO2 cluster 9), exhibiting
a significant C-effect. Although we have no clear explanation for
a CIA5 role in regulation of several Calvin cycle genes, the in-
creased expression of these genes in the cia5 mutant argues for
a role of CIA5 in carbon assimilation independent of the CO2
concentration. This observation may reflect a role for CIA5 as
a repressor of Calvin cycle genes under as yet unidentified
conditions, where the absence of CIA5 activity might result in
a modest increase in expression of these Calvin cycle genes.
Photorespiration results from the low specificity of Rubisco
and competes with CO2 assimilation via the Calvin cycle, so
lower CO2 concentrations increase the Rubisco oxidase reaction
relative to the carboxylase reaction and increase the demand for
photorespiratory enzymes. The apparent regulation of a number
of these genes by CIA5 and CO2 is consistent with previous
reports of low-CO2 induced expression of photorespiratory
pathway genes (Marek and Spalding, 1991; Tural and Moroney,
2005), but, contrary to previous reports, we did not see differ-
ential expression of any PGP genes. This discrepancy might be
explained if PGP activity is regulated at the post transcriptional
level or if the change in PGP gene expression occurs in a time
frame not captured by our 4-h induction time point. Unlike the
DE Calvin cycle genes, most of the DE photorespiratory path-
way genes exhibited significant C-, S-, and CS-effects, rather
than just significant S-effects, demonstrating that many of the
photorespiratory pathway DE genes are regulated by both CO2
and CIA5.
Not all photorespiratory genes appear to be regulated by
CIA5, but the apparent regulation of a large fraction of them by
this protein argues that CIA5 plays a significant role in regulation
of the photorespiratory pathway. Notably, those photores-
piratory pathway genes that exhibit significant S-effect show a
differential expression opposite to that of the Calvin cycle genes
(i.e., they have increased expression in the wild type relative to
cia5). This expression pattern across the genotypes is consis-
tent with CIA5 acting as an inducer of photorespiratory pathway
genes in contrast with its putative role as a mild repressor of
several Calvin cycle genes.
CIA5 Clusters and the Impact of CIA5
CIA5 appears to serve much broader and more extensive roles
than indicated by the phenotype of cia5, which grows similar to
the wild type either heterotrophically or mixotrophically in ace-
tate or photoautotrophically in H-CO2 and even grows slowly in
L-CO2 (Spalding, 2008). Most genes in CIA5 clusters 1, 2, 3, 10,
11, and 13 show clear regulation by CIA5 but little regulation by
CO2 concentration, indicating that low-CO2 activation of CIA5
is not always required for function of CIA5. More than 76% of
the 1396 genes in these six clusters exhibit only a significant
S-effect (no C-effect or CS-effect), and, including genes that
also show a significant C-effect or CS-effect, almost 95% ex-
hibit a significant S-effect. Furthermore, of 3678 identified DE
genes, over 62% show a significant S-effect, including those
that also exhibit a significant C-effect and/or CS-effect, and
more than half of those genes regulated directly or indirectly by
CIA5 show only a significant S-effect. Thus, almost 15% of all C.
reinhardtii genes are regulated in some way by CIA5, and almost
7.5% of all genes are regulated by CIA5 independent of any
changes in the CO2 concentration.
CIA5 is very likely involved in the upstream regulation of
multiple physiological processes, and, although its own tran-
script abundance does not change, the presence/absence of
CIA5 (and its potential activation/inactivation) may have a major
impact on the expression of genes encoding many secondary
Transcriptome Profile for C. reinhardtii CCM 1887
13. regulatory genes, including those encoding transcription factors
and signal transduction components involved in regulation of
a number of processes. Consistent with this expectation, man-
ual curation and, in most cases, the Functional Annotation Tool,
identified signaling or signaling plus gene expression as key
functional categories for the three CIA5 clusters with increased
expression in the wild type, arguing that when the presence of
CIA5 increases transcript abundance for specific genes, it appears
to do so as an upstream activator of positive signaling pathways
and/or other gene expression activators. On the other hand, both
manual curation and the Functional Annotation Tool pointed to
metabolism as the primary functional category for the three CIA5
clusters in which the presence of CIA5 resulted in decreased ex-
pression of specific genes (decreased expression in the wild type).
Thus, when the presence of CIA5 coincides with the repression of
specific genes, CIA5 appears to act as an upstream repressor of
specific metabolic functions. Notably, half of the Calvin cycle
genes identified as DE fall into these three CIA5 clusters, and most
of the others fall in cluster 5, which has somewhat similar char-
acteristics, including decreased gene expression in the wild type
and metabolism as primary functional category.
CO2 Clusters and the Impact of CO2
Regulation of gene expression by CO2 concentration also ap-
pears to be more extensive than expected. Most genes in the
CO2 clusters 4, 7, and 9 show clear CO2 concentration regu-
lation but little or no apparent effect of CIA5. Almost 55% of
the 764 genes in these three clusters exhibit only a significant
C-effect (no S-effect or CS-effect), and, when including those
genes that also show a significant S-effect or CS-effect, over
90% exhibit a significant C-effect. Furthermore, of 3678 identi-
fied DE genes, over 60% show a significant C-effect, including
those that also exhibit a significant S-effect and/or CS-effect,
and ;30% of those genes regulated directly or indirectly by CO2
concentration show only a significant C-effect. Thus, CO2 con-
centration significantly affects the expression of over 60% of the
DE genes, and more than 14% of all genes detected in this
experiment. This means that ;14% of all C. reinhardtii genes are
regulated by CO2 concentration, most of which (over 10% of the
genes) also exhibit some form of CIA5 regulation. However, al-
most 4% of all genes are regulated by CO2 apparently in-
dependent of CIA5.
Manual curation and the Functional Annotation Tool both
identified gene expression as the key functional category for the
CO2 cluster (cluster 9) with decreased expression of genes in
L-CO2 or VL-CO2 relative to H-CO2, which is consistent with either
limiting CO2 acting as an upstream repressor or elevated CO2
acting as an upstream activator, respectively, of genes involved
in regulation of gene expression. On the other hand, manual
curation and, in one case, the Functional Annotation Tool,
identified metabolism as the primary functional category for the
two CO2 clusters (clusters 4 and 7) with increased expression of
genes in L-CO2 or VL-CO2 relative to H-CO2, which is consistent
with either limiting CO2 acting as an upstream activator or ele-
vated CO2 acting as an upstream repressor, respectively, of
genes involved in specific metabolic functions. Notably, both
functional characterizations of cluster 4 revealed enrichment in
putative catabolic genes, suggesting that low CO2 concen-
trations cause starvation and stimulate the expression of genes
involved in degrading and remobilizing existing molecules.
More generally, the abundance of metabolism as a primary
functional category in nine of the 16 gene clusters, including
CIA5 clusters 2, 11, and 13, CO2 clusters 4 and 7, and CCM
clusters 8 and 15 suggests that a major impact of changes in
CO2 and CIA5 is on the expression of genes encoding metabolic
enzymes. This seems reasonable, since large changes in me-
tabolism may well accompany substantial changes in CO2
concentration. These conjectures also are strongly supported by
Brueggeman et al. (2012), who report a marked decrease in
expression of numerous genes involved in anabolic processes
following CO2 deprivation. Alternatively, the high frequency of
metabolism as a primary functional category also may reflect an
annotation bias; metabolism-related genes may be easier to
annotate, resulting in their disproportionate representation among
the manually annotated genes.
Multiple Acclimation States
Although there is compelling evidence demonstrating a distinc-
tion between the VL-CO2 and L-CO2 acclimation states of C.
reinhardtii, none of our transcriptome analyses identified any
genes DE between the VL-CO2 and L-CO2 induction conditions
for the wild type. Since a large number of DE genes were
identified for L-CO2 or VL-CO2 versus H-CO2 conditions, the
apparent absence of DE genes in the VL-CO2 versus L-CO2
comparison likely reflects at least a paucity of DE genes dis-
tinguishing these two acclimation states under the conditions
used. Based on our data, we suggest at least two possible
conclusions regarding the distinction between the L-CO2 and
VL-CO2 acclimation states: (1) These two acclimation states are
controlled at levels beyond transcript abundance, or (2) differ-
ential expression of genes distinguishing these two acclimation
states is evident only earlier or later than the 4-h acclimation
time used in our experiment. On the other hand, if we assume
a very limited number of genes are DE in VL-CO2 versus L-CO2
under our experimental conditions, our one-time test of >15,000
genes may have elevated the problem of multiple testing and
reduced our power of detection. To test this assumption, future
experiments could increase the number of biological replicates
and/or sequence to a greater depth of coverage.
Summary
This transcriptome study resulted in a number of new insights
regarding the global regulation of genes by CO2 concentration,
by CIA5, and by the combination or interaction of CO2 and CIA5.
Gene expression patterns were classified into distinct clusters,
many of which could be characterized as responding primarily to
CIA5 or CO2 based on the C/S impact test and visual inspection
of the expression patterns. Regulation by CIA5 independent of
CO2 demonstrates that low-CO2 activation of CIA5 is not es-
sential for its function. Three distinct gene expression clusters
with response to both CIA5 and CO2 were clearly associated
with CCM-related genes and may prove to represent a rich source
of candidates for new CCM components, especially cluster 15,
1888 The Plant Cell
14. which may contain a significant number of putative CCM-related
transporter genes. These expression pattern clusters should
also represent a more robust source of insight than the LCI gene
approach with regard to the role of CIA5 and CO2 regulation
on limiting CO2 acclimation responses in general and on the
function of the CCM specifically. An example of this is the in-
dication, based on expression patterns observed with Calvin
cycle genes and photorespiratory genes, that CIA5 may act as
an upstream activator of photorespiratory genes and a mild
upstream repressor of Calvin cycle genes. Thus, this study of
transcriptome-wide patterns of gene expression related to CO2
and CIA5 provides insight into the massive impact of these two
factors and their interaction on gene expression in C. reinhardtii,
in addition to identifying compelling new candidates for func-
tional CCM components and highlighting new questions to be
addressed in subsequent work.
METHODS
Chlamydomonas reinhardtii Strains and Culture Conditions
C. reinhardtii wild-type strain cc125 was obtained from the Chlamydo-
monas Resource Center (University of Minnesota, Minneapolis, MN). The
cia5 mutant (strain cc2702) was a gift from Donald P. Weeks (University of
Nebraska, Lincoln, NE). Media and growth conditions for C. reinhardtii
were described previously (Wang and Spalding, 2006). All strains were
maintained on CO2 minimal plates in high CO2 (air enriched with 5% CO2)
chambers at room temperature, under continuous illumination (50 mmol
photons m22 s21). Liquid cultures were grown on a gyratory shaker (speed
200 rpm) under white light (;100 mmol photons m22 s21) at room
temperature.
Induction and RNA Isolation
Liquid cultures of all strains were grown under H-CO2 (5% [v/v] CO2) to
a concentration of 1.0 to 2.0 million cells per mL. Cell cultures were then
equally distributed into nine flasks, with three flasks each aerated with
H-CO2 (5%), L-CO2 (nominally 300 to ;500 ppm; actually 330 to 410 ppm),
or VL-CO2 (nominally 100 to ;200 ppm; actually 110 to 152 ppm). Selection
of gas flow lines and position on the shaker were completely random. After
4 h induction, cultures aerated with the same CO2 concentrations were
combined and centrifuged to collect cells. Two biological replicates of each
strain and of each induction condition were processed for RNA isolation as
previously described (Wang and Spalding, 2006), and crude RNA samples
were cleaned with DNase I and the RNeasy MinElute Cleanup kit (Qiagen).
Sequencing and Alignment
The DNA Facility at Iowa State University processed the cleaned RNA
samples, prepared the libraries, and generated sequences (one sample
per lane on the flow cell) on a Genome Analyzer II system (Illumina). No
less than 12 million reads were obtained for each sample (details can be
found in Supplemental Table 1 online). Raw and processed sequence files
are available at the National Center for Biotechnology Information Gene
Expression Omnibus (accession number GSE33927).
Raw reads were aligned to the version 4.0 assembly of the C. reinhardtii
genome (http://genome.jgi-psf.org/chlamy/chlamy.info.html) using gmap
(Wu and Watanabe, 2005), which tries to align every single read to the
genome as an mRNA (possibly spliced) read without previous knowledge
of the genome annotation or sequencing coverage. Alignment files were
processed to retrieve unique alignments with an alignment score higher
than r-15, where r is the read length. This choice allows us to (1) keep two-
block alignments (reads that span two different exons) where only one
block is reported by gmap (that typically fails to provide alignment blocks
smaller than 16 because of its indexing strategy) and (2) keep align-
ments for trimmed reads with sequencing errors at the 39 end. Only high-
similarity (less than three mismatches) and intron-like alignments (defined
here as those with up to one gap smaller than 5 kb) were used for ex-
pression estimation.
Counts per gene were estimated by requiring complete overlap be-
tween each alignment and the transcript genomic coordinates and after
normalization of transcript sequence coverage by read length for each
sample. This strategy attempts to remove the impact that different read
lengths could have on the final results, but almost identical results were
found with alternative methods (see the end of Methods). Augustus 5.0
gene models (http://augustus.gobics.de/predictions/chlamydomonas/)
were used as the reference annotation in this work. The original annotation
was filtered to keep only the first prediction for each locus (“_t1” tran-
scripts). Total number of sequences, percentage of uniquely aligned
reads, and total gene counts per sample are provided in Supplemental
Table 1 online. Gene counts were used for differential expression analysis.
Expression estimates for each sample are provided in units of RPKM (reads
per kilobase of exon model per million of aligned reads; Mortazavi et al., 2008).
Normalization and Statistical Analysis
The primary statistical analysis was performed in the R statistical pro-
gramming language (version 2.10.1 from http://www.r-project.org/). A
generalized linear model with negative binomial distribution and logarithm
link function was fitted to the counts of reads separately for each gene,
while the sequencing depths were used as the offsets for normalization
purpose. Fixed factors in the model included CO2 condition, strain, and
their interaction. An overall test was conducted to identify genes with
differential expression in any of the six treatment groups. This test was
performed by comparing the full model with six separate means and
a reduced model with the same mean for all six groups using quasi-
likelihood-based approach. The set of P values from the overall test for
each gene was adjusted for FDR control as described by Benjamini and
Hochberg (1995). For each of the genes identified as DE by the overall test
while FDR was controlled at 2.5%, we further tested (C/S impact test) for
CO2 effect (C-effect), strain effect (S-effect), and CO2 and strain in-
teraction effect (CS-effect). These C/S impact tests were conducted by
comparing the full model with the appropriate reduced models using
quasi-likelihood-based F-test with the R function “drop1.” FDR was con-
trolled for each set of P values using Benjamini and Hochberg’s method.
The DE genes identified by the overall test were clustered by a model-
based clustering method implemented in an R package, MBCluster.Seq
(Y. Si, P. Liu, P. Li, and T.P. Brutnell, unpublished, http://www.stat.iastate.
edu/preprint/articles/2011-11.pdf), assuming the observed counts fol-
lowing negative binomial distributions. Results were evaluated for var-
iations in the number of clusters from 10 to 30. To maintain the clusters as
few and tight as possible while including most of the patterns, 16 was
chosen to be the total number of clusters for further analysis by visual
inspection of the clustering results.
Pairwise comparisons between VL-CO2 and L-CO2 states, VL-CO2 and
H-CO2 states, or L-CO2 and H-CO2 states were performed using the
Bioconductor package DESeq (Anders and Huber, 2010), which performs
variance stabilization by borrowing information across genes (Anders and
Huber, 2010). The set of P values for each test was adjusted for FDR
control as described by Benjamini and Hochberg (1995).
Quantitative Real-Time PCR Analysis
SYBR green one-step quantitative PCR system was used for qPCR
analysis (Quanta Biosciences). All experiments were performed on a Bio-
Transcriptome Profile for C. reinhardtii CCM 1889
15. Rad iCycler iQ real-time PCR detection system using primers described in
Supplemental Table 2 online. The RNA samples used as templates for
qPCR were the same as those used for RNA-Seq. The CBLP gene was
used as internal control for normalization of qPCR data. Pearson cor-
relations were calculated for each gene across six strain treatment
conditions between RNA-Seq and qPCR methods, based on average log2
fold change of two biological replicates.
Functional Categorization for DE Genes Using the Pathways Tool
The Algal Functional Annotation Tool (Lopez et al., 2011) was used to in-
vestigate the biological processes associated with each cluster. To address
the limitation of annotations availability for C. reinhardtii, we used the GO
terms based on orthology to Arabidopsis thaliana as the framework for
GO term selection. After inputting the gene list for each cluster separately,
P values were generated for each GO term for each cluster entry. GO terms
lacking any hits were assigned a P value of 1, and other terms not sta-
tistically significant (P > 0.01) for any cluster entry were excluded in gen-
erating the summary heat map (see Supplemental Figure 7 online).
Manual Curation for DE Genes
The principles we followed when manually curating these genes were as
follows: (1) manual annotation was used if available; (2) if there was no
manual annotation, the automated annotation domain information based
on the Augustus 5.0 gene model was used to guide curation of the gene;
(3) if there was no manual annotation and no identified domains from the
automated annotation, the gene was marked as “unknown,” or as “un-
known transmembrane,” if one or more transmembrane regions were
predicted; (4) any domain information provided by automated annotation
of the gene models was used to place the genes into broad functional
categories. The categories used included general biological pathways
and general protein functions, such as “metabolism” or “signaling.” From
this process, we placed all genes into eight general categories reflective of
putative function: (1) signaling (including protein kinases, cyclic nucleotide
synthesis, and metabolism, etc.); (2) gene expression and regulation
(including transcription, translation, RNA processing, chromatin structure,
and dynamics, etc.); (3) transport (including Ci transport, ion transport, and
metabolite transport, etc.); (4) metabolism (including amino acid, photo-
synthesis, photorespiration, carbohydrate, acetate, lipid, and macronutrients,
etc.); (5) stress and cell death (including oxidative stress, autophagy, and
programmed cell death, etc.); (6) cell structure and function (including cell
wall, cytoskeleton, vesicular trafficking, protein trafficking, cell division, and
cell motility, etc.); (7) protein modification and regulation (including proteases
and protein modifications other than kinases, etc.); and (8) unknown.
An Alternative RNA-Seq Data Evaluation for Reproducibility
and Comparative Analysis
Here, we provide additional data regarding the quality and reproducibility
of our RNA-Seq libraries, along with a comparative analysis with the
results from our companion article (Brueggeman et al., 2012). To this end,
we used a different, simplified pipeline for all data to highlight the bi-
ological differences and remove any potential differences due to the
computational methods. Specifically, we performed the steps below.
To remove any dependency with the various parameters involved in
gapped-alignment algorithms, we first obtained nongapped alignments to
Augustus 5 transcript sequences using bowtie. The potential issues
introduced by this approach (slightly worse alignment rates and missing
annotations in the genome with sequence similarity to the annotated
genome) are not expected to make a difference in the expression and
differential expression results for most genes.
Trimming sequences: To remove the impact that different read length and
error rates could have in comparing different RNA-Seq libraries, the results
below correspond to trimmed libraries (60 bp) showing very similar error rate
profiles (around 1% at the 39 end; data not shown). The rate of unique
alignment to Augustus 5 transcripts is in the range of 70 to 80% for all
libraries (see Supplemental Table 1 online).
Unique hits from bowtie were compiled to build the count matrix per gene per
sample, for both our libraries and those from our companion article. The
previous matrix was normalized to compute expression estimates in unit of
RPKMs. This normalization was performed after imputation of missing values
(0s were imputed a value of 1 count to regularize fold changes and differential
expression estimates) and filtering those genes with no counts in any
sequencing lane (absent or nonmappable genes).
Some remarks that can be made from these normalized values follow:
High-expression tails: as normalized RPKM values provide relative expres-
sion measures, one of the main sources of ambiguity when comparing two
different RNA-Seq data sets comes from the distribution of the high-
expression genes. Very small changes in the high-expression tail of the
distribution changes significantly the estimates for moderately and slightly
expressed genes. As an example, we can compute the fraction of the total
RPKMs corresponding to the top 100 highly expressed transcripts. For
those conditions that are similar in both articles, the numbers are as follows:
Fang/Spalding data set high CO2 #1 = 0.4117; Fang/Spalding data set high
CO2 #2 = 0.4650; Fang/Spalding data set very low CO2 #1 = 0.3849; Fang/
Spalding data set very low CO2 #2 = 0.4445; Brueggeman/Ladunga data
set 0 h #1 = 0.4528; Brueggeman/Ladunga data set 0 h #2 = 0.5357;
Brueggeman/Ladunga data set 3 h #1 = 0.6786; and Brueggeman/Ladunga
data set 3 h #2 = 0.7031.
For instance, the last number means that 70% of the RPKMs come
from the top 100 genes in the 3-h sample (second replicate) of the
Brueggeman et al. (2012) data set. This observation, in its turn, will clearly
impact the mean variance distributions so that the number of reported DE
genes is potentially different. The biological interpretation of this differ-
ence in the expression distributions can be found in both articles and can
be easily understood from the differences in experimental conditions and/
or genetic background.
Reproducibility. A high correlation between fold change estimates from
both RNA-Seq and PCR is shown and discussed in this article for
a number of relevant genes. Regarding the reproducibility of our RNA-Seq
expression estimates for different replicates, Supplemental Figure 3
online shows mean difference scatterplots for replicates of the same
condition in our article. The x axis values are geometric means of the
expression of the two replicates, while the y axis shows the fold change
between replicates. To assist with the visualization of these graphs,
shown are line plots with the 90th percentile (red), mean (green), and 10th
percentile (cyan) of the fold changes. This means that above the red line
fall the 10% higher fold changes between replicates and below the cyan is
the 10% higher negative fold changes between replicates. These plots
show both that the replicates fold change distributions are centered
around 0 as expected (green lines) and that the expression estimates from
both replicates area consistent for a majority of the transcriptome. Very
similar results were found for the experiments from our companion article
(Brueggeman et al., 2012). It is worth mentioning that the highest reproducibility
is observed for the mutant samples, most likely due to a lower sensitivity to
fluctuations in CO2 levels.
Fold change comparative plots: Fold changes between control and
experiment were obtained from the mean expression estimates across
replicates for each condition. We focus here on those comparisons that are
common to both articles (very low/high CO2 for our data set and 0 versus
3 h on the Brueggeman et al. [2012] data set). Supplemental Figure 4 online
compares both fold change estimates. The left panel shows a scatterplot
along with results from a linear fit. The black line is a guide to the eye,
representing an ideal linear relationship (slope = 1, no offset, expected if
both experiments were completely equivalent). A linear fit provides the
results highlighted in red font, with slope 1.13 and offset = 20.56. The
correlation between both fold change distributions is 0.60. Together,
these results indicate that both data sets have the same whole-
transcriptome trends in fold expression. The same data are shown in
the right panel of Supplemental Figure 4 online as a smoothed density
1890 The Plant Cell
16. plot. It is clear that fold changes for a majority of genes are in close
agreement between both data sets, in accordance with the discussion
in the articles regarding the similarity between the reported regulated
genes.
Fold-change comparative plots for different analysis pipelines: Supplemental
Figure 5 online shows scatterplots of log2 fold changes estimated for data in
this article with two different analysis pipelines. The x axis corresponds to the
fold change estimates presented in the main article, while the y axis plots
estimates from the pipeline introduced above. Red lines represent a perfect
linear relationship. The agreement between both estimates is apparent for the
whole fold change dynamic range.
Accession Numbers
All sequence data from this article can be found in the GenBank/EMBL
data libraries under accession numbers listed in Supplemental Data Set 2
online. Accession numbers for specifically discussed genes are as fol-
lows: AAT1, EDP08011; AGT1, EDO97315; AGT2, EDO96807; CAH1,
EDP04241; CAH3, EDP00852; CAH4, EDO96058; CAH5, EDP07024;
CAH6, EDO96552; CAH7, EDO99006; CAH8, EDO99999; CAH9,
EDP07163; CCM1/CIA5, EDP07542; CCP1, EDP04147; CCP2,
EDP04238; DLDH1, EDP01871; DNJ15, EDP03107; DNJ31, EDO98634;
FBA1, EDO98285; FBA3, EDO97897; FBP1, EDP05318; GCSH,
EDP08614; GLYK, EDP03009; GYD1, EDP01639; HLA3, EDP07736;
HPR1, EDP05213; LCI1, EDP06069; LCI6, EDP02960; LCIA/NAR1.2,
EDP04946; LCIB, EDP07837; LCIC, EDP04956; LCID, EDP04142; LCIE,
EDP04243; LCR1, BAD13492; LHCSR2, EDP01013; LHCSR3,
EDP01087; PGK1, EDO98586; PGP1, EDP06184; PGP2, EDP05829;
PGP3, EDP08194; PRK1, EDP02974; RBCS1, EDO96904; RHP1,
EDP01722; RHP2, EDP01723; RPI1, EDP04506; SEBP1, EDP04487;
SGA1, EDO97196; SHMT1, EDO97448; SHMT2, EDO97351; and SHMT3,
EDP00905. C. reinhardtii strains (available from the Chlamydomonas
Stock Center; http://chlamycollection.org/) used in this work are as fol-
lows: the 137c wild type (strain cc125) and the cia5 mutant (strain cc2702).
Supplemental Data
The following materials are available in the online version of this article.
Supplemental Figure 1. Gene Expression Level Distributions for Each
Treatment Condition.
Supplemental Figure 2. Validation of RNA-Seq by qPCR.
Supplemental Figure 3. Mean Difference Scatterplots for Biological
Replicates.
Supplemental Figure 4. Comparison of Log2 Fold Change Estimates
between Different Data Sets.
Supplemental Figure 5. Comparison of Log2 Fold Change Estimates
between Different Analysis Pipelines.
Supplemental Figure 6. Distribution of C/S Impact Test Results by
Cluster.
Supplemental Figure 7. Heat Map for GO Category Hits Based on the
Algal Functional Annotation Tool.
Supplemental Table 1. Alignment Statistics for the Transcriptome
Sequencing Experiment.
Supplemental Table 2. List of qPCR Primers.
Supplemental Data Set 1. Overall and C/S Impact Test.
Supplemental Data Set 2. DESeq Summary.
Supplemental Data Set 3. Gene Ontology Analysis.
Supplemental Data Set 4. Manual Curation of Genes.
Supplemental Data Set 5. Previously Reported LCI Genes.
Supplemental Data Set 6. Genes in CCM clusters 8, 14, and 15.
ACKNOWLEDGMENTS
This work was supported by USDA National Research Initiative Com-
petitive grants (2007-35318-18433), by the National Science Foundation
(MCB-0952323), and by the Department of Energy Advanced Research
Projects Agency-Energy Program (DEAR0000010) to M.H.S., as well as
by the Institute of Genomics and Proteomics (Department of Energy
Cooperative Agreement DE-FC02-02ER63421 to David Eisenberg) and
the National Institutes of Health (R24GM092473) to S.S.M. and M.H.P.
AUTHOR CONTRIBUTIONS
W.F., P.L., and M.H.S. designed the research. W.F. performed the
research. Y.S. and P.L. contributed new analytical tools. All authors
analyzed data, and all authors contributed to the writing of the article.
Received March 12, 2012; revised March 12, 2012; accepted May 14,
2012; published May 25, 2012.
REFERENCES
Anders, S., and Huber, W. (2010). Differential expression analysis for
sequence count data. Genome Biol. 11: R106.
Andersson, I. (2008). Catalysis and regulation in Rubisco. J. Exp. Bot.
59: 1555–1568.
Benjamini, Y., and Hochberg, Y. (1995). Controlling the false dis-
covery rate: A practical and powerful approach to multiple testing.
J. R. Stat. Soc. B 57: 289–300.
Brueggeman, A.J., Gangadharaiah, D.S., Cserhati, M.F., Casero,
D., Weeks, D.P., and Ladunga, I. (2012). Activation of the carbon-
concentrating mechanism by CO2 deprivation coincides with mas-
sive transcriptional and metabolic restructuring in Chlamydomonas
reinhardtii. Plant Cell 24: 1860–1875.
Castruita, M., Casero, D., Karpowicz, S.J., Kropat, J., Vieler, A.,
Hsieh, S.I., Yan, W., Cokus, S., Loo, J.A., Benning, C., Pellegrini,
M., and Merchant, S.S. (2011). Systems biology approach in
Chlamydomonas reveals connections between copper nutrition and
multiple metabolic steps. Plant Cell 23: 1273–1292.
Chen, Z.-Y., Burow, M.D., Mason, C.B., and Moroney, J.V. (1996). A low-
CO2-inducible gene encoding an alanine: alpha-ketoglutarate amino-
transferase in Chlamydomonas reinhardtii. Plant Physiol. 112: 677–684.
Chen, Z.Y., Lavigne, L.L., Mason, C.B., and Moroney, J.V. (1997).
Cloning and overexpression of two cDNAs encoding the low-CO2-
inducible chloroplast envelope protein LIP-36 from Chlamydomo-
nas reinhardtii. Plant Physiol. 114: 265–273.
Coleman, J.R., and Grossman, A.R. (1984). Biosynthesis of carbonic
anhydrase in Chlamydomonas reinhardtii during adaptation to low
CO(2). Proc. Natl. Acad. Sci. USA 81: 6049–6053.
Dillard, S.R., Van, K., and Spalding, M.H. (2011). Acclimation to low or
limiting CO2 in non-synchronous Chlamydomonas causes a transient
synchronization of the cell division cycle. Photosynth. Res. 109: 161–168.
Duanmu, D., Miller, A.R., Horken, K.M., Weeks, D.P., and
Spalding, M.H. (2009a). Knockdown of limiting-CO2-induced
gene HLA3 decreases HCO3
- transport and photosynthetic Ci
affinity in Chlamydomonas reinhardtii. Proc. Natl. Acad. Sci. USA
106: 5990–5995.
Transcriptome Profile for C. reinhardtii CCM 1891
17. Duanmu, D., Wang, Y., and Spalding, M.H. (2009b). Thylakoid lumen
carbonic anhydrase (CAH3) mutation suppresses air-Dier pheno-
type of LCIB mutant in Chlamydomonas reinhardtii. Plant Physiol.
149: 929–937.
Fukuzawa, H., Miura, K., Ishizaki, K., Kucho, K.I., Saito, T.,
Kohinata, T., and Ohyama, K. (2001). Ccm1, a regulatory gene
controlling the induction of a carbon-concentrating mechanism in
Chlamydomonas reinhardtii by sensing CO2 availability. Proc. Natl.
Acad. Sci. USA 98: 5347–5352.
Galván, A., Rexach, J., Mariscal, V., and Fernández, E. (2002). Ni-
trite transport to the chloroplast in Chlamydomonas reinhardtii:
Molecular evidence for a regulated process. J. Exp. Bot. 53:
845–853.
González-Ballester, D., Casero, D., Cokus, S., Pellegrini, M.,
Merchant, S.S., and Grossman, A.R. (2010). RNA-seq analysis of
sulfur-deprived Chlamydomonas cells reveals aspects of acclima-
tion critical for cell survival. Plant Cell 22: 2058–2084.
Kvam, V.M., Liu, P., and Si, Y. (2012). A comparison of statistical
methods for detecting differentially expressed genes from RNA-seq
data. Am. J. Bot. 99: 248–256.
Lopez, D., Casero, D., Cokus, S.J., Merchant, S.S., and Pellegrini,
M. (2011). Algal Functional Annotation Tool: A web-based analysis
suite to functionally interpret large gene lists using integrated an-
notation and expression data. BMC Bioinformatics 12: 282.
Marek, L.F., and Spalding, M.H. (1991). Changes in photorespiratory
enzyme activity in response to limiting CO2 in Chlamydomonas
reinhardtii. Plant Physiol. 97: 420–425.
Mariscal, V., Moulin, P., Orsel, M., Miller, A.J., Fernández, E., and
Galván, A. (2006). Differential regulation of the Chlamydomonas
Nar1 gene family by carbon and nitrogen. Protist 157: 421–433.
Mitra, M., Lato, S.M., Ynalvez, R.A., Xiao, Y., and Moroney, J.V.
(2004). Identification of a new chloroplast carbonic anhydrase in
Chlamydomonas reinhardtii. Plant Physiol. 135: 173–182.
Miura, K., Yamano, T., Yoshioka, S., Kohinata, T., Inoue, Y.,
Taniguchi, F., Asamizu, E., Nakamura, Y., Tabata, S., Yamato,
K.T., Ohyama, K., and Fukuzawa, H. (2004). Expression profiling-
based identification of CO2-responsive genes regulated by CCM1
controlling a carbon-concentrating mechanism in Chlamydomonas
reinhardtii. Plant Physiol. 135: 1595–1607.
Moroney, J.V., Husic, H.D., Tolbert, N.E., Kitayama, M., Manuel,
L.J., and Togasaki, R.K. (1989). Isolation and characterization of
a mutant of Chlamydomonas reinhardtii deficient in the CO2 con-
centrating mechanism. Plant Physiol. 89: 897–903.
Moroney, J.V., Ma, Y., Frey, W.D., Fusilier, K.A., Pham, T.T.,
Simms, T.A., DiMario, R.J., Yang, J., and Mukherjee, B. (2011).
The carbonic anhydrase isoforms of Chlamydomonas reinhardtii:
Intracellular location, expression, and physiological roles. Photo-
synth. Res. 109: 133–149.
Moroney, J.V., and Ynalvez, R.A. (2007). Proposed carbon dioxide
concentrating mechanism in Chlamydomonas reinhardtii. Eukaryot.
Cell 6: 1251–1259.
Mortazavi, A., Williams, B.A., McCue, K., Schaeffer, L., and Wold,
B. (2008). Mapping and quantifying mammalian transcriptomes by
RNA-Seq. Nat. Methods 5: 621–628.
Ohnishi, N., Mukherjee, B., Tsujikawa, T., Yanase, M., Nakano, H.,
Moroney, J.V., and Fukuzawa, H. (2010). Expression of a low CO2-
inducible protein, LCI1, increases inorganic carbon uptake in the
green alga Chlamydomonas reinhardtii. Plant Cell 22: 3105–3117.
Pollock, S.V., Prout, D.L., Godfrey, A.C., Lemaire, S.D., and
Moroney, J.V. (2004). The Chlamydomonas reinhardtii proteins
Ccp1 and Ccp2 are required for long-term growth, but are not
necessary for efficient photosynthesis, in a low-CO2 environment.
Plant Mol. Biol. 56: 125–132.
Ramazanov, Z., Mason, C.B., Geraghty, A.M., Spalding, M.H., and
Moroney, J.V. (1993). The low CO2-inducible 36-kilodalton protein
is localized to the chloroplast envelope of Chlamydomonas rein-
hardtii. Plant Physiol. 101: 1195–1199.
Raven, J.A., Cockell, C.S., and De La Rocha, C.L. (2008). The
evolution of inorganic carbon concentrating mechanisms in pho-
tosynthesis. Philos. Trans. R. Soc. Lond. B Biol. Sci. 363: 2641–
2650.
Somanchi, A., and Moroney, J.V. (1999). As Chlamydomonas rein-
hardtii acclimates to low-CO2 conditions there is an increase in
cyclophilin expression. Plant Mol. Biol. 40: 1055–1062.
Soupene, E., Inwood, W., and Kustu, S. (2004). Lack of the Rhesus
protein Rh1 impairs growth of the green alga Chlamydomonas
reinhardtii at high CO2. Proc. Natl. Acad. Sci. USA 101: 7787–
7792.
Soupene, E., King, N., Feild, E., Liu, P., Niyogi, K.K., Huang, C.H.,
and Kustu, S. (2002). Rhesus expression in a green alga is regu-
lated by CO(2). Proc. Natl. Acad. Sci. USA 99: 7769–7773.
Spalding, M.H. (2008). Microalgal carbon-dioxide-concentrating
mechanisms: Chlamydomonas inorganic carbon transporters. J.
Exp. Bot. 59: 1463–1473.
Spalding, M.H. (2009). CO2-concentrating mechanism and carbon
assimilation. In The Chlamydomonas Sourcebook: Organellar and
Metabolic Processes, 2nd ed, Vol. 2, D. Stern and E Harris, eds
(Amsterdam: Elsevier Publishers), pp. 257–301.
Spalding, M.H., and Jeffrey, M. (1989). Membrane-associated poly-
peptides induced in Chlamydomonas by limiting CO2 concen-
trations. Plant Physiol. 89: 133–137.
Spalding, M.H., Spreitzer, R.J., and Ogren, W.L. (1983a). Carbonic
anhydrase-deficient mutant of Chlamydomonas reinhardii requires
elevated carbon dioxide concentration for photoautotrophic growth.
Plant Physiol. 73: 268–272.
Spalding, M.H., Spreitzer, R.J., and Ogren, W.L. (1983b). Reduced
inorganic carbon transport in a CO2-requiring mutant of Chlamy-
domonas reinhardii. Plant Physiol. 73: 273–276.
Spalding, M.H., Van, K., Wang, Y., and Nakamura, Y. (2002). Ac-
climation of Chlamydomonas to changing carbon availability. Funct.
Plant Biol. 29: 221–230.
Tural, B., and Moroney, J.V. (2005). Regulation of the expression of
photorespiratory genes in Chlamydomonas reinhardtii. Can. J. Bot.
83: 810–819.
Wang, L., Li, P., and Brutnell, T.P. (2010). Exploring plant tran-
scriptomes using ultra high-throughput sequencing. Brief Funct
Genomics 9: 118–128.
Wang, Y., Duanmu, D., and Spalding, M.H. (2011). Carbon dioxide
concentrating mechanism in Chlamydomonas reinhardtii: Inorganic
carbon transport and CO2 recapture. Photosynth. Res. 109: 115–122.
Wang, Y., and Spalding, M.H. (2006). An inorganic carbon transport
system responsible for acclimation specific to air levels of CO2 in
Chlamydomonas reinhardtii. Proc. Natl. Acad. Sci. USA 103: 10110–
10115.
Wang, Y., Sun, Z., Horken, K.M., Im, C.S., Xiang, Y., Grossman,
A.R., and Weeks, D.P. (2005). Analyses of CIA5, the master reg-
ulator of the carbon-concentrating mechanism in Chlamydomonas
reinhardtii, and its control of gene expression. Can. J. Bot. 83:
765–779.
Wu, T.D., and Watanabe, C.K. (2005). GMAP: A genomic mapping
and alignment program for mRNA and EST sequences. Bio-
informatics 21: 1859–1875.
Xiang, Y., Zhang, J., and Weeks, D.P. (2001). The Cia5 gene controls
formation of the carbon concentrating mechanism in Chlamydo-
monas reinhardtii. Proc. Natl. Acad. Sci. USA 98: 5341–5346.
1892 The Plant Cell
18. Yamano, T., and Fukuzawa, H. (2009). Carbon-concentrating
mechanism in a green alga, Chlamydomonas reinhardtii, revealed by
transcriptome analyses. J. Basic Microbiol. 49: 42–51.
Yamano, T., Tsujikawa, T., Hatano, K., Ozawa, S.I., Takahashi, Y.,
and Fukuzawa, H. (2010). Light and low-CO2-dependent LCIB-
LCIC complex localization in the chloroplast supports the carbon-
concentrating mechanism in Chlamydomonas reinhardtii. Plant Cell
Physiol. 51: 1453–1468.
Yoshihara, C., Inoue, K., Schichnes, D., Ruzin, S., Inwood, W., and
Kustu, S. (2008). An Rh1-GFP fusion protein is in the cytoplasmic
membrane of a white mutant strain of Chlamydomonas reinhardtii.
Mol. Plant 1: 1007–1020.
Yoshioka, S., Taniguchi, F., Miura, K., Inoue, T., Yamano, T., and
Fukuzawa, H. (2004). The novel Myb transcription factor LCR1 regulates
the CO2-responsive gene Cah1, encoding a periplasmic carbonic anhy-
drase in Chlamydomonas reinhardtii. Plant Cell 16: 1466–1477.
Transcriptome Profile for C. reinhardtii CCM 1893
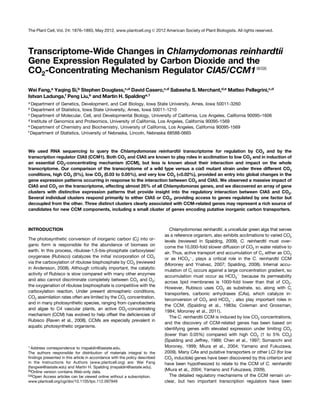
![identified and characterized based on their relationship to the
CCM. A zinc-finger type transcription regulator, CIA5 (or CCM1),
was identified by complementation of the cia5 mutant (Moroney
et al., 1989), which is unable to acclimate to limiting CO2 con-
ditions, and, independently, by cloning of a tagged allele of cia5,
ccm1 (Fukuzawa et al., 2001; Xiang et al., 2001). Expression of
most putative Ci transporters and induced CAs requires CIA5,
even though the expression of CIA5 itself does not depend
on the CO2 level, so posttranslational activation of CIA5 in low
CO2 apparently is required for CIA5 to regulate these genes
(Fukuzawa et al., 2001; Xiang et al., 2001; Miura et al., 2004).
Another transcription regulator, low-CO2 response regulator1
(LCR1), has a Myb domain and appears to regulate the ex-
pression of at least three limiting CO2 induced genes, carbonic
anhydrase1 (CAH1), low-CO2-induced gene1 (LCI1), and LCI6.
LCR1 itself also is induced by limiting CO2, and this induction
requires Ci accumulation5 (CIA5) (Yoshioka et al., 2004). Be-
cause of the extensive connection of CIA5 to regulation of the
CCM-related genes, including LCR1, CIA5 is often called the
master regulator of the CCM.
Regarding the mechanism of Ci transport and accumulation in
the CCM, the first barrier to Ci uptake is the plasma membrane.
Two CIA5-regulated genes encoding candidate transporters
have been implicated in Ci transport across the plasma mem-
brane: high light–induced gene3 (HLA3) encodes a putative ATP
binding cassette type transporter and is induced under low CO2
conditions, and knockdown of its expression impairs photo-
synthesis, Ci uptake, and growth in alkaline conditions (Duanmu
et al., 2009a). LCI1 encodes a plasma membrane protein re-
ported to increase Ci uptake in LCR1 mutants when expressed
transgenically (Ohnishi et al., 2010). Two Rhesus-like proteins,
RHP1 and RHP2, also are predicted to be plasma membrane
located (Yoshihara et al., 2008). The RHP1 protein has been
proposed as a CO2 channel to facilitate CO2 influx under high
CO2 conditions (Soupene et al., 2002, 2004), and its expression
is reportedly upregulated in high CO2.
Some chloroplast envelope proteins also are candidates to
transport Ci into the stroma. The low CO2–induced gene A (LCIA
[NAR1.2]) gene, which encodes a Formate/Nitrite Transporter
family protein targeted to the chloroplast envelope, is induced in
low CO2 and requires CIA5 for expression (Galván et al., 2002;
Miura et al., 2004). LCIA has been reported to increase HCO3
2
transport when transfected into Xenopus laevis oocytes
(Mariscal et al., 2006), and its product has been implicated in Ci
transport in HLA3-LCIA coknockdown C. reinhardtii strains
(Duanmu et al., 2009a). RNA interference knockdown of chloro-
plast carrier protein1 (CCP1) and CCP2, which encode nearly
identical, LCI chloroplast envelope proteins (Spalding and
Jeffrey, 1989; Ramazanov et al., 1993; Chen et al., 1997) re-
sulted in poor growth under low CO2 conditions, although no
direct evidence for a defect in Ci transport or photosynthesis
was demonstrated (Pollock et al., 2004).
The combined transport of HCO3
2 across the plasma mem-
brane and the chloroplast envelope results in the accumulation
of HCO3
2 in the chloroplast stroma. Since Rubisco, located in
the pyrenoid, cannot use HCO3
2, a specific CA, carbonic an-
hydrase3 (CAH3), dehydrates the accumulated HCO3
2 to CO2 in
the thylakoid lumen, taking advantage of the acidic lumen
environment to drive nearly complete conversion of HCO3
2 to
CO2 (Spalding, 2008; Moroney et al., 2011). This essential role of
CAH3 also mandates the transport or facilitated diffusion of
HCO3
2 across the thylakoid membrane, but this has not yet
been demonstrated.
Another set of low CO2–induced genes, low CO2–induced
gene B (LCIB) and three related genes, LCIC, LCID, and LCIE,
also have been implicated in Ci transport and accumulation even
though they are predicted to be soluble chloroplast proteins
(Wang and Spalding, 2006; Moroney and Ynalvez, 2007;
Spalding, 2008). LCIB mutants fail to accumulate internal Ci in
low CO2 conditions and are thus unable to grow in air levels of
CO2 (Spalding et al., 1983b; Wang and Spalding, 2006). Notably,
LCIB mutants have revealed the existence of a third acclimation
state at very low CO2 concentrations (<0.02%): Both LCIB allelic
mutants pmp1 and ad1 die under low CO2 conditions (<0.05 and
>0.02%) but are able to grow slowly under very low CO2
(<0.02%) conditions (Wang and Spalding, 2006).
Because transmembrane domains are not evident, these LCIB
family proteins cannot be stand-alone Ci transporters. It has
been suggested that they might serve as Ci transport regulators
or as Ci transport complex subunits (Wang and Spalding, 2006),
but LCIB either distributes through the stroma or concentrates
around the pyrenoid (Duanmu et al., 2009b; Yamano et al.,
2010), making interaction with Ci transporters unlikely. Mutants
defective in the thylakoid lumen CA, CAH3, suppress the LCIB
mutation phenotype (Duanmu et al., 2009b), suggesting a role
for LCIB and LCIC, with which LCIB forms a heteromeric com-
plex (Yamano et al., 2010), in preventing the leakage of CO2 from
the stroma. CAH6, a putative chloroplast stromal CA, also may
be involved in CO2-to-HCO3
2 conversion in the stroma to re-
duce diffusive loss of CO2 from the chloroplast (Mitra et al.,
2004).
Even though the C. reinhardtii CCM has been extensively
studied in recent years, we still know little about the limiting CO2
acclimation process, and the potential for discovery of new
genes involved in this process is very high. The acclimation to
limiting CO2 and induction of the CCM in C. reinhardtii appear to
be regulated by the master regulator, CIA5 (or CCM1) (Miura
et al., 2004). The cia5 mutant appears to completely lack in-
duction of the CCM, although it is viable under high CO2 con-
ditions and grows more slowly than the wild type in air levels of
CO2. Also, most identified LCI genes remain uninduced when
cia5 is exposed to low CO2 (Moroney et al., 1989; Spalding et al.,
2002). Aside from being a critical upstream regulator of the CCM
and other low CO2 acclimation responses and likely requiring
posttranslational activation in low CO2, the details of CIA5
function remain undiscovered. CIA5 has been proposed to be
a transcription regulator (Fukuzawa et al., 2001; Xiang et al.,
2001), but we know very little about sequences recognized by its
putative DNA binding domain or the genes it directly regulates
downstream.
To better understand the CCM and low CO2 acclimation of C.
reinhardtii in general, as well as the function of CIA5, we con-
ducted RNA sequencing (RNA-Seq) experiments employing the
Illumina Genome Analyzer II because of its superiority over the
traditional microarray methods (González-Ballester et al., 2010;
Wang et al., 2010; Castruita et al., 2011) using two C. reinhardtii
Transcriptome Profile for C. reinhardtii CCM 1877](data:image/gif;base64,R0lGODlhAQABAIAAAAAAAP///yH5BAEAAAAALAAAAAABAAEAAAIBRAA7)