Download to read offline

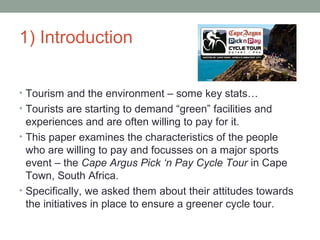
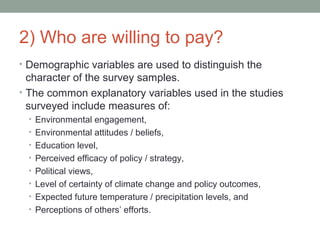
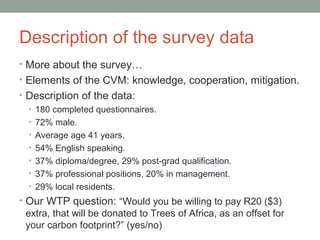
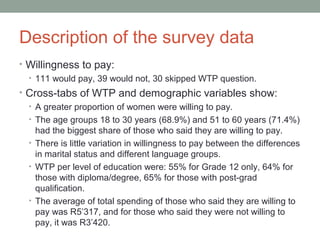
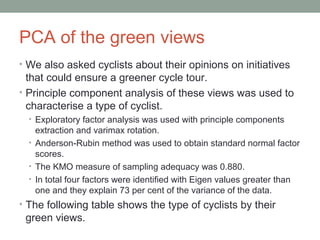
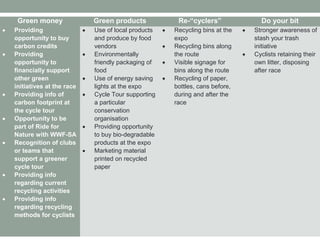
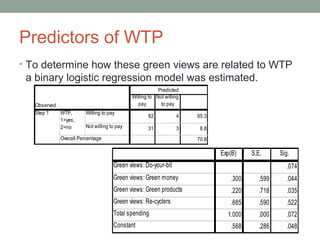
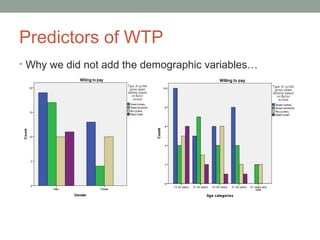

The document discusses a study examining willingness to pay for green initiatives at the Cape Argus Pick 'n Pay cycle tour in South Africa. The study surveyed 180 participants about their views on green initiatives at the event and whether they would be willing to pay an extra fee. Factor analysis identified four types of cyclists based on their green views: "Green money", "Green products", "Re-cyclers", and "Do your bit". Logistic regression found that having green views, specifically "Do your bit" and "Green money" views, positively predicted willingness to pay. The document recommends that event organizers identify green-minded consumers and target initiatives toward them, and that further research examine additional factors influencing willingness to pay.


