1. Information Products for Nile Basin Water Resources Management GCP/INT/945/ITA
c/o FAO Representative Office in Uganda P. O.Box 521, Kampala, UGANDA Phone: (256) 414 321391 info@ faonile.org
www.faonile.orgThe project is intended to strengthen the ability of the governments of the Nile Riparian States
to take informed decisions on water resources policy and management matters regarding
the common Nile resource. It includes a major capacity building component. The project
is implemented under the umbrella of the Nile Basin Initiative.
ugandarwandakenya sudan tanzaniaburundi eritrea ethiopiad.r.congo egypt
A project sponsored by the Government of Italy
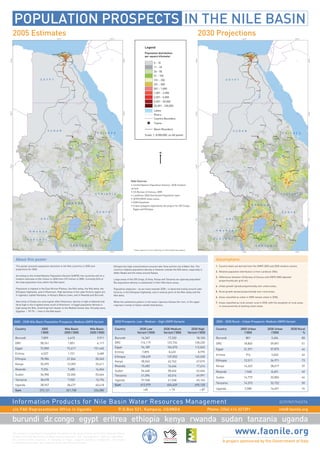
POPULATION PROSPECTS IN THE NILE BASIN
2005 Estimates 2030 Projections
0 - 10
11 - 25
26 - 50
51 - 100
101 - 250
251 - 500
501 - 1,000
1,001 - 2,500
2,501 - 5,000
5,001 - 50,000
50,001 - 100,000
Lakes
Rivers
Country Boundary
Towns
Basin Boundary
Scale; 1: 8,000,000, on A0 poster
N
Population distribution
per square kilometer
Legend
Burundi
DRC
Egypt
Eritrea
Ethiopia
Kenya
Rwanda
Sudan
Tanzania
Uganda
Sum
2005 - 2030 Nile Basin Population Prospects: Medium UNPD Variant
Country 2005
(’000)
Nile Basin
2005 (’000)
Nile Basin
2030 (’000)
7,859
58,741
72,850
4,527
78,986
35,599
9,234
36,900
38,478
28,947
372,121
4,615
1,851
72,617
1,721
31,044
13,359
7,685
32,406
7,933
28,477
201,708
9,911
4,117
101,465
3,489
50,345
25,411
14,066
53,664
13,194
60,418
336,080
Burundi
DRC
Egypt
Eritrea
Ethiopia
Kenya
Rwanda
Sudan
Tanzania
Uganda
Sum
2030 Prospects: Low - Medium - High UNPD Variants
Country 2030 Low
Variant (’000)
2030 Medium
Variant (’000)
2030 High
Variant (’000)
16,367
116,119
96,189
7,895
128,639
58,563
15,683
54,460
61,096
57,968
612,979
+65
17,232
122,734
104,070
8,433
137,052
62,762
16,646
58,446
65,516
61,548
654,439
+ 76
18,103
128,220
112,045
8,975
145,530
67,015
17,614
62,464
69,991
65,163
695,120
+ 87
Burundi
DRC
Egypt
Eritrea
Ethiopia
Kenya
Rwanda
Sudan
Tanzania
Uganda
2005 - 2030 Rural - Urban Prospects: Medium UNPD Variant
Country 2005 Urban
(’000)
2030 Urban
(’000)
2030 Rural
%
801
18,845
31,291
916
12,511
14,263
1,968
14,775
14,373
3,580
3,604
59,891
57,875
3,040
36,971
38,017
8,401
32,806
32,722
14,691
80
51
44
64
73
39
49
44
50
74
This poster presents population densities in the Nile countries in 2005 and
projections for 2030.
According to the United Nations Population Division (UNPD), the countries will hit a
medium estimate of 654 million in 2030 from 372 million in 2005. Currently 54% of
the total population lives within the Nile basin.
Population is highest in the East African Plateau, the Nile valley, the Nile delta, the
Ethiopian highlands, and in Khartoum. High densities in the Lake Victoria region are
in Uganda’s capital Kampala, in Kenya’s Nakuru town, and in Rwanda and Burundi.
Vast areas of Sudan are unoccupied. After Khartoum, density is high at Atbarah and
fairly high in the irrigated areas south of Khartoum. In Egypt population density is
high along the Nile, stretching from Aswan to the Mediterranean Sea. Virtually every
Egyptian -- 99.7% -- lives in the Nile basin.
Ethiopia has high concentrations around Lake Tana and the city of Bahir Dar. The
country’s highest population density is however outside the Nile basin, especially in
Addis Ababa and the areas around Awasa.
Large areas of the DR Congo, Eritrea, Kenya and Tanzania are sparsely populated.
But population density is substantial in their Nile basin areas.
Population explosion – as we move towards 2030 – is observed mainly around Lake
Victoria, in the Ethiopian Highlands, and in several parts of the Nile valley and the
Nile delta.
While the settlement pattern in the lower riparians follows the river, in the upper
riaprians it tends to follow rainfall distribution.
About this poster
1.
2.
3.
4.
5.
6.
7.
Assumptions
Country totals are derived from the UNPD 2005 and 2030 medium variant;
Relative population distribution is from Landscan 2004;
Differences between US Bureau of Census and UNPD 2005 adjusted
proportionally per grid cell;
Urban growth spread proportionally over urban areas;
Rural growth spread proportionally over rural areas;
Areas classified as urban in 2005 remain urban in 2030;
Areas classified as rural remain rural in 2030, with the exception of rural areas
in close proximity of existing urban areas.
• United Nations Population Division, 2030 medium
variant
• US Bureau of Census, 2005
• LandScan 2004 Distributed Population layer
• AFRICOVER urban areas
• ESRI Gazetteer
• Urban polygons digitized by the project for DR Congo,
Egypt and Ethiopia
Data Sources
These maps are not an authority on international boundaries
P
P
P
P
P
P
P
P
P
P
P
P
P
P
S U D A N
E T H I O P I A
E G Y P T
U G A N D A
K E N Y A
D R C
T A N Z A N I A
E R I T R E A
R W A N D A
B U R U N D I
Nakuru
Nairobi
Mombasa
JinjaKampala
Goma
Kananga
Juba
Uwayl
Torit
Nyala
Kusti
Kasala
Malakal
`Atbarah
Khartoum
Al Fashir
Wad Madani
Port Sudan
Al Ubayyid
Al Qadarif
Wadi Halfa'
Tant
Aswan
Cairo
Al-Minya
Al-Faiyum
As-Suways
Al-Mansura
Alexandria
Asmera
Tessenei
Jima
Dese
Awasa
Mekele
Gonder
Nazret
Bahir Dar
Addis Ababa
Arusha
Shinyanga
40°0'0"E
40°0'0"E
30°0'0"E
30°0'0"E
30°0'0"N
30°0'0"N
20°0'0"N
20°0'0"N
10°0'0"N
10°0'0"N
0°0'0"
0°0'0"
P
P
P
P
P
P
P
P
P
P
B U R U N D I
R W A N D A
S U D A N
E T H I O P I A
E G Y P T
U G A N D A
K E N Y A
D R C
T A N Z A N I A
E R I T R E A
Bujumbura
Nakuru
Nairobi
Mombasa
JinjaKampala
Goma
Kananga
Juba
Uwayl
Torit
Nyala
Kusti
Kasala
Malakal
`Atbarah
Khartoum
Al Fashir
Wad Madani
Port Sudan
Al Ubayyid
Al Qadarif
Wadi Halfa'
Asmera
Tessenei
Arusha
Shinyanga
Jima
Dese
Awasa
Mekele
Gonder
Nazret
Bahir Dar
Addis Ababa
Tant
Aswan
Cairo
Al-Minya
Al-Faiyum
As-Suways
Al-Mansura
Alexandria
40°0'0"E
40°0'0"E
30°0'0"E
30°0'0"E
30°0'0"N
30°0'0"N
20°0'0"N
20°0'0"N
10°0'0"N
10°0'0"N
0°0'0"
0°0'0"
Bujumbura