SlideShare a Scribd company logo
1 of 38
Download to read offline
Srivatsa
1
Replacing Pressure Reducing Valves with Backpressure Steam Turbine-Generators
in Heat Plant
By Vivek Srivatsa
Current Process
The heat plant currently operates on a modified Rankine cycle (Figure 1). In the plant, the boilers operate
on steam at 180 psig, while the heat exchangers must operate on steam at 25 psig. In between the two,
there are pressure reducing valves (PRVs) that lower the incoming steam pressure from the boiler to the
working pressure of the heat exchangers. This is the pressure reducing station.
Figure 1: The modified Rankine cycle that the heat plant operates on, and the corresponding T-s diagram.
There are three different paths for steam in this cycle. The first is 1-2-3-5-6-hot well-deaerator-1.
Although we say point 1 is the pump inlet, in reality the cycle starts when coal is conveyed to a bunker
with the boilers. An economizer uses the boiler exhaust gases to preheat the cold water used to fill the
boiler up to its boiling point (hence the temperature increase from point 2 to the point on the saturation
dome). Heat is then transferred to the steam inside the boiler (Qin). Following this, the steam passes
through a set of pressure reducing valves. The PRVs act isenthalpically, reducing the steam pressure from
180 psi to 25 psi, and the steam is left slightly superheated. While passing through the heat exchanger,
some energy is required to overcome the superheat, while the remaining heat QL1 is rejected to the
medium temperature hot water that goes out and does useful work heating the academic Grounds. The
liquid then enters a hot well. We will discuss the second path before continuing with the hot well.
The second path that the steam takes is 1-2-3-4-7-hot well-deaerator-1. It differs from the first path
starting at point 3. The steam is sent out to the University and its pressure is reduced through hundreds of
PRVs located on Grounds (and modeled isenthalpically, where the steam exits slightly superheated). The
steam then flows through hundreds of on-Grounds heat exchangers (represented by a single heat
exchanger on the cycle) that operate on steam at atmospheric pressure. The steam goes out to heat the
hospital and Grounds through these heat exchangers (QL2), and comes back to the plant as condensate.
From here, the condensate as well as the liquid from the previous path both enter the hot well, and come
Srivatsa
2
to atmospheric pressure at around saturation (so the hot well is essentially at point 7 as well). We will
discuss the final path before moving on to the deaerator.
The third path for the steam is 1-2-3-5-8-deaerator-1. The difference here is at point 5. After flowing
through the PRVs and being reduced to a pressure of 25 psi, some steam flows through another set of
PRVs that further reduces the pressure to 5 psi. The saturated steam at point 8 then flows to an open
feedwater heater (a deaerator) where it mixes with the condensate from the hot well. Here, saturated
liquid is formed, and we have our outlet at point 1. Then, the liquid flows to the feedwater pumps where
the pressure is increased to 180 psi, and we start our process over again.
In a traditional Rankine cycle, there is a work output from the turbine. However, since this modified cycle
uses PRVs in the pressure reducing station, there is no work outputted, so the Wout term in the cycle
efficiency equation is 0:
๐œ‚ =
๐‘Š๐‘œ๐‘ข๐‘ก โˆ’ ๐‘Š๐‘–๐‘› + ๐‘„ ๐ฟ1 + ๐‘„ ๐ฟ2
๐‘„๐‘–๐‘›
Proposed Change
With the current system of PRVs, there is no work output from the pressure reducing station. In a
traditional Rankine cycle, when the steam enters and expands through a turbine, the internal energy is
converted to shaft work, resulting in a positive Wout term, which therefore means a more efficient cycle.
Figure 2: The proposed cogeneration cycle that the heat plant would operate on and corresponding T-s diagram.
For this plant, a potentially effective way to increase the cycle efficiency would be to install a
backpressure turbine-generator to conduct the pressure reducing process between the boilers and the heat
exchangers (figure 2). A backpressure steam turbine-generator is a combination of a turbine connected
directly to an electrical generator. A microturbine would be sufficient for this application, as it can deliver
the appropriate power while also fitting in the heat plant. The steam expands through the turbine, resulting
in pressure reduction and electricity generation. It expands until reaching a pressure that the facility can
0
Srivatsa
3
use. Lower pressure steam is exhausted into a process header from the steam turbine, where a nozzle
directs high pressure steam against the turbine rotor blades. The blades are attached to a shaft which
rotates to produce power for the electrical generator. The energy from the high pressure inlet is converted
to electricity, and the low pressure exhaust steam is provided to a plant process. The amount of electricity
generated depends on required pressure drop and flow. The steam turbine-generator can be connected in
parallel with the existing PRVs, so that when it needs to be taken out for maintenance, the heat plant can
still run with the PRVs [1,2].
Energy and Cost Calculations
For preliminary efficiency calculations, we find the enthalpy at the various points of both the PRV cycle
and the turbine-generator cycle using known pressure values and the steam tables. We also give flow
values at various points. These values are summarized in figure 3.
PRVs Turbine-Generator
Notes: 1. Flow calculations are shown in appendix 1.
Figure 3: Property table for the PRV cycle (left) that the plant operates on and the hypothetical turbine-generator cycle (right)
To calculate the efficiency of using both PRVs and microturbine-generators, we find the heat and work
transfer rate terms throughout the cycle. We assume that the boiler operates at an 82% efficiency, and the
hypothetical turbine to be installed will operate at a 70% efficiency. These preliminary efficiency
calculations are summarized in figure 4.
Figure 4: Heat, work, and efficiency calculations for the plant using the existing PRVs and for the proposed microturbine-generator installation.
Srivatsa
4
We see that with the PRVs, the cycle efficiency is about 76.6%, while with the proposed microturbine-
generator installation, the efficiency slightly increases to 77.2%.
In figure 5, we show a Mollier diagram with both the PRV scenario and the microturbine scenario
outlined. The various colored lines represent different conditions associated with the scenario: black for
constant pressure (195 and 40 psia), green for the saturation line, red for the isenthalpic valve condition,
yellow for an isentropic turbine condition, and blue for the microturbine with 70% efficiency. The
enthalpy values for each condition are given to the left of the diagram, and from this, we can find the
enthalpy differences between different conditions.
Figure 5: Mollier diagram that outlines the process of the PRVs and the microturbine. The black lines represent constant pressure lines (195 and
40 psia), the green line represents the saturation line, the red line represents the isenthalpic valve condition, the yellow line represent an
insentropic turbine condition, and the blue line represent a microturbine with 70% efficiency.
Next we will conduct a cost analysis of backpressure turbine generators, using values given from the
master plan. We will provide calculations of the values given in the master plan.
We will look at BPT-3B from the master plan. The indicated pressure decrease is from 180 psig to 25
psig, and the enthalpy difference between the inlet and outlet streams given is 86.2
๐‘๐‘ก๐‘ข
๐‘™๐‘
. Using a turbine
efficiency of 70% and a conversion factor of 1 btu = .293 Watt ร— hr, we find both the peak and annual
electrical generation as given in the master plan:
50,000
lb
hr
ร— 86.2
btu
lb
= 4,310,000
btu
hr
ร— .293
Watt โˆ™ hr
btu
= 1,260,000 Watt ร— .96 = 1,200 kW
299,787
klb
yr
ร— 86.2
btu
lb
= 26,000,000
kbtu
yr
ร— .293 = 7,500,000
kW โˆ™ hr
yr
ร— .96 = 7,200,000
kW โˆ™ hr
yr
In addition to this, the master plan includes a fuel cost, from which the electric savings are subtracted in
order to find annual savings. The issue with this is the fuel cost is not dependent on whether a
microturbine is installed, and therefore it should be ignored. A generated power cost is included in the
table below, but it does not have any impact on savings. With these new values calculated, parts of the
table given in the master plan are reproduced with the necessary alterations in figure 6:
Srivatsa
5
Notes: 1. Electric Peak = (Steam Peak) โˆ— (h3โˆ’h5) โˆ— (. 293071
Wattโˆ™hr
btu
) โˆ— (Generator Efficiency)
2. Electric Annual = (Steam Annual) โˆ— (h3โˆ’h5) โˆ— (.293071
Wattโˆ™hr
btu
) โˆ— (Generator Efficiency)
3. Electric Savings = Electric Annual โˆ—
$.059
KWH
4. Amort.Period =
Initial Cost
Electric Savings
5. Initial Cost Explanations and Calculations are given in Appendix 2
Figure 6: A revised analysis of backpressure turbine-generators as given in the master plan. Electric cost is $.059/KWH, fuel cost is
$5.70/mmbtu, turbine efficiency is 70%, boiler efficiency is 82%, and generator efficiency is 95%.
We can see the total savings and the payback period in figure 7 below. The lifetime for a backpressure
steam turbine-generator is about 20 years as given by the Department of Energy [1].
Figure 7: A graph of the lifetime savings for BPT-1. The payback period and the savings are indicted.
Carbon Footprint Calculations
The emissions factors for Natural Gas and Electricity are 117
lb
MMBtu
and 1.2
lb
kWh
respectively. Using a
boiler efficiency of 82% and a generator efficiency of 96%, we can find the following:
Natural Gas In =
7,199,400 kWh ร— 3413
Btu
kWh
. 82 Boiler Eff.ร— .96 Generator Eff.ร— 1,000,000
Btu
mmBtu
= 31,214 mmBtu
-4000000
-3000000
-2000000
-1000000
0
1000000
2000000
3000000
4000000
5000000
6000000
7000000
0 5 10 15 20 25
Savings($)
Time (yrs)
Lifetime Savings for BPT-1
Payback
Period Total Savings
Srivatsa
6
Natural Gas In CO2 =
1
DT
mmBtu
ร— 31,214 mmBtu ร— 117
lb CO2
mmBtu
2200
lb
mmBtu
= 1660
MT
yr
Electric Out CO2 =
7,199,400 kWh ร— 1.2
lb CO2
kWh
2200
lb
MMBtu
= 3927
MT
yr
Electric Out โˆ’ Natural Gas In = 2267
MT
yr
.
The Carbon emissions for the backpressure turbine being considered are about 2300 metric tons per year.
Case Studies
Princeton University: Princeton replaced their pressure reducing valves with 2 backpressure turbine units
made by Carrier Corporation. Their Microsteam Power System has a small footprint due to its vertical
shaft design. This arrangement has a better turn-down capability over horizontal steam turbines, which
gives better low-load performance. The two units operate in parallel, and provide 550 kW at peak. The
inlet steam pressure is between 180 psig and 220 psig, and produces 4 million kWh for the university
annually. The Microsteam turbine takes the superheated low-pressure steam that exits the PRV, which has
the same energy content as the high pressure steam, and converts it to power that generates up to 275 kW
of electricity per unit. The turbines reduce greenhouse gas emission by over 1,200 tons of CO2 annually
[5].
Indiana University operates a Microsteam turbine. It uses waste steam to generate electricity to power the
central heating plant, providing 20% of the required electricity. Their savings are $120,000 per year, and
CO2 emission are reduced by 2,000 tons per year. They installed the Microsteam power system in parallel
with the PRVs. This pressure reducing station reduces the steam from 150 psig to between 54 and 40 psig
[3].
Vanderbilt University: In 1986, Vanderbilt installed a 7000 kW backpressure steam turbine driven
generator. The load capacity is a function of steam demand; for every 27 lbs of steam flowing through the
main steam pipe leaving the power plant, 1 kW is produced from the generator. The inlet pressure and
temperature are 650 psig and 750ยฐF. Their turbine is a single-stage, impulse-type designed and
manufactured by Murray Turbomachinery as part of a complete turbine-generator package. The exhaust
steam from the backpressure turbine is directed to a campus steam distribution system. The turbine
control is provided by a Woodward Dg 505 governor configured for exhaust pressure control between 60
and 125 psig. Their turbine has a 10โ€™โ€™ inlet and the operating speed is 9807 RPM. The electrical generator
is manufactured by Ideal Electric Company and produces 7850 kW at 4160 Volts and 60 Hz when the
turbine is provided with 200,000
๐‘™๐‘
๐‘Š
of steam at 650 psig, 750ยฐF. In 2000, Vanderbilt installed 2 natural
gas turbine generators [6].
Srivatsa
7
Penn State: Uses backpressure turbine cogeneration in their West Campus steam plant. Low (13 psig) and
medium (150-170 psig) pressure steam is delivered separately to the campus, and electricity is also
generated. Both the turbines and generators are manufactured by Elliot. Their steam capacity is 350,000
(117,000 from a different source) PPH, electrical capacity is 6 (7) MW, and overall plant efficiency is
between 50 and 70%. One of their current projects is to replace two of their existing backpressure steam
turbines that are over 50 years old, which they estimate will be less than a 5.5 year payback [7,8].
Pre-design Phase
Equipment and Location: The plan is to install a backpressure steam microturbine along with a
synchronous generator in the heat plant. The unit should be able to fit through a double door. Two quotes
from manufacturers are included in Appendix 4; one from Elliott and one from AirClean Technologies.
The Elliott Turbine dimensions are about 193โ€™โ€™ x 96โ€™โ€™ x 70.5โ€™โ€™. Auxiliary equipment includes steam traps
and condensate drains. Additional considerations involve the heat exchanger that the steam travels to
following the pressure reducing station. The heat exchanger performance at lower temperatures should be
further evaluated, since it is usually designed for a temperature change of 40ยฐF, but during the winter the
temperature change is greater.
The following are potential locations for the turbine-generator to be installed:
1. The area in front of the pressure reducing valves, although there may be too little space to fit the
set. The benefit is the ease of feeding the steam with different pressures through the turbine, due
to proximity. Drawbacks include the lack of space, and the need for the flooring to be redone.
Srivatsa
8
2. Another option is on the entry floor, just next to the control room. It is more spacious, although it
is more difficult to feed piping from the existing steam.
3. The best option would be to install the set in the basement. The double doors for entry are located
a few feet away, and the steam can be fed directly downward to this location. In addition, the
domestic hot water tanks and old condensate pumps and flash tank will be removed, so there will
be plenty of space in the bay. This is highlighted in red in figure 8. The steam is exhausted at the
coordinate A.7 x 6, and it will move perpendicularly up from around the middle of the turbine.
The supply steam is located towards the end of the turbine.
Srivatsa
9
Figure 8: A portion of a diagram of the heat plant, where the red marks represent the bays for the turbine-generator set.
Piping: Piping is based on the velocity of the steam through the pipe. In this case, the steam flow is
50,000
lb
yr
. The inlet to the turbine is saturated steam at 180 psig. Our design limit will be steam moving at
100
ft
sec
, or 7200
ft
min
. We look up pipe sizes in the Camronโ€™s Hydraulic Data manual, finding the external
diameter, thickness, and internal diameter. For an 8 inch pipe, the external diameter is 8.625 inches and
the thickness is .322 inches. This means that the internal diameter is 7.981 inches. We calculate the area
(๐ด =
๐œ‹๐ท2
4
) to be .347 ft2
. We also know that the specific volume of steam at our given conditions is 2.345
๐‘“๐‘ก3
๐‘™๐‘
. We can therefore find the velocity of steam through an 8 inch pipe:
๐‘ฃ = 50,000
lb
hr
ร— 2.345
ft3
lb
รท .347ft2
รท 3600
sec
hr
= 93.86
ft
sec
We see that the velocity is within our design limit of 100
ft
sec
. Therefore, our inlet pipe size will be 8
inches. The turbine outlet conditions are saturated steam at 25 psig with 50,000
lb
yr
flow. Our design limit
will again be 100
ft
sec
. At these conditions, the specific volume is 10.4965
๐‘“๐‘ก3
๐‘™๐‘
. After looking up pipe sizes
we see that an 18 inch pipe is an external diameter of 18.0 inches and a thickness of .375 inches, which
gives an internal diameter of 17.25 inches. From this, we calculate the area (๐ด =
๐œ‹๐ท2
4
) to be 1.623 ft2
. We
can therefore find the velocity of steam through an 18 inch pipe:
Srivatsa
10
๐‘ฃ = 50,000
lb
hr
ร— 10.4965
ft3
lb
รท 1.623ft2
รท 3600
sec
hr
= 89.82
ft
sec
Again, this velocity is within our 100
ft
sec
design limit, so the outlet pipe size will be 18 inches. These
calculations donโ€™t take into consideration the effect that elbows and joints may have on the piping due to
pressure drops. The pipe sizings may need to be increased to combat this.
Electrical Connections: There are two options for the electrical connections:
1. The switchgear for the heat plant allows a maximum voltage of 480 V. Therefore, electricity
could be generated at 480 V in parallel with the transformers on the heat plant side of the
substation. To connect the generator to the switchboard, an insulated copper cable will be used.
The cable should be rated 600 V (so that it can carry 480 V) and be large enough to meet the
ampacity demands.
2. Generate power at 12.5 kVA and feed it to the other side of the transformer so that it is in parallel
with the Cavalier substation side. In this case, the cable voltage rating will be higher but the
diameter of the cable will be smaller due to the decreased ampacity.
Controls: The two vendors whose quotes are given in the appendix both specify a Siemens S7-300
controller. This controller will have to communicate with the rest of the heat plant by integrating with the
existing Toshiba DCS control system that is in place. This could be accomplished through communication
with Modbus.
References
1. http://www.energy.gov/sites/prod/files/2014/05/f16/steam20_turbogenerators.pdf
2. http://members.questline.com/Article.aspx?articleID=21655&accountID=1693&nl=12597
3. http://dms.hvacpartners.com/docs/1001/Public/02/CASESTUDY60.pdf
4. http://www.energent.net/documents/microsteam_brochure.pdf
5. http://dms.hvacpartners.com/docs/1001/Public/04/CASESTUDY57.pdf
6. http://www.vanderbilt.edu/plantops/plant.php
7. http://www.opp.psu.edu/about-opp/divisions/ee/util/steam-services/overview-of-steam-services
8. https://fod.osu.edu/utilities/files/2012_big_10.pdf
9. https://www1.eere.energy.gov/manufacturing/tech_assistance/pdfs/steam22_backpressure.pdf
Srivatsa
11
Appendix 1: Flow Calculations
We first have the diagram of the cycle that the plant operates on. We start by labeling the flow in the
portion between the feedwater pumps and the boilers (1 and 2) as x. Each time the cycle branches out
from a junction, the flow in each branch is different from the flow that enters the point. We represent this
by labeling the flow in one branch with a second variable, and labeling the flow in the other branch as the
difference between the flow entering the junction and the flow in the first branch. The reason there are
only 5 flow labels is because each device operates on the steady-flow condition. This means that the flow
entering a device is the same as the flow exiting the device. The flow exiting the hot well is the sum of the
flows at point 6 and 7 (which is 1-x), but we donโ€™t include this because it is not needed for the heat and
work rate calculations.
Having established the points at which we have different flow values, we can solve for the actual values.
By looking at a schematic of the heat plant (not shown here), we find that the flow value at x is 270,000
PPH, at y is 50,000 PPH, and at z is 6000 PPH. With these values, we can calculate that the flow (x-y) is
220,000 PPH, and the flow (y-z) is 44,000 PPH. These calculations are summarized in the table below:
Srivatsa
12
Appendix 2: Initial Cost Calculations
The Department of Energy gives a range of costs for backpressure turbogenerators based on electrical
output. For 150 kW systems, the equipment cost is $900 per kW, and for $2000 kW systems, the cost is
$200 per kW. We assume a linear relationship, and plot in order to find costs for the systems under our
consideration, shown below.
The equation for the line is given on the graph, and the peak electrical generation value can be plugged in
for x to find the cost per kW for the specific turbine-generator system. In order to find the total equipment
cost for each system, the cost per kW is multiplied by the peak electrical generation. Per the Department
of Energy, installation costs are generally 75% of equipment costs [9]. In addition, other costs such as
operation and maintenance need to be factored in. The quotes given in the โ€˜Manufacturer Quotesโ€™ section
have some cost numbers included.
y = -0.3784x + 956.76
0
100
200
300
400
500
600
700
800
900
1000
0 200 400 600 800 1000 1200 1400 1600 1800 2000 2200
Cost($/kW)
Output (kW)
Cost vs. Output for Backpressure
Turbine-Generators
Srivatsa
13
Appendix 3: Sankey Diagram
The following is a Sankey diagram for the heat plant with the hypothetical turbine installed:
Appendix 4: Manufacturer Quotes
From Elliott: pages 14-28
From AirClean Technologies: pages 29-38
Srivatsa
14
Srivatsa
15
Srivatsa
16
Srivatsa
17
Srivatsa
18
Srivatsa
19
Srivatsa
20
Srivatsa
21
Srivatsa
22
Srivatsa
23
Srivatsa
24
Srivatsa
25
Srivatsa
26
Srivatsa
27
Srivatsa
28
Srivatsa
29
Srivatsa
30
Srivatsa
31
Srivatsa
32
Srivatsa
33
Srivatsa
34
Srivatsa
35
Srivatsa
36
Srivatsa
37
Srivatsa
38

More Related Content

What's hot

Module 5 (properties of pure substance)2021 2022
Module 5 (properties of pure substance)2021 2022Module 5 (properties of pure substance)2021 2022
Module 5 (properties of pure substance)2021 2022Yuri Melliza
ย 
Chapter 3 (law of conservation of mass & and 1st law)
Chapter 3 (law of conservation of mass & and 1st law)Chapter 3 (law of conservation of mass & and 1st law)
Chapter 3 (law of conservation of mass & and 1st law)Yuri Melliza
ย 
Module 7 (processes of fluids)
Module 7 (processes of fluids)Module 7 (processes of fluids)
Module 7 (processes of fluids)Yuri Melliza
ย 
carnot cycle
carnot cyclecarnot cycle
carnot cycleRavish Roy
ย 
Thermodynamics problems
Thermodynamics problemsThermodynamics problems
Thermodynamics problemsYuri Melliza
ย 
Cairo 2nd Petrol Lecture 7
Cairo 2nd Petrol Lecture 7Cairo 2nd Petrol Lecture 7
Cairo 2nd Petrol Lecture 7Esmail Bialy
ย 
Revision on thermodynamics
Revision on thermodynamicsRevision on thermodynamics
Revision on thermodynamicscairo university
ย 
Thermodynamic Chapter 5 Air Standard Cycle
Thermodynamic Chapter 5 Air Standard CycleThermodynamic Chapter 5 Air Standard Cycle
Thermodynamic Chapter 5 Air Standard CycleMuhammad Surahman
ย 
Gas power-09
Gas power-09Gas power-09
Gas power-09UthsoNandy
ย 
Module 6 (ideal or perfect gas and gas mixture) 2021 2022
Module 6 (ideal or perfect gas and gas mixture) 2021   2022Module 6 (ideal or perfect gas and gas mixture) 2021   2022
Module 6 (ideal or perfect gas and gas mixture) 2021 2022Yuri Melliza
ย 
Ideal gas-processes
Ideal gas-processesIdeal gas-processes
Ideal gas-processesMelissaSerrano31
ย 
Thermodynamics (2013 new edition) copy
Thermodynamics (2013 new edition)   copyThermodynamics (2013 new edition)   copy
Thermodynamics (2013 new edition) copyYuri Melliza
ย 
Second law of Thermodynamics
Second law of ThermodynamicsSecond law of Thermodynamics
Second law of ThermodynamicsGOBINATHS18
ย 
Me 12 quiz no. 3
Me 12 quiz no. 3Me 12 quiz no. 3
Me 12 quiz no. 3Yuri Melliza
ย 
Maquinas y equipos termicos
Maquinas y equipos termicos Maquinas y equipos termicos
Maquinas y equipos termicos MadileyniVegaBecerra
ย 
Thermodynamics Problems Chapter 1
Thermodynamics Problems Chapter 1Thermodynamics Problems Chapter 1
Thermodynamics Problems Chapter 1VJTI Production
ย 

What's hot (20)

Module 5 (properties of pure substance)2021 2022
Module 5 (properties of pure substance)2021 2022Module 5 (properties of pure substance)2021 2022
Module 5 (properties of pure substance)2021 2022
ย 
Chapter 3 (law of conservation of mass & and 1st law)
Chapter 3 (law of conservation of mass & and 1st law)Chapter 3 (law of conservation of mass & and 1st law)
Chapter 3 (law of conservation of mass & and 1st law)
ย 
Thermodynamic, examples b
Thermodynamic, examples bThermodynamic, examples b
Thermodynamic, examples b
ย 
Ankit
AnkitAnkit
Ankit
ย 
Module 7 (processes of fluids)
Module 7 (processes of fluids)Module 7 (processes of fluids)
Module 7 (processes of fluids)
ย 
carnot cycle
carnot cyclecarnot cycle
carnot cycle
ย 
Thermodynamic, sheet 2
Thermodynamic, sheet 2Thermodynamic, sheet 2
Thermodynamic, sheet 2
ย 
Thermodynamics problems
Thermodynamics problemsThermodynamics problems
Thermodynamics problems
ย 
Cairo 2nd Petrol Lecture 7
Cairo 2nd Petrol Lecture 7Cairo 2nd Petrol Lecture 7
Cairo 2nd Petrol Lecture 7
ย 
Revision on thermodynamics
Revision on thermodynamicsRevision on thermodynamics
Revision on thermodynamics
ย 
Thermodynamic Chapter 5 Air Standard Cycle
Thermodynamic Chapter 5 Air Standard CycleThermodynamic Chapter 5 Air Standard Cycle
Thermodynamic Chapter 5 Air Standard Cycle
ย 
Gas power-09
Gas power-09Gas power-09
Gas power-09
ย 
Module 6 (ideal or perfect gas and gas mixture) 2021 2022
Module 6 (ideal or perfect gas and gas mixture) 2021   2022Module 6 (ideal or perfect gas and gas mixture) 2021   2022
Module 6 (ideal or perfect gas and gas mixture) 2021 2022
ย 
Lecture 16 thermal processes.
Lecture 16   thermal processes.Lecture 16   thermal processes.
Lecture 16 thermal processes.
ย 
Ideal gas-processes
Ideal gas-processesIdeal gas-processes
Ideal gas-processes
ย 
Thermodynamics (2013 new edition) copy
Thermodynamics (2013 new edition)   copyThermodynamics (2013 new edition)   copy
Thermodynamics (2013 new edition) copy
ย 
Second law of Thermodynamics
Second law of ThermodynamicsSecond law of Thermodynamics
Second law of Thermodynamics
ย 
Me 12 quiz no. 3
Me 12 quiz no. 3Me 12 quiz no. 3
Me 12 quiz no. 3
ย 
Maquinas y equipos termicos
Maquinas y equipos termicos Maquinas y equipos termicos
Maquinas y equipos termicos
ย 
Thermodynamics Problems Chapter 1
Thermodynamics Problems Chapter 1Thermodynamics Problems Chapter 1
Thermodynamics Problems Chapter 1
ย 

Similar to Increasing Heat Plant Efficiency with Backpressure Turbine-Generators

Power plant based on Rankine cycle
Power plant based on Rankine cyclePower plant based on Rankine cycle
Power plant based on Rankine cycleNirav Vaghela
ย 
Air-Cycle refrigeration.pdf
Air-Cycle refrigeration.pdfAir-Cycle refrigeration.pdf
Air-Cycle refrigeration.pdfEssaYimer
ย 
Thermal Analysis of Steam Turbine Power Plants
Thermal Analysis of Steam Turbine Power PlantsThermal Analysis of Steam Turbine Power Plants
Thermal Analysis of Steam Turbine Power PlantsIOSR Journals
ย 
J2006 termodinamik 1 unit9
J2006 termodinamik 1 unit9J2006 termodinamik 1 unit9
J2006 termodinamik 1 unit9Malaysia
ย 
Design and simulation of a steam turbine generator using observer based and l...
Design and simulation of a steam turbine generator using observer based and l...Design and simulation of a steam turbine generator using observer based and l...
Design and simulation of a steam turbine generator using observer based and l...Mustefa Jibril
ย 
NTPC _Traning report_dhiraj
NTPC _Traning report_dhirajNTPC _Traning report_dhiraj
NTPC _Traning report_dhirajDhiraj Kumar
ย 
control poster.pptx
control poster.pptxcontrol poster.pptx
control poster.pptxMahamad Jawhar
ย 
HHO driven CCPP
HHO driven CCPPHHO driven CCPP
HHO driven CCPPgabriel galli
ย 
Gas turbine cycle
Gas turbine cycleGas turbine cycle
Gas turbine cycleAyush Jaiswal
ย 
Brayton cycle (Gas Cycle)-Introduction
Brayton cycle (Gas Cycle)-IntroductionBrayton cycle (Gas Cycle)-Introduction
Brayton cycle (Gas Cycle)-IntroductionHashim Hasnain Hadi
ย 
Problems for power h.ppt
Problems for power         h.pptProblems for power         h.ppt
Problems for power h.pptMahamad Jawhar
ย 
Gas turbine details
Gas turbine detailsGas turbine details
Gas turbine detailsAditya Sharma
ย 
Sipat thermal power plant
Sipat thermal power plantSipat thermal power plant
Sipat thermal power plantJinendra Ninama
ย 
Sipat thermal power plant 2
Sipat thermal power plant 2Sipat thermal power plant 2
Sipat thermal power plant 2Uphaar Prasad
ย 
Turbomachinery Turbine pump Compressor.ppt
Turbomachinery Turbine pump Compressor.pptTurbomachinery Turbine pump Compressor.ppt
Turbomachinery Turbine pump Compressor.pptsbpatalescoe
ย 
Gas turbine power plants
Gas turbine power plantsGas turbine power plants
Gas turbine power plantsNishkam Dhiman
ย 
thermal project 1
thermal project 1thermal project 1
thermal project 1James Li
ย 
UNIT-III_Steam_Turbine (1).pdf
UNIT-III_Steam_Turbine (1).pdfUNIT-III_Steam_Turbine (1).pdf
UNIT-III_Steam_Turbine (1).pdfManivannan727901
ย 
gas turbine cycles.pptx .
gas turbine cycles.pptx                    .gas turbine cycles.pptx                    .
gas turbine cycles.pptx .happycocoman
ย 

Similar to Increasing Heat Plant Efficiency with Backpressure Turbine-Generators (20)

Power plant based on Rankine cycle
Power plant based on Rankine cyclePower plant based on Rankine cycle
Power plant based on Rankine cycle
ย 
Air-Cycle refrigeration.pdf
Air-Cycle refrigeration.pdfAir-Cycle refrigeration.pdf
Air-Cycle refrigeration.pdf
ย 
Thermal Analysis of Steam Turbine Power Plants
Thermal Analysis of Steam Turbine Power PlantsThermal Analysis of Steam Turbine Power Plants
Thermal Analysis of Steam Turbine Power Plants
ย 
J2006 termodinamik 1 unit9
J2006 termodinamik 1 unit9J2006 termodinamik 1 unit9
J2006 termodinamik 1 unit9
ย 
Design and simulation of a steam turbine generator using observer based and l...
Design and simulation of a steam turbine generator using observer based and l...Design and simulation of a steam turbine generator using observer based and l...
Design and simulation of a steam turbine generator using observer based and l...
ย 
NTPC _Traning report_dhiraj
NTPC _Traning report_dhirajNTPC _Traning report_dhiraj
NTPC _Traning report_dhiraj
ย 
control poster.pptx
control poster.pptxcontrol poster.pptx
control poster.pptx
ย 
HHO driven CCPP
HHO driven CCPPHHO driven CCPP
HHO driven CCPP
ย 
Gas turbine cycle
Gas turbine cycleGas turbine cycle
Gas turbine cycle
ย 
Brayton cycle (Gas Cycle)-Introduction
Brayton cycle (Gas Cycle)-IntroductionBrayton cycle (Gas Cycle)-Introduction
Brayton cycle (Gas Cycle)-Introduction
ย 
Problems for power h.ppt
Problems for power         h.pptProblems for power         h.ppt
Problems for power h.ppt
ย 
Gas turbine details
Gas turbine detailsGas turbine details
Gas turbine details
ย 
Sipat thermal power plant
Sipat thermal power plantSipat thermal power plant
Sipat thermal power plant
ย 
Sipat thermal power plant 2
Sipat thermal power plant 2Sipat thermal power plant 2
Sipat thermal power plant 2
ย 
Turbomachinery Turbine pump Compressor.ppt
Turbomachinery Turbine pump Compressor.pptTurbomachinery Turbine pump Compressor.ppt
Turbomachinery Turbine pump Compressor.ppt
ย 
Gas turbine power plants
Gas turbine power plantsGas turbine power plants
Gas turbine power plants
ย 
thermal project 1
thermal project 1thermal project 1
thermal project 1
ย 
UNIT-III_Steam_Turbine (1).pdf
UNIT-III_Steam_Turbine (1).pdfUNIT-III_Steam_Turbine (1).pdf
UNIT-III_Steam_Turbine (1).pdf
ย 
Gas turbine
Gas turbineGas turbine
Gas turbine
ย 
gas turbine cycles.pptx .
gas turbine cycles.pptx                    .gas turbine cycles.pptx                    .
gas turbine cycles.pptx .
ย 

Increasing Heat Plant Efficiency with Backpressure Turbine-Generators

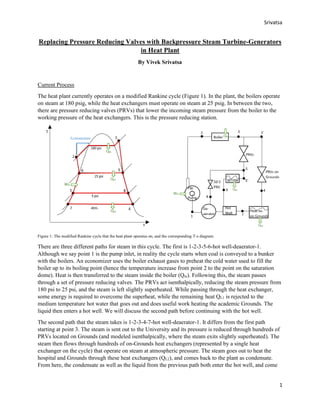
  • 1. Srivatsa 1 Replacing Pressure Reducing Valves with Backpressure Steam Turbine-Generators in Heat Plant By Vivek Srivatsa Current Process The heat plant currently operates on a modified Rankine cycle (Figure 1). In the plant, the boilers operate on steam at 180 psig, while the heat exchangers must operate on steam at 25 psig. In between the two, there are pressure reducing valves (PRVs) that lower the incoming steam pressure from the boiler to the working pressure of the heat exchangers. This is the pressure reducing station. Figure 1: The modified Rankine cycle that the heat plant operates on, and the corresponding T-s diagram. There are three different paths for steam in this cycle. The first is 1-2-3-5-6-hot well-deaerator-1. Although we say point 1 is the pump inlet, in reality the cycle starts when coal is conveyed to a bunker with the boilers. An economizer uses the boiler exhaust gases to preheat the cold water used to fill the boiler up to its boiling point (hence the temperature increase from point 2 to the point on the saturation dome). Heat is then transferred to the steam inside the boiler (Qin). Following this, the steam passes through a set of pressure reducing valves. The PRVs act isenthalpically, reducing the steam pressure from 180 psi to 25 psi, and the steam is left slightly superheated. While passing through the heat exchanger, some energy is required to overcome the superheat, while the remaining heat QL1 is rejected to the medium temperature hot water that goes out and does useful work heating the academic Grounds. The liquid then enters a hot well. We will discuss the second path before continuing with the hot well. The second path that the steam takes is 1-2-3-4-7-hot well-deaerator-1. It differs from the first path starting at point 3. The steam is sent out to the University and its pressure is reduced through hundreds of PRVs located on Grounds (and modeled isenthalpically, where the steam exits slightly superheated). The steam then flows through hundreds of on-Grounds heat exchangers (represented by a single heat exchanger on the cycle) that operate on steam at atmospheric pressure. The steam goes out to heat the hospital and Grounds through these heat exchangers (QL2), and comes back to the plant as condensate. From here, the condensate as well as the liquid from the previous path both enter the hot well, and come
  • 2. Srivatsa 2 to atmospheric pressure at around saturation (so the hot well is essentially at point 7 as well). We will discuss the final path before moving on to the deaerator. The third path for the steam is 1-2-3-5-8-deaerator-1. The difference here is at point 5. After flowing through the PRVs and being reduced to a pressure of 25 psi, some steam flows through another set of PRVs that further reduces the pressure to 5 psi. The saturated steam at point 8 then flows to an open feedwater heater (a deaerator) where it mixes with the condensate from the hot well. Here, saturated liquid is formed, and we have our outlet at point 1. Then, the liquid flows to the feedwater pumps where the pressure is increased to 180 psi, and we start our process over again. In a traditional Rankine cycle, there is a work output from the turbine. However, since this modified cycle uses PRVs in the pressure reducing station, there is no work outputted, so the Wout term in the cycle efficiency equation is 0: ๐œ‚ = ๐‘Š๐‘œ๐‘ข๐‘ก โˆ’ ๐‘Š๐‘–๐‘› + ๐‘„ ๐ฟ1 + ๐‘„ ๐ฟ2 ๐‘„๐‘–๐‘› Proposed Change With the current system of PRVs, there is no work output from the pressure reducing station. In a traditional Rankine cycle, when the steam enters and expands through a turbine, the internal energy is converted to shaft work, resulting in a positive Wout term, which therefore means a more efficient cycle. Figure 2: The proposed cogeneration cycle that the heat plant would operate on and corresponding T-s diagram. For this plant, a potentially effective way to increase the cycle efficiency would be to install a backpressure turbine-generator to conduct the pressure reducing process between the boilers and the heat exchangers (figure 2). A backpressure steam turbine-generator is a combination of a turbine connected directly to an electrical generator. A microturbine would be sufficient for this application, as it can deliver the appropriate power while also fitting in the heat plant. The steam expands through the turbine, resulting in pressure reduction and electricity generation. It expands until reaching a pressure that the facility can 0
  • 3. Srivatsa 3 use. Lower pressure steam is exhausted into a process header from the steam turbine, where a nozzle directs high pressure steam against the turbine rotor blades. The blades are attached to a shaft which rotates to produce power for the electrical generator. The energy from the high pressure inlet is converted to electricity, and the low pressure exhaust steam is provided to a plant process. The amount of electricity generated depends on required pressure drop and flow. The steam turbine-generator can be connected in parallel with the existing PRVs, so that when it needs to be taken out for maintenance, the heat plant can still run with the PRVs [1,2]. Energy and Cost Calculations For preliminary efficiency calculations, we find the enthalpy at the various points of both the PRV cycle and the turbine-generator cycle using known pressure values and the steam tables. We also give flow values at various points. These values are summarized in figure 3. PRVs Turbine-Generator Notes: 1. Flow calculations are shown in appendix 1. Figure 3: Property table for the PRV cycle (left) that the plant operates on and the hypothetical turbine-generator cycle (right) To calculate the efficiency of using both PRVs and microturbine-generators, we find the heat and work transfer rate terms throughout the cycle. We assume that the boiler operates at an 82% efficiency, and the hypothetical turbine to be installed will operate at a 70% efficiency. These preliminary efficiency calculations are summarized in figure 4. Figure 4: Heat, work, and efficiency calculations for the plant using the existing PRVs and for the proposed microturbine-generator installation.
  • 4. Srivatsa 4 We see that with the PRVs, the cycle efficiency is about 76.6%, while with the proposed microturbine- generator installation, the efficiency slightly increases to 77.2%. In figure 5, we show a Mollier diagram with both the PRV scenario and the microturbine scenario outlined. The various colored lines represent different conditions associated with the scenario: black for constant pressure (195 and 40 psia), green for the saturation line, red for the isenthalpic valve condition, yellow for an isentropic turbine condition, and blue for the microturbine with 70% efficiency. The enthalpy values for each condition are given to the left of the diagram, and from this, we can find the enthalpy differences between different conditions. Figure 5: Mollier diagram that outlines the process of the PRVs and the microturbine. The black lines represent constant pressure lines (195 and 40 psia), the green line represents the saturation line, the red line represents the isenthalpic valve condition, the yellow line represent an insentropic turbine condition, and the blue line represent a microturbine with 70% efficiency. Next we will conduct a cost analysis of backpressure turbine generators, using values given from the master plan. We will provide calculations of the values given in the master plan. We will look at BPT-3B from the master plan. The indicated pressure decrease is from 180 psig to 25 psig, and the enthalpy difference between the inlet and outlet streams given is 86.2 ๐‘๐‘ก๐‘ข ๐‘™๐‘ . Using a turbine efficiency of 70% and a conversion factor of 1 btu = .293 Watt ร— hr, we find both the peak and annual electrical generation as given in the master plan: 50,000 lb hr ร— 86.2 btu lb = 4,310,000 btu hr ร— .293 Watt โˆ™ hr btu = 1,260,000 Watt ร— .96 = 1,200 kW 299,787 klb yr ร— 86.2 btu lb = 26,000,000 kbtu yr ร— .293 = 7,500,000 kW โˆ™ hr yr ร— .96 = 7,200,000 kW โˆ™ hr yr In addition to this, the master plan includes a fuel cost, from which the electric savings are subtracted in order to find annual savings. The issue with this is the fuel cost is not dependent on whether a microturbine is installed, and therefore it should be ignored. A generated power cost is included in the table below, but it does not have any impact on savings. With these new values calculated, parts of the table given in the master plan are reproduced with the necessary alterations in figure 6:
  • 5. Srivatsa 5 Notes: 1. Electric Peak = (Steam Peak) โˆ— (h3โˆ’h5) โˆ— (. 293071 Wattโˆ™hr btu ) โˆ— (Generator Efficiency) 2. Electric Annual = (Steam Annual) โˆ— (h3โˆ’h5) โˆ— (.293071 Wattโˆ™hr btu ) โˆ— (Generator Efficiency) 3. Electric Savings = Electric Annual โˆ— $.059 KWH 4. Amort.Period = Initial Cost Electric Savings 5. Initial Cost Explanations and Calculations are given in Appendix 2 Figure 6: A revised analysis of backpressure turbine-generators as given in the master plan. Electric cost is $.059/KWH, fuel cost is $5.70/mmbtu, turbine efficiency is 70%, boiler efficiency is 82%, and generator efficiency is 95%. We can see the total savings and the payback period in figure 7 below. The lifetime for a backpressure steam turbine-generator is about 20 years as given by the Department of Energy [1]. Figure 7: A graph of the lifetime savings for BPT-1. The payback period and the savings are indicted. Carbon Footprint Calculations The emissions factors for Natural Gas and Electricity are 117 lb MMBtu and 1.2 lb kWh respectively. Using a boiler efficiency of 82% and a generator efficiency of 96%, we can find the following: Natural Gas In = 7,199,400 kWh ร— 3413 Btu kWh . 82 Boiler Eff.ร— .96 Generator Eff.ร— 1,000,000 Btu mmBtu = 31,214 mmBtu -4000000 -3000000 -2000000 -1000000 0 1000000 2000000 3000000 4000000 5000000 6000000 7000000 0 5 10 15 20 25 Savings($) Time (yrs) Lifetime Savings for BPT-1 Payback Period Total Savings
  • 6. Srivatsa 6 Natural Gas In CO2 = 1 DT mmBtu ร— 31,214 mmBtu ร— 117 lb CO2 mmBtu 2200 lb mmBtu = 1660 MT yr Electric Out CO2 = 7,199,400 kWh ร— 1.2 lb CO2 kWh 2200 lb MMBtu = 3927 MT yr Electric Out โˆ’ Natural Gas In = 2267 MT yr . The Carbon emissions for the backpressure turbine being considered are about 2300 metric tons per year. Case Studies Princeton University: Princeton replaced their pressure reducing valves with 2 backpressure turbine units made by Carrier Corporation. Their Microsteam Power System has a small footprint due to its vertical shaft design. This arrangement has a better turn-down capability over horizontal steam turbines, which gives better low-load performance. The two units operate in parallel, and provide 550 kW at peak. The inlet steam pressure is between 180 psig and 220 psig, and produces 4 million kWh for the university annually. The Microsteam turbine takes the superheated low-pressure steam that exits the PRV, which has the same energy content as the high pressure steam, and converts it to power that generates up to 275 kW of electricity per unit. The turbines reduce greenhouse gas emission by over 1,200 tons of CO2 annually [5]. Indiana University operates a Microsteam turbine. It uses waste steam to generate electricity to power the central heating plant, providing 20% of the required electricity. Their savings are $120,000 per year, and CO2 emission are reduced by 2,000 tons per year. They installed the Microsteam power system in parallel with the PRVs. This pressure reducing station reduces the steam from 150 psig to between 54 and 40 psig [3]. Vanderbilt University: In 1986, Vanderbilt installed a 7000 kW backpressure steam turbine driven generator. The load capacity is a function of steam demand; for every 27 lbs of steam flowing through the main steam pipe leaving the power plant, 1 kW is produced from the generator. The inlet pressure and temperature are 650 psig and 750ยฐF. Their turbine is a single-stage, impulse-type designed and manufactured by Murray Turbomachinery as part of a complete turbine-generator package. The exhaust steam from the backpressure turbine is directed to a campus steam distribution system. The turbine control is provided by a Woodward Dg 505 governor configured for exhaust pressure control between 60 and 125 psig. Their turbine has a 10โ€™โ€™ inlet and the operating speed is 9807 RPM. The electrical generator is manufactured by Ideal Electric Company and produces 7850 kW at 4160 Volts and 60 Hz when the turbine is provided with 200,000 ๐‘™๐‘ ๐‘Š of steam at 650 psig, 750ยฐF. In 2000, Vanderbilt installed 2 natural gas turbine generators [6].
  • 7. Srivatsa 7 Penn State: Uses backpressure turbine cogeneration in their West Campus steam plant. Low (13 psig) and medium (150-170 psig) pressure steam is delivered separately to the campus, and electricity is also generated. Both the turbines and generators are manufactured by Elliot. Their steam capacity is 350,000 (117,000 from a different source) PPH, electrical capacity is 6 (7) MW, and overall plant efficiency is between 50 and 70%. One of their current projects is to replace two of their existing backpressure steam turbines that are over 50 years old, which they estimate will be less than a 5.5 year payback [7,8]. Pre-design Phase Equipment and Location: The plan is to install a backpressure steam microturbine along with a synchronous generator in the heat plant. The unit should be able to fit through a double door. Two quotes from manufacturers are included in Appendix 4; one from Elliott and one from AirClean Technologies. The Elliott Turbine dimensions are about 193โ€™โ€™ x 96โ€™โ€™ x 70.5โ€™โ€™. Auxiliary equipment includes steam traps and condensate drains. Additional considerations involve the heat exchanger that the steam travels to following the pressure reducing station. The heat exchanger performance at lower temperatures should be further evaluated, since it is usually designed for a temperature change of 40ยฐF, but during the winter the temperature change is greater. The following are potential locations for the turbine-generator to be installed: 1. The area in front of the pressure reducing valves, although there may be too little space to fit the set. The benefit is the ease of feeding the steam with different pressures through the turbine, due to proximity. Drawbacks include the lack of space, and the need for the flooring to be redone.
  • 8. Srivatsa 8 2. Another option is on the entry floor, just next to the control room. It is more spacious, although it is more difficult to feed piping from the existing steam. 3. The best option would be to install the set in the basement. The double doors for entry are located a few feet away, and the steam can be fed directly downward to this location. In addition, the domestic hot water tanks and old condensate pumps and flash tank will be removed, so there will be plenty of space in the bay. This is highlighted in red in figure 8. The steam is exhausted at the coordinate A.7 x 6, and it will move perpendicularly up from around the middle of the turbine. The supply steam is located towards the end of the turbine.
  • 9. Srivatsa 9 Figure 8: A portion of a diagram of the heat plant, where the red marks represent the bays for the turbine-generator set. Piping: Piping is based on the velocity of the steam through the pipe. In this case, the steam flow is 50,000 lb yr . The inlet to the turbine is saturated steam at 180 psig. Our design limit will be steam moving at 100 ft sec , or 7200 ft min . We look up pipe sizes in the Camronโ€™s Hydraulic Data manual, finding the external diameter, thickness, and internal diameter. For an 8 inch pipe, the external diameter is 8.625 inches and the thickness is .322 inches. This means that the internal diameter is 7.981 inches. We calculate the area (๐ด = ๐œ‹๐ท2 4 ) to be .347 ft2 . We also know that the specific volume of steam at our given conditions is 2.345 ๐‘“๐‘ก3 ๐‘™๐‘ . We can therefore find the velocity of steam through an 8 inch pipe: ๐‘ฃ = 50,000 lb hr ร— 2.345 ft3 lb รท .347ft2 รท 3600 sec hr = 93.86 ft sec We see that the velocity is within our design limit of 100 ft sec . Therefore, our inlet pipe size will be 8 inches. The turbine outlet conditions are saturated steam at 25 psig with 50,000 lb yr flow. Our design limit will again be 100 ft sec . At these conditions, the specific volume is 10.4965 ๐‘“๐‘ก3 ๐‘™๐‘ . After looking up pipe sizes we see that an 18 inch pipe is an external diameter of 18.0 inches and a thickness of .375 inches, which gives an internal diameter of 17.25 inches. From this, we calculate the area (๐ด = ๐œ‹๐ท2 4 ) to be 1.623 ft2 . We can therefore find the velocity of steam through an 18 inch pipe:
  • 10. Srivatsa 10 ๐‘ฃ = 50,000 lb hr ร— 10.4965 ft3 lb รท 1.623ft2 รท 3600 sec hr = 89.82 ft sec Again, this velocity is within our 100 ft sec design limit, so the outlet pipe size will be 18 inches. These calculations donโ€™t take into consideration the effect that elbows and joints may have on the piping due to pressure drops. The pipe sizings may need to be increased to combat this. Electrical Connections: There are two options for the electrical connections: 1. The switchgear for the heat plant allows a maximum voltage of 480 V. Therefore, electricity could be generated at 480 V in parallel with the transformers on the heat plant side of the substation. To connect the generator to the switchboard, an insulated copper cable will be used. The cable should be rated 600 V (so that it can carry 480 V) and be large enough to meet the ampacity demands. 2. Generate power at 12.5 kVA and feed it to the other side of the transformer so that it is in parallel with the Cavalier substation side. In this case, the cable voltage rating will be higher but the diameter of the cable will be smaller due to the decreased ampacity. Controls: The two vendors whose quotes are given in the appendix both specify a Siemens S7-300 controller. This controller will have to communicate with the rest of the heat plant by integrating with the existing Toshiba DCS control system that is in place. This could be accomplished through communication with Modbus. References 1. http://www.energy.gov/sites/prod/files/2014/05/f16/steam20_turbogenerators.pdf 2. http://members.questline.com/Article.aspx?articleID=21655&accountID=1693&nl=12597 3. http://dms.hvacpartners.com/docs/1001/Public/02/CASESTUDY60.pdf 4. http://www.energent.net/documents/microsteam_brochure.pdf 5. http://dms.hvacpartners.com/docs/1001/Public/04/CASESTUDY57.pdf 6. http://www.vanderbilt.edu/plantops/plant.php 7. http://www.opp.psu.edu/about-opp/divisions/ee/util/steam-services/overview-of-steam-services 8. https://fod.osu.edu/utilities/files/2012_big_10.pdf 9. https://www1.eere.energy.gov/manufacturing/tech_assistance/pdfs/steam22_backpressure.pdf
  • 11. Srivatsa 11 Appendix 1: Flow Calculations We first have the diagram of the cycle that the plant operates on. We start by labeling the flow in the portion between the feedwater pumps and the boilers (1 and 2) as x. Each time the cycle branches out from a junction, the flow in each branch is different from the flow that enters the point. We represent this by labeling the flow in one branch with a second variable, and labeling the flow in the other branch as the difference between the flow entering the junction and the flow in the first branch. The reason there are only 5 flow labels is because each device operates on the steady-flow condition. This means that the flow entering a device is the same as the flow exiting the device. The flow exiting the hot well is the sum of the flows at point 6 and 7 (which is 1-x), but we donโ€™t include this because it is not needed for the heat and work rate calculations. Having established the points at which we have different flow values, we can solve for the actual values. By looking at a schematic of the heat plant (not shown here), we find that the flow value at x is 270,000 PPH, at y is 50,000 PPH, and at z is 6000 PPH. With these values, we can calculate that the flow (x-y) is 220,000 PPH, and the flow (y-z) is 44,000 PPH. These calculations are summarized in the table below:
  • 12. Srivatsa 12 Appendix 2: Initial Cost Calculations The Department of Energy gives a range of costs for backpressure turbogenerators based on electrical output. For 150 kW systems, the equipment cost is $900 per kW, and for $2000 kW systems, the cost is $200 per kW. We assume a linear relationship, and plot in order to find costs for the systems under our consideration, shown below. The equation for the line is given on the graph, and the peak electrical generation value can be plugged in for x to find the cost per kW for the specific turbine-generator system. In order to find the total equipment cost for each system, the cost per kW is multiplied by the peak electrical generation. Per the Department of Energy, installation costs are generally 75% of equipment costs [9]. In addition, other costs such as operation and maintenance need to be factored in. The quotes given in the โ€˜Manufacturer Quotesโ€™ section have some cost numbers included. y = -0.3784x + 956.76 0 100 200 300 400 500 600 700 800 900 1000 0 200 400 600 800 1000 1200 1400 1600 1800 2000 2200 Cost($/kW) Output (kW) Cost vs. Output for Backpressure Turbine-Generators
  • 13. Srivatsa 13 Appendix 3: Sankey Diagram The following is a Sankey diagram for the heat plant with the hypothetical turbine installed: Appendix 4: Manufacturer Quotes From Elliott: pages 14-28 From AirClean Technologies: pages 29-38