poster
- 1. TEMPLATE DESIGN © 2008
www.PosterPresentations.com
Student Perceptions of EECS Faculty by Gender
Victoria Lo, Virginia Smith, Katherine Driggs Campbell
Electrical Engineering and Computer Science Department
University of California, Berkeley
Summary
Why do we care?
Layout of the Survey and Format of the Data
Dataset Difficulties
Data Processing
Initial Findings – Spring 2014
Further Findings – 2009-2014
Even Further Findings – 2009-2014
Discussion
Acknowledgements
The project was envisioned and headed by Professor Tsu-Jae King Liu, chair of
the EECS department. Data was collected by the Berkeley chapter of Eta Kappa
Nu (HKN), from years 2000 – 2014 and provided to us by Meg Pressley. R, its
various packages, and Microsoft Excel were invaluable to the project.
Objective:
- To determine whether there is a correlation between the
gender of EECS faculty and student perceptions of those
faculty
Problem Statement:
- To analyze course survey data from past EECS classes
to determine whether there are biases in the way
professors of either gender are graded and quantified on
their teaching
Challenges:
- A fairly large dataset with inconsistent formatting
Initial Findings:
- Relative to men, women tend to receive a lower "overall
effectiveness" score despite scoring similarly in the other
questions.
Further Work
Question
Number
Female Males
Difference
(m – f)
P-values
for t-tests
1 5.414706 5.825886 0.41118 2.854907e-04
2 5.58382 5.81233 0.228503 1.772200e-02
3 4.12206 4.31834 0.196277 1.265415e-02
4 4.64559 4.64515 -0.00044 9.911565e-01
5 4.3 4.43066 0.130663 5.468873e-03
6 3.77353 4.03313 0.259599 6.571301e-04
7 4.01029 4.19646 0.186162 1.728485e-02
8 4.53235 4.50431 -0.02804 5.268463e-01
9 4.26765 4.45424 0.18659 4.952735e-03
10 4.41765 4.28891 -0.12874 3.500478e-02
11 4.35735 4.31664 -0.04071 5.105222e-01
12 4.39706 4.48089 0.083835 4.545086e-01
13 3.92206 4.01464 0.092579 1.518178e-01
14 3.83088 3.87381 0.042924 7.576140e-01
15 4.08971 4.0359 -0.0538 4.577405e-01
16 4.11177 4.23975 0.127988 5.682854e-02
17 2.72059 2.84222 0.121631 1.043149e-01
18 3.82059 3.79615 -0.02444 7.251425e-01
19 2.89118 3.21479 0.323616 3.003714e-05
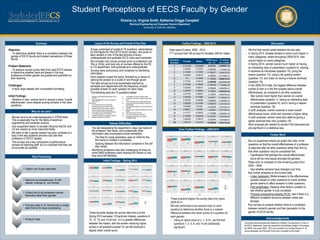
These boxplots display the survey data from just the
Spring 2014 semester. Of particular interest, questions 6,
10, 14, 15, and 19 all had ~0.4 or greater differences
between the means, with the women receiving higher
scores in all questions except 19, yet still received a
slightly lower overall score.
- Run an experiment where we switch the order of the
questions so that the overall effectiveness of a professor
is rated last after all other questions rather than first so
that other questions may be considered first.
- Hypothesize that perhaps the overall effectiveness
score will be more equal amongst the genders.
- Parse and run analyses on the remaining years from
2000 – 2009.
- See whether opinions have changed over time.
- Run further analyses on the current data.
- Linear regression: Model answers to the effectiveness
question based on other questions to check whether
gender seems to affect answers to other questions.
- Post stratification: Keeping other factors constant to
see whether gender is truly correlated.
- Principal components analysis (PCA): See if there is a
different correlation structure between males and
females..
- Run surveys to analyze whether there is a correlation
between student’s gender and their perception to the
gender of EECS faculty.
- Data spans 6 years: 2009 – 2014
- 717 surveys total: 68 surveys for females; 649 for males
- Women tend to be underrepresented in STEM fields.
This is especially true for the fields of electrical
engineering and computer science.
- One suspected reason is societal influence that EE and
CS are viewed as more masculine fields.
- We want to see if gender biases may also correlate to a
bias in the way students perceive and rate their
professors in EECS classes.
- The surveys are a key component of performance
reviews for teaching staff, so it is important that they are
as accurate as possible.
- Survey comprised of a total of 19 questions, administered
by Eta Kappa Nu (the EECS honor society), and given to
each student in one of the last lectures of every
undergraduate and graduate EECS class each semester.
- We consider only course surveys given to professors (not
TAs or GSIs), and look only at courses offered by the EE
or CS department, both graduate and undergraduate.
- Surveys were anonymous and contained no identifying
information.
- Each question posed the query, followed by a choice of
ranking the answer on a scale of one through seven
- The data arrived as Excel worksheets batched by
semester and department with the frequency of each
possible answer for each question for each class.
- The following were the 19 questions asked:
- The cell designating the department, class, last name of
the professor, first name, and occasionally other
information was inconsistent across semesters
- The files for some semesters used an initial for the
first name or omitted it completely.
- Spacing between the information contained in the cell
also varied.
- Identifying professors was also challenging at times as
some listed professors were missing first names or had
long since left Berkeley.
- We find that results varied between the two sets.
- In Spring 2014, females tended to score much higher in
many categories, where throughout 2009-2014, men
scored higher on some categories.
- In Spring 2014, women scored much higher on having
an interesting style of presentation (question 6), relating
to students as individuals (question 10), giving fair
exams (question 14), using a fair grading system
(question 15), and lower on having a heavier workload
(question 19).
- In the 2009-2014 data, the biggest difference between
women & men is in the first question about overall
effectiveness, as compared to all other questions.
- Men scored much higher than women on overall
effectiveness (question 1), having an interesting style
of presentation (question 6), and in having a heavier
workload (question 19).
- In both analyses, women received a lower overall
effectiveness score, while men received a higher rating.
In both analyses, women were also rated as giving a
lighter workload than men (question 19).
- More analyses are needed to decide if the discrepancies
are significant in a statistical way.
1. Rate the overall teaching effectiveness of this
professor.
2. How worthwhile was this course compared to
others at U.C.?
This professor:
1. Gives lectures that are well organized.
2. Is enthusiastic about the subject matter.
3. Identifies what he/she considers important.
4. Has an interesting style of presentation.
5. Uses visual aids and blackboards effectively.
6. Encourages questions from students.
7. Is careful and precise in answering questions.
8. Relates to students as individuals.
9. Is accessible to students outside of class.
10. Is amicable and helpful to students during office
hours.
11. Gives interesting and stimulating assignments.
12. Gives exams that permit students to show their
understanding.
13. Uses a grading system that is clearly defined and
equitable.
14. Required course material is sufficiently covered in
lecture.
15. Pace of the course is too fast.
16. The required text/notes is beneficial.
17. Workload is heavier than for courses of
comparable credit.
Raw Data
• Obtain raw Excel data files
Clean
• Remove inconsistencies, fix NA
values, change to .csv format
Label
Genders
• Collect list of all professor names.
Manually label their gender.
Process
• Process data in R, format into a single
data frame for easy processing
Analysis
• Analyze data