Assessment of Body Composition by Bioelectrical Impedance Analysis in Type 2 ...
Final Poster
1. CONTRIBUTION OF BMI TO SEDENTARY BEHAVIOR AND PHYSICAL ACTIVITY
IN OLDER ADULTS
Victoria M. Libby, Morgan P. Baumgartner, Breanna M. Bozzuto, Brittany N. Marshall, Dain P. LaRoche (FACSM)
Department of Kinesiology, University of New Hampshire, Durham, NH
ABSTRACT
Increases in sedentary behavior (SB) and decreases in physical activity (PA) with age contribute to elevated health
risks in older adults, but it is unknown how BMI affects SB and PA in older adults. The purpose of this study was to
investigate the role of BMI on SB and PA patterns in older adults. It was hypothesized that BMI and age would
explain variances in daily stepping and sedentary time. Twenty-six older men and women (65+ yr) volunteered and
were separated into normal weight (NW) and overweight-obese (OW) groups by a 25 kg·m-2 criterion. Subjects
were fit with an ActivPal accelerometer on the upper thigh to monitor activity patterns for 96 hours. Subjects kept
sleep logs, so total sleeping time could be subtracted from monitoring time to report SB and PA during waking
hours. Variables include total energy expenditure (EE), sitting/lying time, standing time, stepping time, and
fragmentation, calculated as number of sedentary bouts divided by the total sedentary time. Multivariate analysis of
variance was used to compare group means with age as a covariate. Significance was set at P < 0.05. The BMI for
NW was 22.8 ± 0.8 kg·m-2 and was 29.0 ± 0.9 kg·m-2 for OW (P=0.001). NW was 80.7 ± 8.1 years and OW 73.7
± 8.4 years (P=0.03). OW had lower EE (33.78 ± 0.31 MET·hr·day-1) than NW (34.83 ± 0.28 MET·hr·day-1,
P=0.024), stepping time (1.74 ± 0.14 hrs·day-1 vs 2.19 ± 0.12 hrs·day-1, P=0.026), and fragmentation (5.00 ±
0.50 bouts·sedentary hr-1 vs 6.56 ± 0.46 bouts·sedentary hr-1, P=0.040). OW and NW were similar for sitting/lying
time (9.66 ± 0.54 hrs·day-1 vs 8.54 ± 0.50 hrs·day-1, P=0.159) and standing time (4.53 ± 0.43 hrs·day-1 vs 5.54 ±
0.40 hrs·day-1, P=0.110). Results showed that BMI is a significant predictor of PA and SB in older adults, but only if
the effect of age is accounted for on these variables. Due to the cross-sectional design of this study, it cannot be
determined if overweight-obesity is the cause of low PA, or if limited activity is the cause of excess weight in this
sample.
Supported by the UNH Hamel Center for Undergraduate Research
Program Number - Poster Board Number 8
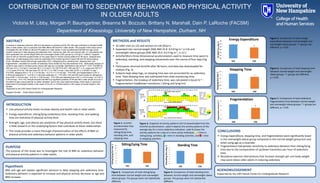
Figure 3. Comparison of total sitting/lying
time between normal weight and overweight-
obese groups. The groups were not statistically
different.
Figure 7. Comparison of total sedentary
fragmentation time between normal weight
and overweight-obese groups. *= groups are
different, p < 0.05.
Figure 5. Comparison of total energy
expenditure between normal weight and
overweight-obese groups. *= groups are
different, p < 0.05.
INTRODUCTION
Low physical activity levels increase obesity and health risks in older adults .
Energy expenditure, sitting/lying (sedentary) time, standing time, and walking
time are indicative of physical activity level
Strength, age, and obesity are predictive of low physical activity levels, but there
is little research on the underlying factors that contribute to these relationships
This study provides a more thorough characterization of the effects of BMI on
physical activity and sedentary behavior patterns in older adults
PURPOSE
The purpose of this study was to investigate the role of BMI on sedentary behavior
and physical activity patterns in older adults
Hypothesis
BMI and age will explain significant variance in daily stepping and sedentary time.
Sedentary behavior is expected to increase and physical activity decrease as age and
BMI increase
METHODS and RESULTS
26 older men (n=12) and women (n=14) (65yr+).
Separated into normal weight (NW, BMI 22.8 ±0.8 kg m-2 n=14) and
overweight-obese groups (OW, BMI 29.0 ±0.9 kg m-2, n=12 ).
ActivPal Micro three dimensional accelerometers used to measure time spent in
sedentary, standing, and stepping movements over the course of four days (Fig.
1)
Participants returned ActivPal after 96 hours, and data was downloaded for
analysis (Fig. 2)
Subjects kept sleep logs, so sleeping time was not accounted for as sedentary
time. Total sleeping time was subtracted from total monitoring time.
Fragmentation, the breakup of sedentary time, was calculated in bouts·hr-1 :
Fragmentation=(Up&Down transitions / sitting and lying hrs)
CONCLUSIONS
Energy expenditure, stepping time, and fragmentation were significantly lower
in the overweight-obese group compared to the normal weight group but only
when using age as a covariate
Fragmentation had greater sensitivity to sedentary behavior than sitting/lying
time due to the incorporation of up/down transitions per hour of sedentary
time
Resistance exercise interventions that increase strength per unit body weight
may assist obese older adults in reducing sedentary
ACKNOWLEDGEMENT
Supported by the UNH Hamel Center for Undergraduate Research
Figure 1. ActivPal
accelerometer that
measured EE,
sitting/lying time,
standing time, and
stepping time.
Figure 2. Snapshot of activity patterns (24 hr) downloaded from the
ActivPal accelerometers. Label A depicts the activity patterns of the
average day for a more sedentary individual. Label B shows the
activity patterns for a day of a more active individual. = time in
sitting/lying activities, = time in standing activities, and = time
in stepping activities.
Figure 6. Comparison of total stepping time
between normal weight and overweight-
obese groups. *= groups are different,
p < 0.05.
Figure 4. Comparison of total standing time
between normal weight and overweight-obese
groups. The groups were not statistically
different.
A
B