1. -0.04
-0.03
-0.02
-0.01
0
0.01
0.02
0.03
0.04
-100 0 100 200 300
Effect of a Total Protein Intake on Bone Health in
Overweight and Obese Adults Following a 36-Week
Exercise and Diet Intervention
Wright CS, Weinheimer-Haus EM, Campbell WW
Department of Nutrition Science, Purdue University, West Lafayette, IN, USA
Abstract
Introduction
Methods
Results
Dietary protein is an essential macronutrient required for proper skeletal growth and adaptation. However, controversy exists
concerning the effects of higher total protein intake (TPro) on bone health, which may be associated with reduced bone mineral
density (BMD). This study investigated the effects of TPro (dietary intake + supplementation) and change in TPro (post-pre) on
BMD and bone mineral content (BMC; total body, total femur, femoral neck, and lumbar spine) in overweight and obese adults
(N=113, age 50 ± 8 y, BMI 30.1 ± 2.9 kg/m2). This secondary analysis utilized data from a 36-week intervention where
participants consumed whey protein supplements (0g, 10g, 20g, and 30g consumed twice daily with breakfast and
lunch) along with their otherwise unrestricted diet and performed exercise training (resistance 2 d/wk and aerobic 1
d/wk). Anticipated differences and trends in indices of bone health (BMD and BMC) were observed including lower BMD in
women versus men and decreases in BMD over time in peri-menopausal women. Using a multiple linear regression model,
TPro (g•d-1 or g•kg-1•d-1) and change in TPro (g•d-1) were not associated with changes in total or regional BMD or BMC.
Employing a cluster analysis approach (< 1.0 (n=41); 1.0-1.2 (n=28); ≥1.2 g•kg-1•d-1 (n=43)), TPro was also not associated
with changes in total or regional BMD or BMC over time. Dietary protein did not negatively or beneficial affect bone
health in overweight and obese adults during a 9-month exercise intervention.
Objective & Hypothesis
To assess the effect of total protein intake on bone health in
overweight and obese adults following a 36-week
exercise and diet intervention.
Neither total protein intake nor change in total protein intake will
negatively affect bone health in overweight and obese adults
following a 36-week exercise and diet intervention.
Conclusions
Total protein intake did not affect bone quantity in overweight and obese adults following a 36-week exercise and
diet intervention.
Higher protein intake can be safely incorporated into an exercise intervention without affecting bone health.
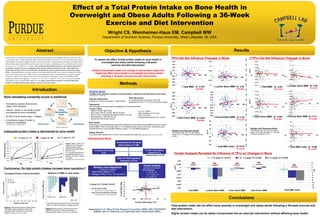
TPro Did Not Influence Changes in Bone
Inadequate protein intake is detrimental for bone health
Original Study
A double-blind, placebo-controlled, community-based, randomized 36-week intent-to-treat study
(Weinheimer et al, J Nutr 2012).
• Male or Female, age 35-65y
• Body mass <300 lb (136 kg), BMI 26-35 kg/m2
• Not on a diet or experiencing weight change (±4.5 kg)
• Blood pressure <160/100 mm Hg
• Normal liver and kidney function
• LDL <4.1 mmol/L
• Total cholesterol <6.7 mmol/L
• TGA <4.5 mmol/L
• Fasting plasma glucose <6.1 mmol/L
Exercise Intervention
Resistance (2 d/wk) and aerobic (1 d/wk) training
Diet Intervention
An unrestricted diet consuming a 200 kcal
supplement (2 per d, 0, 10, 20 or 30 g whey protein)
Participants
188 overweight and obese adults completed the 9-month intervention
Inclusion Criteria:
Retrospective Study
Completed the 36-week
intervention (n=188)
Bone Health
Dual-energy X-ray absorptiometry was used to determine bone mineral density (BMD) and bone mineral
content (BMC) of the whole body (total), L1-L4 vertebrae (lumbar spine), total femur, and femoral neck
(LUNAR iDXA and Lunar enCORE software, version 11.2; GE Medical Systems).
Dietary Records
The dietary data obtained from 4-d food records (baseline & week 36) (Goldberg BR et al, Eur J Clin Nutr 1991)
*Invalid 4-Day dietary
records (n=71)
Incomplete Bone Data
(n=4)
Data for Retrospective
Analysis (n=113)
*Goldberg Dietary Cut-Off
Multiple Linear Regression
(continuous variable)
1. Total Protein Intake (TPro)
2. Change in TPro (CTPro, During-Before)
Cluster Analysis
(categorical variable)
• TPro Clusters
• <1.0 g•kg-1•d-1
• 1.0-1.2 g•kg-1•d-1
• ≥1.2 g•kg-1•d-1
1.0 g•kg-1•d-1 Cluster Cut-off
• 50-75% usual intake
• (Berner LA et al , J Acad Nutr Diet 2013)
• Lack of body composition change
• (Campbell WW et al, J Am Coll Nutr 2007)
Protein Intake (g•kg-1•d-1)
ΔLeanMass(kg)
1.0
CTPro Did Not Influence Changes in Bone
-0.1
-0.05
0
0.05
0.1
0.15
0 50 100 150 200 250
∆ Lumbar Spine BMD
∆g/cm2
-0.05
-0.04
-0.03
-0.02
-0.01
0
0.01
0.02
0.03
0.04
0 50 100 150 200 250
∆ Femoral Neck BMD
-0.03
-0.02
-0.01
0
0.01
0.02
0.03
0.04
0 50 100 150 200 250
∆ Total Femur BMD
-0.04
-0.03
-0.02
-0.01
0
0.01
0.02
0.03
0.04
0 50 100 150 200 250
∆ Total BMD
∆g/cm2
β= 0.150
P= 0.123
β= -0.59
P=0.535
β= 0.002
P=0.984
β= -0.038
P=0.697
-60
-40
-20
0
20
40
60
0 50 100 150 200 250
∆ Total BMC Index
∆g/cm2
∆g/cm2
∆ Total BMD β= -0.031
P= 0.742
β= 0.018
P= 0.847
-0.1
-0.05
0
0.05
0.1
0.15
-100 0 100 200 300
∆ Lumbar Spine BMD β= -0.68
P= 0.071
∆ Total Femur BMD
-0.03
-0.02
-0.01
0
0.01
0.02
0.03
0.04
-100 0 100 200 300
∆g/cm2
β= -0.005
P= 0.958
-0.05
-0.04
-0.03
-0.02
-0.01
0
0.01
0.02
0.03
0.04
-100 0 100 200 300
∆ Femoral Neck BMD β= 0.112
P= 0.240
-60
-40
-20
0
20
40
60
-100 0 100 200 300
∆ Total BMC Index β= -0.069
P= 0.470
Multiple Linear Regression Model
Controlling for age, sex, and menopausal
status, TPro vs. Changes in Bone (Post-Base),
p<0.05
Multiple Linear Regression Model
Controlling for age, sex, and menopausal
status, CTPro (During-Before) vs. Changes
in Bone (Post-Base), p<0.05
Cluster Analysis Revealed No Influence of TPro on Changes in Bone
-0.03
-0.025
-0.02
-0.015
-0.01
-0.005
0
0.005
0.01
Total BMD Lumbar Spine BMD Femur Neck BMD Total Femur BMD
-14
-12
-10
-8
-6
-4
-2
0
2
4
6
Total BMC Index
< 1.0 g•kg-1•d-1 (n=41) 1.0 - 1.2 g•kg-1•d-1 (n=28) ≥ 1.2 g•kg-1•d-1 (n=43)
n/s n/s n/s n/s
n/s
Controversy: Do high protein intakes increase bone resorption?
∆g/cm2
∆g/h
• Remodeling replaces older bone &
repairs micro-fractures.
• Calcium, vitamin D, and dietary protein
are essential for bone remodeling.
• 20-25% of bone mass is type 1 collagen
• A continuous supply of protein is
needed for remodeling.
dreva.com, March 2011
Burr DB & Allen MR, Elsevier 2013
Percent4-YearBMDLoss
R =0.7
P <0.001
0 20 40 60 80 100 120 140 160
12
11
10
9
8
7
6
5
4
3
2
1
0
UrineCa,mmol/d
Dietary Protein, g/d
Figure 2. Relationship between dietary protein
and urinary calcium excretion. Each point
represents mean excretion from one of 26
studies (Kerstetter JE et al, J Nutr 2003).
Figure 3. Mean percent (±SE) bone loss over 4
years at hip, spine, and radius by quartiles of
increase protein intake (Hannan MR et al, JBMR 2000)
Least Squares Means adjusted for sex and total caloric
intake, *p < 0.05, all comparisons to highest quartile 4
IntactPTH(mmol/L)
1,25(OH)2D(pmoll/L)
Figure 1. Mean (±SE) in 16
young women consuming
different protein intakes.
Dashed line denotes upper
limit of normal.
PTH, parathyroid hormone.
Significantly different from
MP diet, aP<0.05, bP<0.005,
cP<0.0001.
(Kerstetter JE, Am J Clin Nutr 1997)
0.7 g•kg-1•d-1, LP 1.0 g•kg-1•d-1, MP 2.1 g•kg-1•d-1, HP
a
c
b
c
c
1 4 14
Day
1 4 14
Day
Increased Urinary Calcium Excretion Retention of BMD in older adults
Bone remodeling constantly occurs in adulthood