Primer on Managed Futures
•
1 like•919 views

The paper opens with an overview of the commodity trading advisor (CTA) sector, highlighting the significant growth that has taken place in the managed futures industry in recent years and explaining how the managed futures strategies that CTAs employ work in practice. The breadth of sub-strategies under the managed futures umbrella are then examined. The third part of the paper examines the benefits and perceived risks to investors of allocating to managed futures strategies and also addresses various common misunderstandings about CTAs. The paper concludes by exploring the common ways as to how investors can access the various investment strategies that are available

Recommended
Recommended
More Related Content
What's hot
What's hot (20)
Similar to Primer on Managed Futures
Similar to Primer on Managed Futures (20)
More from Trading Game Pty Ltd
More from Trading Game Pty Ltd (20)
Recently uploaded
Recently uploaded (20)
Primer on Managed Futures
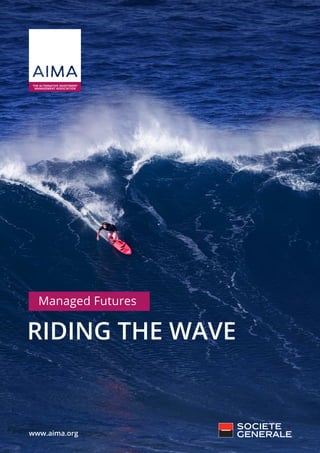
- 1. RIDING THE WAVE 1 Managed Futures RIDING THE WAVE www.aima.org
- 3. RIDING THE WAVE 3 CONTENTS Foreword Page 4 Executive summary Page 5 What are managed futures? Page 6 The growth of the managed futures industry Page 7 What do managed futures trade? Page 8 Who makes the decisions? Page 9 How do managed futures trade? Page 10 Diversity of managed futures Page 11 Importance of manager selection Page 15 Performance characteristics of managed futures Page 16 The benefits of allocating to managed futures in an investment portfolio Page 18 Popular misconceptions associated with managed futures investing Page 23 Accessing managed futures Page 28 Key takeaways Page 29 About AIMA and Societe Generale Page 30
- 4. Managed Futures 4 FOREWORD Jack Inglis CEO, Alternative Investment Management Association (AIMA) Tom Wrobel CAIA, Director, Alternative Investments Consulting, Societe Generale Prime Services Managed futures funds have been the source of significant interest among investors, particularly since the sector outperformed so spectacularly during the global financial crisis. Since the crisis, allocations have increased – growing from a little over $200bn at the end of 2008 to around $340bn by the end of 2016. There will always be caution among some investors, of course. Describing managed futures funds as “black boxes” may be inaccurate (and rather unfair), but many institutions clearly continue to avoid the sector. That is why we wanted to produce this educational paper. For AIMA, the managed futures industry is an essential constituency of our membership. Societe Generale Prime Services has a full-service multi-asset platform, and specialises in servicing CTA firms and is passionate about improving understanding of the sector. CTA trend-followers and other managed futures funds offer tremendous benefits to investors – and have done so for many, many years, not only in 2008. This is not a marketing paper and we recognise that CTAs are not for everybody. There are always periods of underperformance, but collectively and on average, CTAs offer competitive risk-adjusted and non-correlated returns, and have historically demonstrated their ability to provide downside protection. We hope, with the help of this paper, that investors will be able to make better informed decisions about the sector.
- 5. 5 5 RIDING THE WAVE EXECUTIVE SUMMARY Structure: The paper opens with an overview of the commodity trading advisor (CTA) sector, highlighting the significant growth that has taken place in the managed futures industry in recent years and explaining how the managed futures strategies that CTAs employ work in practice. The breadth of sub-strategies under the managed futures umbrella are then examined. The third part of the paper examines the benefits and perceived risks to investors of allocating to managed futures strategies and also addresses various common misunderstandings about CTAs. The paper concludes by exploring the common ways as to how investors can access the various investment strategies that are available. Sector characteristics: Managed futures is one of the key alternative investment strategies, accounting for approximately $340bn in total assets under management. Whilst the industry has become dominated by systematic trend following, there is an assortment of sub-investment strategies that are available, and they all have one thing in common – they seek to generate absolute returns through active trading in the global futures (and foreign exchange) markets. Most of the managed futures programs are systematic and quantitatively driven via mathematical models and computational power to help guide their trading decisions. Few are discretionary, although still make substantial use of quantitative analysis in their decision making process. The range of returns between the best and worst performing CTAs is comparatively large – making CTA selection all-important for investors. Investor benefits: This paper shows that CTAs typically offer diversification benefits, dampen portfolio volatility and provide uncorrelated returns. Positive returns of course are not guaranteed, but CTAs are still often regarded by investors as “insurance” products, given their tendency to outperform during market falls and crises. Particularly noteworthy was their performance collectively in 2008, when all CTAs in the Societe Generale managed futures database reported positive returns and many were up by more than 30% for the year. Performance characteristics: Managed futures strategies have demonstrated strong performance over long-term horizons, especially in comparison to traditional equity and bond markets. There have also been consistent asset flows into CTAs, particularly in recent history. As a result, the sector has grown significantly, increasing by more than nine fold since 2000. In a portfolio context CTAs can add significant value and diversification benefits for investors. For example the performance of a traditional asset mix of 60% bonds and 40% equities are enhanced with the addition of CTA strategies, which may increase the return and risk- adjusted returns (by lowering the volatility), as well as considerably lowering and shortening drawdowns.
- 6. Managed Futures 6 Managed futures is one of the key alternative investment strategies. Whilst there are an assortment of sub- investment strategies within the universe of managed futures, they all have one thing in common – they seek to generate absolute returns through active trading in the global futures (and foreign exchange) markets. Most of the managed futures programs are systematic and quantitatively driven via mathematical models and computational power to help guide their trading decisions. Few are discretionary, although even these still make substantial use of quantitative analysis in their decision making process. The industry has become dominated by a type of systematic trading called trend- following, and this is generally the first port of call for new investors into managed futures strategy. In the United States of America, there is a regulatory term for organisations that provide advice for those specific markets/instruments, where they are known as Commodity Trading Advisors (CTA). Despite managed futures strategies having evolved significantly to incorporate financial markets and foreign exchange, in the industry the terms managed futures and “CTA” are often used interchangeably and globally. For the purposes of this paper, we will use the term CTA to describe an investment manager who runs a managed futures investment strategy. WHAT ARE MANAGED FUTURES?
- 7. RIDING THE WAVE 7 The appeal of liquid, transparent and uncorrelated returns has been a significant factor in the growth of the managed futures sector. The significant increase in interest from institutional investors, increased open interest and liquidity in futures markets, and continuous improvement in information technology, have led to an uptick in the rate of growth over the last decade. Indeed, the sector has grown considerably over the past 35 years and continues to attract further investment. Since the year 2000 the total assets under management across managed futures strategies increased more than nine fold with the sector estimated to manage in excess of $340bn in assets as at the end of 2016 according to Barclayhedge1 (see for reference figure (1) below). Last year also saw the strategy receive the highest level of capital investment (as measured by inflows) versus any other hedge fund strategy with approximately $17bn being invested2 . Notably, the appeal of the managed futures strategy rose in prominence arising from the events of the 2008 stock market crash. The positive performance of managed futures at that time in comparison to significant negative performance from other traditional risk asset classes created positive press and record capital inflows for managed futures for the following three years. The increased awareness of issues identified by studies in behavioural finance has also been a principal driver in the growth of the managed futures sector and other forms of investing which are led by quantitative analysis. A number of these behavioural biases have been shown to affect the trading decisions of even knowledgeable and competent practitioners leading to more investors being persuaded to choose more systematic approaches when making an investment. Further support for the increased interest in managed futures strategies (and in particular systematic trend following strategies) points to a growing amount of research which opines that evidenced-based algorithms may be able to predict the future more accurately than human forecasters. Figure (1) Managed Futures Industry – Assets under Management Figure 1: Managed futures industry AUM (Source: BarclayHedge) $350 $300 $250 $200 $150 $100 $50 $0 USDBillions 1 AUM as at the end of 2016 – source BarclayHedge, Ltd. 2 Source: BarclayHedge, Ltd. THE GROWTH OF THE MANAGED FUTURES INDUSTRY
- 8. Managed Futures 8 As the name suggests, managed futures refers to the active trading of futures and forward contracts on financial and commodity markets. Futures contracts are a form of derivative product, that simply derive their value from an underlying asset. This could be something tangible such as a ton of cocoa or a bushel of wheat, or another financial point of reference, such as an equity index (e.g. S&P 500) or bonds and interest rates. Futures transactions are regulated and the process is governed by an exchange, many of whom operate their own clearing houses guaranteeing the legal fulfilment of the futures contract. This reduces the risk that one of the parties fails to honour the terms of the contract, known as counterparty risk. Each counterparty is required to post collateral (in the form of a margin3 ) against the positions being traded. It is for this reason that managed futures can gain access to a broad exposure of instruments at a fraction (margin) of their notional value. A number of CTAs, (typically those with a currency strategy), can also trade forward contracts, historically in currency markets, but more recently in non-traditional markets, in order to gain access to the additional liquidity which exists in these markets. These are closely related to futures contracts, except that rather than being exchange-traded4 , they are agreements between two counterparties directly, and as a result do not have to follow a standardised format as they would do on an exchange. The level of margin that a trader has to pay to access a forward contract is set out in an ISDA Master Agreement5 . WHAT DO MANAGED FUTURES TRADE? 3 The exchange margin requirement does not change based on the risk of the counterparty – it is predefined per contract. The margin that may be required by a clearing broker however may be adjusted to take the counterparty’s risk into account. 4 They are therefore said to take place ‘over-the-counter’ (OTC). 5 This is the standard document that is commonly used to govern over-the-counter derivatives transactions. The agreement, published by the International Swaps and Derivatives Association (ISDA), outlines the standard terms to be applied to a derivatives transaction between two parties.
- 9. RIDING THE WAVE 9 6 A fund of one is an investment structure in which the investor is the sole investor in a specific vehicle or fund. The significant majority of the CTA programs in existence today are systematic and quantitative in nature; using mathematical models and computational power to guide their trading decisions. There are a few discretionary CTAs, though these still make substantial use of quantitative analysis in their decision making process. Quantitative investing and associated techniques are often confused by the popular description, trading with a “black-box” which by description suggests that you don’t know what’s inside the box and don’t know how it works. This moniker could not be further from the truth as these strategies were never a “black box” in the first place. Each managed futures strategy has been designed by at least one person, and includes an economic rationale for why this strategy should work. For example, a number of research papers have shown that market inefficiencies exist and this, among other reasons, can contribute to market trends. In order to identify the existence of these trends, models are designed to generate particular trading signals. These models are statistically tested and, once their profitability has been established with a satisfying significance, implemented through a systematic model. The designers of these models have carefully decided what should act as a signal, how these signals should be interpreted, and then how to act upon them. The individuals who have designed the investment process of the CTA can therefore very clearly explain the output of the models. They can describe how each signal was interpreted, they can explain why each decision was made, and how taking this decision has affected the performance of the portfolio. Making informed trading decisions is a complex process. In a world with an increasing wealth of information available to everyone, the more pressing issue is deciding what is relevant and what should be ignored. Managed futures funds are designed to do exactly that. Only by filtering and then understanding the information before them can CTAs begin to infer how markets will behave and profit from it. Although the majority of CTAs are set up to do this in an automated fashion, each CTA will still need guidance over how to determine and then act in the case of a definitive signal. Consequently, all aspects of the CTA, while automated, are designed by people who oversee the trading process, much like with commercial flight and the use of auto-pilot. Despite the advances of technology in this area, even the most advanced plane will still need a pilot to program the co-ordinates to facilitate flight and if needs be, supervise the operation of the flight. CTA managers have long been renowned for providing transparency, having been among the first managers to provide segregated individual managed accounts or fund of one arrangements6 . These structures provide greatly enhanced transparency with investors being able to view the fund’s underlying positions and risk on a daily basis. Contrary to popular belief, as long as it is not detrimental to the long-term performance of the managed futures strategy, CTAs are more willing than ever to provide among the highest levels of transparency to their investors. This enhances the ability of the investor to understand exactly how the fund’s returns are being generated and the risk being taken to produce these returns. WHO MAKES THE DECISIONS?
- 10. 10 Managed Futures What does a CTA do? Due to their quantitative nature, CTAs have invested heavily in research and technology, and substantial parts of these firms are typically dedicated to those two areas. Before any CTA comes to market, they will generally have spent years researching, designing, and developing their models. Every trading decision made by a CTA (whether driven by an automated and systematic process, or the analysis of a human) takes the form of four conceptually simple steps. 1) Collate the necessary information needed to make a decision. For most CTAs this is not a trivial task, and involves gathering and cleaning substantial amounts of market data. This data is used in a number of ways from being an input into the alpha model used to evaluate the risk of strategies or markets, and/or to develop detailed transaction cost models. 2) Process that information, through the use of sophisticated algorithms in order to identify which markets currently present opportunities, in which direction (long or short), and in what size (i.e. strength of signal). 3) Construct a portfolio, where the output of the model for each market is combined with information from risk and transaction cost models, to create an optimal portfolio. 4) Execute the trades which need to be processed by the CTA’s execution models, which represents the difference between the optimal portfolio and the current portfolio. HOW DO MANAGED FUTURES TRADE?
- 11. RIDING THE WAVE 11 Figure (2) Managed futures industry AUM breakdown by strategy Markets exhibit a number of inefficiencies, resulting in trading opportunities. These inefficiencies, in addition to the broad array of different futures markets means that the range of investment sub-strategies within the managed futures universe is very broad. Common managed futures sub-strategies include momentum (trend following), mean reversion, relative value, carry trading, or any combination of the above. Some managed futures strategies may focus solely on particular markets, such as commodities or currencies, while others may look to target shorter time-frame investments (typically with average holding periods of less than 10 days). Figure (2) provides an overview of the more popular types of investment strategies and their percentage of the overall market share within the managed futures universe since 2000. DIVERSITY OF MANAGED FUTURES Source: Societe Generale, AIMA Research ProportionofindustryAUM 100% 90% 80% 70% 60% 50% 40% 30% 20% 10% 0% 2000 2001 2002 2003 2004 2005 2006 2007 2008 2009 2010 2011 2012 2013 2014 2015 2016 Trend Following Quantitative Macro Short-Term Commodity Currencies Diversified Technical
- 12. 12 Systematic trend-following Historically the universe of managed futures strategies has been dominated by trend-following and indeed this strategy still represents the absolute majority across this increasingly diverse universe accounting for over half of its total AUM. In recent years, investors have become increasingly curious about managed futures, particularly given their ability to outperform equity indices as well as a number of other investment strategies, which endured heavy losses throughout the global financial crisis and its aftermath. Consequently, the universe branched into a myriad of other strategies and techniques. Notably, fundamentally driven quantitative global macro strategies now account for in excess of 25% of the total universe of strategies and are now second only in size to trend following strategies within the managed futures industry. Trend-following and momentum strategies have been widely commented on. The basic philosophy behind this strategy is that financial markets exhibit trending inefficiencies (momentum), and that said behaviour can be captured to provide absolute returns to investors. Pursuing a trend-following strategy involves buying into markets that have risen, and are expected to continue to increase in value; whilst shorting those that have fallen, and are expected to continue to fall. Whilst the risk-adjusted returns for this type of strategy for a single market in isolation may be relatively low, diversification across a large number of uncorrelated markets helps the trend-following programs greatly improve their profitability and performance. A trend-follower’s automated models screen a variety of markets using a series of technical factors to determine the existence of a market trend across different time- frames. This trading strategy is based on a particular inference of projected market movements and tend to incorporate backwards looking (technical) data such as an analysis of price or volume within a market in order to make their decisions. As a result, trends of varying time horizons can be identified, ranging from very long-term (multi-year) trends, to medium-term (multi-month), or short-term momentum. There are a variety of ways a trend can be identified, the algorithm of which is the intellectual property of the investment manager. The aim is to profit from these trends with the most prevalent being medium- to long-term trend following. DIVERSITY OF MANAGED FUTURES (CONTINUED) Managed Futures
- 13. RIDING THE WAVE 7 Which include but are not limited to; equity indices, agriculture, commodities, foreign exchange, fixed income and real estate. Riding the wave Much like how a surfer’ studies the waves; for example, knowing which kind of beach you should surf or avoid, before choosing when to paddle out and ride a particular wave; managed futures strategies examine the contours of the wider market in search of profitable opportunities. When a surfer is sitting on the crest of a wave, their intention is to surf it all the way to the shore. In a similar way, if a trend-follower expects that the direction in the market is set to continue, then they will seek to ‘ride the wave’ (or in this case trend) for as long as possible and maximise their gains from the position. The surfer can never be entirely sure when and where that elusive wave may appear from, or whether the coming wave will continue to break, all one can do is maximise the chance of finding it by being ready and alert at all times, and ride as many waves as possible. Too hazardous a wave may prompt the surfer to quit it early. Similarly, a trend-following strategy may close out a position early if the risk-reward ratio is not attractive, as a risk management decision. Further, their approach is to consider how strong a trend signal is (or taken in the context of a surfer – where the wave would most likely be better to surf) and where trends are weaker, CTAs may reduce their exposure or cut their positions to avoid losses. Where the CTA trend follower differs from the surfing analogy described above is that they can be on multiple beaches and ride multiple waves at once, in pursuit of riding as many waves as possible simultaneously. Trend followers like to keep their toes in the water of as many markets as possible, in order to capitalise if and when a good trend appears. There is no one and only perfect way to catch and surf a wave. Some surfers will wait all day looking for that one big wave to ride, while others will look to coast in and out on a number of shorter rides. Similarly trend followers also vary in their investment approach, and most trend followers have a long-term strategy and so trade at a low frequency. For this reason, investors should acknowledge that there may be periods of flat or nominal returns associated with when trends change or cease to move as market regimes shift. CTA positions will then change when new trends materialise. Some have shorter investment time horizons (not to be confused with high frequency trading), or may prefer to stick to certain markets or asset classes7 . Further, just as different beaches and variable weather conditions affect how waves are created, the differences in the underlying assets and market participants mean that markets will trade very differently. Above all though, in order for trend-followers to execute profitable trades they need markets to move in a particular direction. A lack of/absence of market trends is not conducive to trend-following, much the same as how calm waters do not make for great surfing opportunities. 13 DIVERSITY OF MANAGED FUTURES (CONTINUED)
- 14. 14 Performance dispersion across trend following strategies Despite trend followers pursuing similar underlying strategies there can be significant differences in returns, due to a variety of factors and different approaches. Figure (3) highlights the dispersion or spread in returns of only trend followers across the Societe Generale managed futures database. As we can see from the whisker plot8 , there is significant dispersion around the mean with regard to each of the trend following funds that reported to the database. Notably in 2008 and 2014, where the returns for the managed futures industry were strongly positive, there was also a large dispersion. Taking a closer look at the performance of these strategies during the most recent market recession of 2008, notably while equity markets lost in excess of 50% of their market value in comparison trend following strategies were able to out-perform. During 2008 the SG CTA index reported an end of year gain of 13%, with the dispersion of trend following returns being very large: from a maximum return in excess of 50% to a positive minimum performance of 5%. While 2008 and 2014 were success stories for managed futures, conditions in 2015 and 2016 were more challenging with only the top quartile of managers producing positive returns. Indeed, the top quartile of trend following funds have consistently reported positive performance in each of the past 16 years. The recent drawdown across the strategy has not been as severe as in previous historical periods of under- performance, and there have always been positive return outliers. Figure (3) Trend-followers return dispersion by year Source: Societe Generale, AIMA Research Managed Futures DIVERSITY OF MANAGED FUTURES (CONTINUED) 40% (above mean) 30% (above mean) 20% (above mean) 10% (above mean) 0% (mean) -10% (below mean) -20% (below mean) -30% (below mean) 2000 2001 2002 2003 2004 2005 2006 2007 2008 2009 2010 2011 2012 2013 2014 2015 2016 Dispersionaroundthemean 8 A box and whisker plot is a graphic way to display the median, quartiles, and extremes of a data set on a number line to show the distribution of the data. This type of graph is used to show the shape of the distribution, its central value, and its variability. In a box and whisker plot: the ends of the box are the upper and lower quartiles, so the box spans the interquartile range.
- 15. RIDING THE WAVE 15 Given the variety of managed futures strategies, and the dispersion of managed futures fund returns on offer, the difficulties associated with manager selection is a challenge that the industry readily admits to having. For a long time, many investors had little or no exposure to the managed futures universe, and there is clearly still a gap in understanding for some parties to reconcile. Amidst a greater level of interest in these strategies, managers are keen to help investors fully understand the nuance behind some of their trading techniques. The onus is on the CTA manager to be able to communicate effectively to a potential investor base as to how their strategy works and why it may be a worthwhile investment. Even though return streams can indicate how beneficial a particular CTA could be, investors and prospective allocators to managed futures strategies have become more sophisticated. They now like to know what it is that is driving the returns of a managed futures strategy as they seek to construct their portfolio with the same rigour that CTAs adopt when constructing their own. Therefore, when it comes to deciding which, if any, CTA to add to a portfolio, there is no single question to ask. There is no simple approach, and it usually involves a combination of factors. Some investors focus entirely on the quantitative aspects of the CTA and these cannot be ignored. Equally important, however, are the qualitative aspects of an investor’s due diligence such as an understanding of the managed futures strategy and the operational structures that the CTA has in place. Investors should take time to consider these criteria to develop a clearer picture of the inner workings of a CTA before committing to an allocation. The AIMA Due Diligence Questionnaire (DDQ) for the selection of managed futures fund managers and commodity trading advisers9 is a tool to assist investors when considering whether or not to invest. CTA investment programs come in a variety of investment strategies, each with its own peculiarities. This dedicated DDQ contains a list of questions to help investors better understand the trading strategy, including how strategies might be developed, the primary sources of returns, the products and markets traded, and how these products are used within the trading strategy. In addition to this, the DDQ also has questions aimed at having the investor better understand the investment terms, structure, governance, and the effectiveness of the firm’s operations. IMPORTANCE OF MANAGER SELECTION 9 To access this DDQ please go to AIMA’s website at https://www.aima.org/resource/aima-ddq-managed-future-fund-managers-commodity-trading-advisors--cta--revised-april-2011-docx.html
- 16. Managed Futures 16 PERFORMANCE CHARACTERISTICS OF MANAGED FUTURES Performance characteristics of managed futures (a) Managed futures strategies focus on risk Traditional asset managers target a certain level of return and try to minimise the risk that they have to take so that they can expect to achieve this target. The approach of a managed futures strategy is normally to turn the problem on its head. They target a specific level of risk and will maximise their expected return subject to taking this degree of risk. The focus then is on finding whether there are any good risk opportunities to take. In most instances, the size of the position is based on the level of volatility that the market is exhibiting, and how correlated that market is to the others around it. Therefore, the level of risk that the CTA wishes to take can be dialled up or down through the controlled and careful use of leverage depending on the general conditions of the market. It is for this reason that managed futures are well-known for having advanced risk management controls. (b) Managed futures exhibit less volatility than equity markets One of the most common ways to measure volatility is through appraising the standard deviation (or volatility) of the investment returns. Figure (4) below provides a risk comparison of managed futures strategies, global equities, fixed income, a 60/40 diversified portfolio (where 60% of the portfolio is invested in equities and 40% in bonds) and other hedge fund strategies between 2000 to the end of 2016. On average, the annualised volatility of a managed futures strategy tends to exhibit lower levels of risk10 than the risk of an equity market indices. Moreover, if one were to compare managed futures to a traditional diversified portfolio, the managed futures investment is also less risky. As highlighted in the table below, as a group managed futures strategies can be slightly more risky than a typical hedge fund investment. This increased risk is driven by investor preferences to pursue higher returns albeit by having to take on a higher level of risk. Figure (4) ‘Comparison of managed futures’ risk to other asset classes between January 2000 - December 2016 Measures of Risk Managed Futures Hedge Funds Global Equities Global Fixed income 60 / 40 Portfolio Annualised Volatility 8.70% 6.19% 15.47% 5.81% 10.16% Maximum Drawdown -11.63% -21.42% -53.65% -10.08% -36.09% Date of Maximum Drawdown Sep 13 Feb 09 Feb 09 Oct 08 Feb 09 Duration drawdown (months) 42 35 69 23 46 10 Based on monthly return data between January 2000 and December 2016. The following indices were used in the table; Global Equities – MSCI World Total Return, Global Fixed Income – Barclays Global Aggregate, Managed Futures – Societe Generale CTA Index, Hedge Funds – HFRI Fund Weighted, 60 / 40 Portfolio – 60% MSCI World Total Return and 40% Barclays Global Aggregate. Source: Bloomberg, Societe Generale, Hedge Fund Research, AIMA Research
- 17. RIDING THE WAVE 17 (c) Managed future strategies enjoy some of the lowest drawdowns Another way to analyse risk is through measuring the strategy’s drawdown. The drawdown is the peak-to-trough decline in an asset’s value during a specific time period. Understanding the nature of the drawdown helps determine an investment’s financial risk of loss. If an investment is in drawdown, then it is currently at a point below the previous high. The level of drawdown is important because it has implications for investors and the timing of their investment decisions, if an investor redeems during a drawdown that represents a loss from a previous high. The maximum drawdown is a measure of the downside risk of the investment and is the maximum peak to trough loss, before a new peak is attained. Related to maximum drawdown is the drawdown duration which refers to the time spent between the two peaks in the asset value (i.e. the amount of time it takes to go from one peak to another peak, and generate new returns). As per the table above the maximum drawdown of managed futures since 2000 was significantly below that of equities, and other hedge fund strategies. Notably, the largest drawdown for managed futures strategies (which negatively impacted the value of managed futures strategies by nearly 12%) is over four times smaller than the impact of the worst drawdown reported by global equities (where they lost over 50% of their value) and half the maximum drawdown of other hedge fund strategies. Historically, drawdowns reported by many managed futures strategies have been significantly smaller than in most other hedge fund strategies. (d) Managed futures strategies are highly liquid in nature One of the main qualities of managed futures is their widespread use of futures, which are among the most liquid instruments available, very transparent and centrally cleared. For the investor, because CTAs are able to liquidate positions on a daily basis, most managed futures funds offer monthly, weekly, or even daily liquidity. Given this flexibility, CTAs are therefore able to offer crucial liquidity to investors. They were of significant benefit to investors during the credit crisis which saw liquidity dry up in both equity and credit markets. PERFORMANCE CHARACTERISTICS OF MANAGED FUTURES (CONTINUED)
- 18. 18 THE BENEFITS OF ALLOCATING TO MANAGED FUTURES IN AN INVESTMENT PORTFOLIO (a) Managed futures may be able to perform in a variety of economic conditions The level of downside protection for an investor portfolio via an allocation to managed futures is well documented. The best example of this can be found when comparing the performance of managed futures strategies with other asset classes in times of market stress. Times of market crisis for both behavioural and institutional reasons represent times when market participants become synchronised in their actions, and losses can become exaggerated. Through analysing the correlation properties of managed futures strategies versus other asset classes and hedge funds, we are able to examine how CTAs interact with other asset classes. Correlation is a single number that describes the degree of relationship between two variables, specifically the extent to which two or more variables fluctuate together. A positive correlation (and +1 is a perfectly positive correlation) indicates the extent to which those variables increase or decrease in parallel, while a negative correlation (-1 is a perfectly negative correlation) indicates the extent to which one variable increases as the other decreases. Where there is no correlation (i.e. a correlation of zero), both variables are not linked at all. Figure (5) below illustrates the rolling 12-month correlation between the SG Trend Index (an index which comprises managed futures trend following strategies) and the returns of global equities (the MSCI World Index) over the past 17 years (2000- 2016). Figure (5) Managed futures rolling correlation to equity markets Dec00 Jul01 Feb02 Sep02 Apr03 Nov03 Jun04 Jan05 Aug05 Mar06 Oct06 May07 Dec07 Jul08 Feb09 Sep09 Apr10 Nov10 Jun11 Jan12 Aug12 Mar13 Oct13 May14 Dec14 Jul15 Feb16 Sep16 1 0.8 0.6 0.4 0.2 0 -0.2 -0.4 -0.6 -0.8 -1 12MonthRollingCorrelationbetweenSociete GeneraleTrendIndexandMSCIWorld(equities) Source: Bloomberg, Societe Generale, AIMA Research. Managed Futures
- 19. RIDING THE WAVE 19 11 Based on monthly return data between January 2000 and December 2016. The 60/40 portfolio is made up of 60% MSCI World Total Return and 40% Barclays Global Aggregate. This period is recognised for having notable equity market corrections, with significant periods of negative returns for equities. The shaded areas demonstrate times (throughout the 17-year period) where global equity returns over the past 12 months were negative. The relationship between CTAs and equities is not static, with the correlation varying from positive to negative through time. Further, CTA trend-followers have been negatively correlated to equity markets over the course of four equity market corrections since 2000. In other words, when equity markets have been falling in value, typically these trend following managed futures strategies have been behaving in an opposite fashion i.e. with the potential to produce positive returns. CTAs have been able to benefit from having a positive correlation with equity markets when they are rising (and therefore can capture some of the market gain) and having a negative correlation when it is falling (and so can turn the direction into a profit). Having this flexibility, an allocation to a managed futures strategy may act as another form of downside protection to the wider investment portfolio, should financial markets start to lose value. To further emphasise the importance of managed futures correlation properties to markets and the potential benefits in a portfolio context, Figure (6) shows the relationship between the returns of the SG CTA Index and a 60/40 portfolio of global equities and bonds11 . The 60/40 portfolio is a simply diversified portfolio that has a 60% exposure to equity markets and a 40% exposure to bonds. Managed futures are said to provide ‘smile returns’ – in that they are profitable as long as there is direction in the market. Figure (6) Smile returns in managed futures strategies Source: Societe Generale, AIMA Research 0.00% -0.2 correlation during negative quarters + 0.2 correlation during positive quarters QuarterlyReturnofSGCTAIndex THE BENEFITS OF ALLOCATING TO MANAGED FUTURES IN AN INVESTMENT PORTFOLIO (CONTINUED)
- 20. Managed Futures 20 To be precise, they have shown an increased ability to generate positive returns when a traditional financial market portfolio is either falling or rising, i.e. moving in a clear direction. Figure 6 indicates the historical positive correlation to a diversified portfolio of +0.2 when it is increasing and a negative correlation of -0.2 when it is decreasing. A trend line has been added to the graph to demonstrate the reason behind the name for the return profile of managed futures, which resembles a smile. In addition, CTAs trade many financial and commodity markets around the world. By having such a broad diversification, managed futures can simultaneously profit from price changes in stock, bond, currency and money markets, as well as from diverse commodity markets which may have no correlation, or close to zero correlation, to other traditional asset classes over the long-term. (b) Managed futures strategies may provide broad diversification opportunities for investors Hedge funds can play one of two roles in an investor’s portfolio; either as a ‘substitute’ or a ‘diversifier’. The more experienced hedge fund investors are now beginning to understand the level of interaction between investments in a diversified portfolio and look beyond just the return of an individual investment. In a 2015 paper12 published by AIMA, the authors considered the universe of hedge funds alongside some of the more popular traditional asset classes (namely equities and bonds) grouping them by the returns they delivered and their risk characteristics. Arising from this analysis, we consider managed futures/CTA as a growing part of the universe of investment strategies that can play the part of a ‘diversifier’, shown in the Figure (7) above. Figure (7) Substitutes and Diversifiers Substitutes Diversifiers Long short equity/credit Global macro Event driven Managed futures/CTA Fixed income arbitrage Equity market neutral Convertible arbitrage Emerging markets Source: AIMA Research Investors that prioritise diversification in their portfolio appreciate that not all investments will be profitable at the same time and therefore, having a good balance of returns across their portfolio is important. If returns are not generated at the same time by all components of the portfolio, this will result in a smoother returns history over time with less risk. This is achieved by investing into strategies that have a low degree of correlation with one another. Revisiting our correlation analysis of the previous section, the figure (8)13 on the next page provides an overview as to how managed futures have performed versus other traditional asset classes (namely equities and bonds) and other alternative investment strategies (including some of the primary hedge fund strategies, real estate, and private equity). Managed futures have demonstrated a low degree of correlation not only to equities, but to other traditional and alternative asset classes. On this measure, managed futures can be a useful addition to a portfolio of alternatives, providing excellent diversification benefits. THE BENEFITS OF ALLOCATING TO MANAGED FUTURES IN AN INVESTMENT PORTFOLIO (CONTINUED) 12 “Portfolio Transformers. Examining the role of hedge funds as substitutes and diversifiers in an investor portfolio” (AIMA, November 2015) 13 Based on 10 year monthly return data between January 2007 and December 2016. The following indices were used in the table; Global Equities – MSCI World Total Return, Global Fixed Income – Barclays Global Aggregate, Private Equity – S&P Listed Private Equity Total Return, Real Estate – S&P/Case-Shiller 10-City Composite Home Price NSA, Managed Futures – Société Générale CTA Index, Hedge Funds – HFRI Fund Weighted, Hedge Funds: Equity Hedge – HFRI Equity Hedge, Hedge Funds: Event-Driven – HFRI Event-Driven, Hedge Funds: Macro – HFRI Macro, Hedge Funds: Relative Value – HFRI Relative Value.
- 21. RIDING THE WAVE 21 10 Year Correlation Global Equities Global Fixed Income Private Equity Real Estate Managed Futures Hedge Funds Hedge Funds: Equity Hedge Hedge Funds: Event Driven Hedge Funds: Macro Hedge Funds: Relative Value Global Equities 1 0.396 0.899 0.180 -0.060 0.895 0.922 0.860 0.260 0.772 Global Fixed Income 0.396 1 0.306 -0.009 0.164 0.313 0.285 0.210 0.327 0.246 Private Equity 0.899 0.306 1 0.209 -0.131 0.800 0.831 0.803 0.157 0.714 Real Estate 0.180 -0.009 0.209 1 -0.155 0.132 0.139 0.230 -0.187 0.221 Managed Futures -0.060 0.164 -0.131 -0.155 1 0.092 -0.034 -0.088 0.845 -0.103 Hedge Funds 0.895 0.313 0.800 0.132 0.092 1 0.985 0.947 0.464 0.893 Hedge Funds: Equity Hedge 0.922 0.285 0.831 0.139 -0.034 0.985 1 0.944 0.342 0.868 Hedge Funds: Event Driven 0.860 0.210 0.803 0.230 -0.088 0.947 0.944 1 0.255 0.926 Hedge Funds: Macro 0.260 0.327 0.157 -0.187 0.845 0.464 0.342 0.255 1 0.213 Hedge Funds: Relative Value 0.772 0.246 0.714 0.221 -0.103 0.893 0.868 0.926 0.213 1 Figure (8) Analysis of ten year correlation (2006-2016) Source: Bloomberg, Societe Generale, Hedge Fund Research, AIMA Research (c) An allocation to managed futures may enhance the returns of the total portfolio There is a substantial body of research that demonstrates the portfolio benefits that an allocation to managed futures can offer to a wider investment portfolio. For example, John Lintner’s research14 showed that a combined portfolio of stocks (or stocks and bonds) including an allocation to managed futures strategies is substantially less risky at every possible level of expected return than investing in a portfolio of stocks (or stocks and bonds) alone. More recent analysis15 examined the returns of managed futures traders and found evidence that, on average, an allocation to managed futures strategies provide attractive risk-adjusted returns, especially if the performance is measured in the context of a diversified portfolio of stocks and bonds. 14 The potential role of managed commodity-financial futures accounts and/or funds in portfolios of stocks and bonds (1983). 15 Managed Futures and Hedge Fund Investment for downside equity risk protection. Derivatives Quarterly (Fall 1996), Thomas Schneeweis, Richard Spurgin and Mark Potter. Managed Futures and Hedge Funds: A match made in heaven. John Wiley & Sons (2004), Harry M Kat. THE BENEFITS OF ALLOCATING TO MANAGED FUTURES IN AN INVESTMENT PORTFOLIO (CONTINUED)
- 22. Managed Futures 22 Figure 9 below considers the various measures that we have explored to date in this paper, namely risk and correlation, to appraise the role that managed futures may be able to play in a wider investment portfolio. Adding managed futures to a diversified investment portfolio has the result of increasing both the total investment portfolio’s return and reducing its risk, consequently increasing its risk-adjusted return16 . From the table, we can observe this by looking at the risk-adjusted return of the 60/40 portfolio of 0.42. Through diversification of this portfolio and re-weighting the split so that we can allocate 20% to managed futures ([i.e. 80% X 60% equities = 48% equities + 80% x 40% Fixed Income = 32% Fixed Income + 20% Managed futures] , the risk-adjusted returns increases to 0.55 – an increase of nearly one third on the initial risk-adjusted return which was produced without managed futures. Hypothetically, and based on the information provided in the table above, the optimal allocation17 to managed futures within the 60/40 portfolio (above) is 40% of the newly created portfolio. In other words, a 40% allocation to managed futures (as per above this would be achieved by reweighting the portfolio split [60% x 60% equities = 36% equities + 60% x 40% Fixed Income = 24% Fixed Income + 40% managed futures] provides the best return (as denoted by the annualised return) at the lowest risk (as a measure of the strategy’s volatility, maximum drawdown, and duration drawdown). In this case, the risk-adjusted return has gone from an initial result of 0.42 to 0.68, an increase of 62%. An allocation of 40% to managed futures is relatively high and may not be possible for many institutional investors, however within the framework of modern portfolio theory having even a small exposure to managed futures, not only contributes absolute return, but it also adds valuable diversification to a traditional portfolio of stocks, bonds and other asset classes. Figure (9) Benefits of allocating to managed futures in a diversified portfolio Source: Bloomberg, Societe Generale, AIMA Research 16 We use the information ratio as our measure of risk-adjusted return here, calculated as annualised return divided by annualised risk. 17 The goal of investors varies but is typically to maximise the risk-adjusted return of their portfolio subject to achieving a minimum expected return and not taking on more than a pre-determined acceptable level of risk. The weighting of different asset classes in an investor’s portfolio is critical in determining the risk and return profile of the investments and is determined through a variety of numerical methods. THE BENEFITS OF ALLOCATING TO MANAGED FUTURES IN AN INVESTMENT PORTFOLIO (CONTINUED) Performance Appraisal (Jan 2000-Dec 2016) 60 / 40 Portfolio Managed Futures 60 / 40 with 20% Managed Futures 60 / 40 with 40% Managed Futures Annualised Return 4.28% 4.69% 4.52% 4.68% Annualised Volatility 10.16% 8.70% 8.25% 6.91% Maximum Drawdown -36.09% -11.63% -27.92% -19.63% Duration Drawdown (months) 46 42 42 27 Risk Adjusted Return 0.42 0.54 0.55 0.68
- 23. RIDING THE WAVE 23 18 Conventional leverage is accessed by borrowing funds from a third party, on which interest is paid and then using these funds to invest further. Here, as only a margin is posted, the additional exposure is ‘free’. 19 For a more detailed discussion on this point, see AIMA, ‘Made to measure’, 2016. (a) Misconception: CTAs deploy large amounts of leverage Reality: Hedge fund managers, CTAs and other financial institutions may use derivatives (such as futures and other options contracts) to gain exposure (either by going long or short) to an underlying security without borrowing or using explicit leverage. Due to the high degree of liquidity across most global derivatives markets, investors that deploy futures and options as part of their investment strategies only have to put up a small amount of capital to allow them to control a much larger asset size (notional exposure). CTAs do not deploy leverage in the traditional sense of borrowing money to increase an exposure. Applying leverage to a futures instrument is different to that when applied to equities. When applied to futures, investors are offered the possibility of notional exposure, an interest free form of leverage18 . This means that a CTA posts a ‘margin’ (fraction of the position) in order to trade the future. For example, interest rate futures contracts can have very low margins (below 1%) in comparison to the cash requirements for a long position in an exchange traded stock (which can be approx. 50%). For futures portfolios the vast majority of the notional capital is invested in low yield government securities or even cash and is held in a funding account. This low-risk investment is coupled with active risk investments in futures contracts. Each futures contract gives an investor implicit leverage which is different from leverage in traditional investment portfolios. Implicit leverage equals the notional value of the position divided by the initial margin. This implies that the maximum potential profit or loss exposure of a position is greater than the capital at risk. For example, suppose a fund has 5% margin on long oil futures contacts for $100,000. The notional capital exposure in the futures contract is $100,000, but the notional capital at risk (to you the investor) is $5,000. This implies an implicit leverage level of 20. Whilst losses can exceed the margin that is posted, it is highly unlikely; CTAs carefully size their positions and monitor the expected maximum one day movement and potential loss in a futures contract very closely. Given the highly liquid nature of the market, CTAs can close out positions quickly in order to limit their losses. Therefore, the notional values do not paint a fair picture of the true exposure of these strategies19 . Instead the margin-to-equity, which is the ratio of total margin the CTA has posted to their total AUM, is a fairer reflection of their exposure. POPULAR MISCONCEPTIONS ASSOCIATED WITH MANAGED FUTURES INVESTING
- 24. Managed Futures 24 The Societe Generale Trend Indicator in figure (10) is a hypothetical market based portfolio designed to produce a high correlation to trend following managed futures strategies. Since its inception in 2000, it has recorded a correlation to the SG Trend Index of more than 0.7. The trend Indicator is built on a bottom up basis and therefore allows analysis of trend following returns by attributing them to indicative market positions. The chart below shows that on average, around 15% of the Trend Indicator is posted as a margin, as it targets a 15% annualised return volatility. The remainder of the investment is usually held in cash or treasury bills that earn a yield whilst still having the requisite liquidity to cover margin positions that may be called for settlement. It is important for investors to understand the levels of margin posted in the CTAs in which they invest. However, this should not be considered in isolation when deciding where to invest, as the instruments traded, risk management and a variety of other factors will determine the real degree of risk taken by an investor. Figure (10) Historical margin to equity levels Source: Societe Generale Margin to EquityAverage MargintoEquity 25% 20% 15% 10% 5% 0% 2010 2011 2012 2013 2014 2015 2016 POPULAR MISCONCEPTIONS ASSOCIATED WITH MANAGED FUTURES INVESTING (CONTINUED)
- 25. RIDING THE WAVE 25 (b) Misconception: Managed futures strategies are high frequency traders Reality: Given the majority of managed futures strategies are automated and highly dependent on computer programs to guide their investment decisions, these strategies are commonly misrepresented as high frequency strategies. The pertinent point is not necessarily how quickly the trading model can reach a new conclusion about trading within a particular market, or even necessarily how quickly it can execute the trading decision. By this we mean how often the model will adjust a portfolio position, by either buying or selling the futures contract. Whilst there are some managers who rebalance their portfolios on a frequent basis, the additional costs that this brings needs to be outweighed by the benefits of trading. Based on this information, managers will therefore have to decide the optimal timeframe to assess their portfolio position. By studying how long managed futures strategies hold their trading positions for, we can determine whether or not they are high frequency in their nature. Figure (11) below shows the average holding period for the Societe Generale Trend Indicator. As we can observe, on average a typical trend following CTA holds the same position on a single futures contract for on average of approximately 90 days. Whilst there are fluctuations in the average holding period of CTA portfolios, as they are rebalanced over time, they cannot be considered high frequency. Figure (11) Historical average holding period for SG Trend Indicator Source: Societe Generale 2000 2001 2002 2003 2004 2005 2006 2007 2008 2009 2010 2011 2012 2013 2014 2015 2016 160 140 120 100 80 60 40 20 0 AverageHoldingPeriod(Days) POPULAR MISCONCEPTIONS ASSOCIATED WITH MANAGED FUTURES INVESTING (CONTINUED)
- 26. Managed Futures 26 20 See ‘Algorithm Aversion’, Jay Dietvorst, 2016. (c) Misconception: CTAs have grown too large in size limiting their ability to trade effectively Reality: A potential risk that all investment strategies face is that as their assets grow their returns diminish. Increased investor interest in managed futures has attracted significant assets under management, as well as suggestions that some CTAs may have grown too large to execute trades effectively in the markets that they operate in. CTAs have invested a great deal of expense into improving the sophistication and efficiency with which a trading order is processed. This increasingly allows CTAs to leave a smaller market footprint than was previously possible despite increased assets under management, and also to access new markets which were previously not cost-effective. The development of execution algorithms that seek to break large orders into smaller pieces is a key component of this. CTAs that are able to demonstrate advanced execution techniques are therefore in high demand among investors. (d) Misconception: CTAs, just like all quantitive investing are just “black box” investing Reality: Quantitative investing and associated techniques are often confused by the popular description, trading with a ‘black-box’ which by description suggests that you don’t know what’s inside the box and don’t know how it works. This moniker could not be further from the truth as these strategies were never a “black box” in the first place. Each managed futures strategy has been designed by at least one person, and includes an economic rationale for why this strategy should work. Many investors are still to be convinced to trust an automated system which may be susceptible to computer bugs, viruses, connectivity issues, or crowding effect driven by systematic models’ commonality. A huge body of research exists that has produced undeniable evidence that humans have disdain for algorithms. This phenomenon has been dubbed algorithm aversion20 whereby people are averse to algorithmic or computer biased forecasters after seeing them perform, even when they see them outperform a human forecaster. Further, these same people lose confidence more quickly in algorithmic than human forecasters after seeing them make the same mistake. Quantitative investing is not a black box, it’s just investing systematically. For proponents of quantitative and systematic investing, including some managed futures strategies, the challenge remains to demonstrate unequivocally that adopting a systematic investment approach is the best course of action when making investment decisions. POPULAR MISCONCEPTIONS ASSOCIATED WITH MANAGED FUTURES INVESTING (CONTINUED)
- 27. RIDING THE WAVE 27 POPULAR MISCONCEPTIONS ASSOCIATED WITH MANAGED FUTURES INVESTING (CONTINUED) (e) Misconception: CTA investing can be timed over the short term. Reality: Although managed futures strategies have the potential to be highly diversifying and can generate positive returns, trend-following CTAs need trending markets to profit. Consequently these strategies are susceptible to underperform in flat trendless markets, or range-bound sideways markets where the strategy is “whipsawed”, incurring losses as a sharp reversal occurs in the opposite direction of a previous short-lived movement. The return streams of CTAs can therefore be ‘lumpy’ in nature. This means that strong periods of performance may occur in bunches, one after another, before a period of more sedate performance. Investors may therefore make highly unprofitable decisions by deciding to ‘chase’ the CTAs that are performing well each year and continually miss out on the strong returns when they arise. Even though most CTAs will typically adopt very liquid structures, allowing their investors the ability to redeem their capital at comparatively short notice, investors will only realise the full benefit of an allocation to the sector over the longer-term. Suffice it to say that as investors have become more knowledgeable about managed futures and have become more familiar with the various investment sub-strategies that underpin this universe, they now have a better understanding of the long-term investment horizon that ought to be considered when making an investment.
- 28. Managed Futures 28 CTAs are regulated entities Managers of managed futures strategies typically operate as regulated entities or must qualify for an applicable exemption. An intermediary acting on behalf of another person in connection with US futures, swaps, or options trading is required to register with the US Commodity Futures Trading Commission (CFTC), as a Commodity Trading Advisor21 (CTA) advising others, or Commodity Pool Operator (CPO) operating/managing a fund. In Canada, provincial regulators provide the regulatory frameworks. The Ontario Securities Commission (OSC) requires managed futures managers to register as a Commodity Trading Manager, whereas in Quebec, the ’Autorité des Marchés Financiers requires managers to abide by the Derivatives Act. In Europe and Asia, managed futures are regulated under the same framework as hedge funds. For example, in Europe, CTAs are required to be regulated entities of one of three types: (i) an Alternative Investment Fund Manager (AIFM) under the Alternative Investment Fund Managers Directive (AIFMD), (ii) a UCITS management company under the Undertakings for Collective Investment in Transferable Securities (UCITS) Directive or (iii) an investment firm under The Markets in Financial Instruments Directive 2004/39/EC (MiFID), depending on the fund and the structure of the management arrangements. Methods of access The most common method of access for those that deem managed futures appropriate for their portfolio, is to make an investment directly into a co-mingled fund. The familiar onshore and offshore fund routes are well established, as well as the growing universe of UCITS and US mutual funds. [A substantial portion of the assets in managed futures is in managed accounts] Depending on the size of allocation and the investors’ expectation for greater information on the underlying positions traded in a managed futures strategy, managed accounts can be an interesting option. Firstly they provide a great deal of transparency and power to their investors. Arguably of most importance, clients remain the owner of their account. Platform managed accounts that act like a “fund of one”, could also be an easy method of access to the sector. Having direct access to managed futures strategies may only be worthwhile with a certain level of assets. In order to simplify the manager selection process there are a number of specialist fund of funds, who carry out due diligence on behalf of an investor. These specialist CTA fund of fund managers often operate via managed accounts, and have a long track record in the industry. They are experienced enough to know the pertinent questions to ask. Furthermore, they provide access to a pool of CTAs which increases the diversification benefits, and can provide innovative customised solutions for allocators. Finally, there are a number of consultants in the sector who provide advice over which managed futures funds are currently open to investment and of interest to a potential investor. ACCESSING MANAGED FUTURES 21 For this purpose, we refer to the Commodity Trading Advisor as defined in the US by the Commodity Exchange Act. Elsewhere in the paper, reference to the CTA is as per the more generic term used for managers of managed futures funds as discussed at the beginning of this paper.
- 29. RIDING THE WAVE KEY TAKEAWAYS 1. Managed futures strategies have demonstrated strong performance over long-term horizons, especially in comparison to traditional equity and bond markets. There have also been consistent asset flows into CTAs, particularly in recent history. As a result, the sector has grown significantly, increasing by more than nine fold since 2000. 2. As a group, managed futures strategies are less risky (as measured by standard deviation) than a typical investment into equity markets. However, they can exhibit long (but relatively shallow) drawdowns as their returns can be ‘lumpy’. Investors therefore have to be patient and allocate across long-term horizons in order to feel the true benefit from the asset class. 3. Historically, managed futures are uncorrelated to both traditional and alternative assets. In particular, trend followers are able to switch between positive correlation in a rising market and negative correlation when markets are falling. Therefore, as long as there is direction in the movements of the market, they can be highly profitable. Consequently, an allocation to managed futures can significantly improve the risk-adjusted returns of most diversified portfolios. 4. Managed futures strategies invest primarily into derivatives (futures and forwards markets). With derivatives, transactions take place between two parties and so one party’s gain is the loss for the other. Trading in derivatives also means that the approach to leverage is very different to that in equity markets. Managers will have a significant majority of their fund in very liquid investments such as Treasury Bills, as they only need to post a ‘margin’ (fraction of the position) in order to trade the futures contract. Investors therefore need to understand that the common measure of notional value does not paint a fair picture of the true exposure of the fund, which is carefully constructed and controlled. 5. Although managed futures strategies are guided by their models, these are designed by investment professionals who can clearly explain and monitor closely the trading decisions that are made. The use of financial models means that trades are predominantly automated and decisions are made by following rules and signals from their datasets. Adhering to such a system of trading is a useful method of avoiding a number of the common behavioural biases that can affect discretionary traders. 6. The most common trading strategy across the managed futures universe is trend following (buying into rising markets and shorting falling markets), yet almost half of the industry operates in strategies other than trend following. Given the diverse choice of strategies, exchanges, execution techniques and risk control measures, no two managed futures are identical. 29
- 30. Managed Futures 30 AIMA, the Alternative Investment Management Association, is the global representative of the alternative investment industry, with more than 1,800 corporate members in over 50 countries. AIMA’s fund manager members collectively manage more than $1.8 trillion in assets. AIMA draws upon the expertise and diversity of its membership to provide leadership in industry initiatives such as advocacy, policy and regulatory engagement, educational programmes and sound practice guides. AIMA works to raise media and public awareness of the value of the industry. AIMA set up the Alternative Credit Council (ACC) to help firms focused in the private credit and direct lending space. The ACC currently represents over 80 members that manage $300 billion of private credit assets globally. AIMA is committed to developing skills and education standards and is a co-founder of the Chartered Alternative Investment Analyst designation (CAIA) – the first and only specialised educational standard for alternative investment specialists. AIMA is governed by its Council (Board of Directors). For further information, please visit AIMA’s website, www.aima.org. Societe Generale Prime Services part of the Global Markets’ division of Societe Generale Corporate & Investment Banking is the bank’s Prime Brokerage business, offering a unique combination of execution, clearing, custody and financing services. It is truly multi- asset and multi-instrument across Listed Derivatives, Equities (Cash/synthetic), FX, Fixed Income and OTC Cleared. As the world’s leading derivatives broker, the Prime Services business offers unrivalled access to 130+ markets and exchange venues; offering both agency or principal execution, and extensive value added services. The full service platform offers access to significant securities financing capabilities, extensive capital introduction and best-in-class cross-margin capabilities as well as straight-through-processing with an industry leading post-trade platform aligned with Societe Generale extensive research product. https://cib.societegenerale.com/en/our-offering/ global-markets/prime-services/ About AIMA Societe Generale Prime Services
- 32. Managed Futures 32 AIMA | Alternative Investment Management Association www.aima.org