The document summarizes key details about the London 2012 Olympics, including:
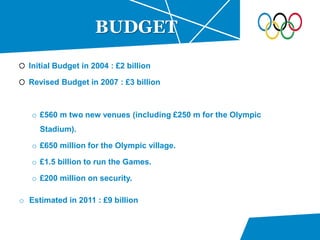
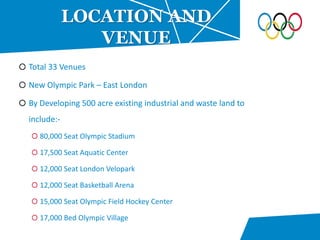
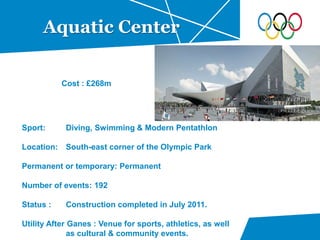
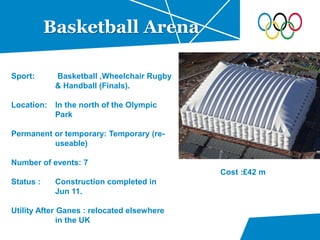
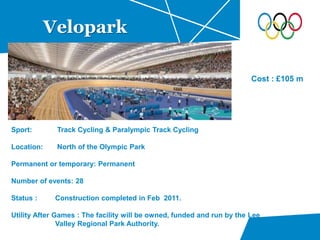
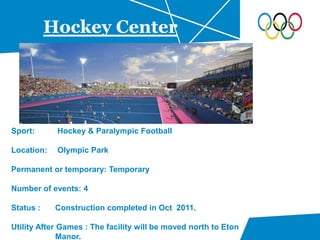
- Overview of the 2012 Games plan including venues, transportation, and a £9 billion budget.
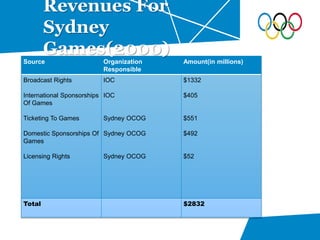
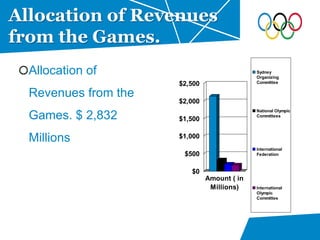
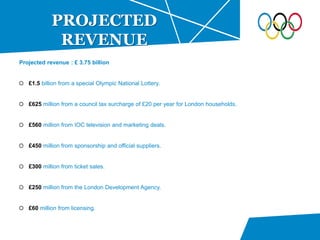
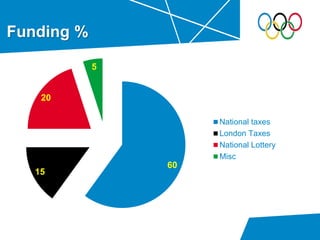
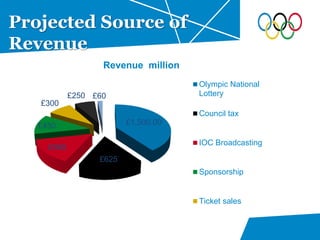
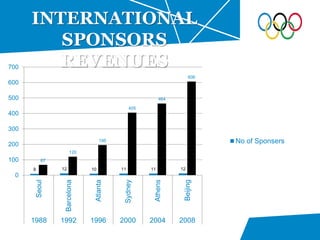
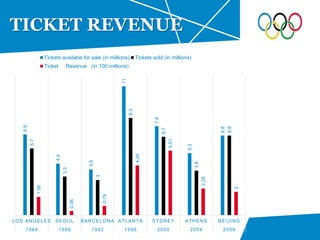
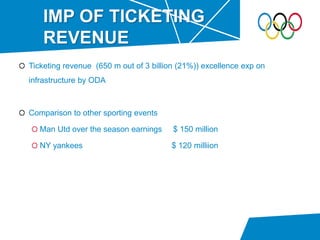
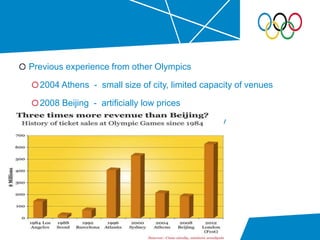
- Description of the main revenue sources like the National Lottery, council taxes, and IOC deals that were projected to generate £3.75 billion total.
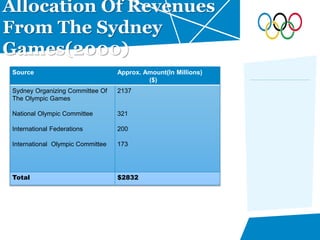
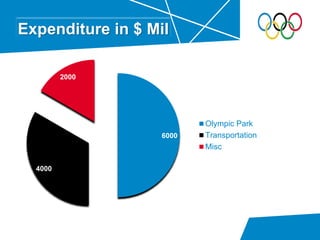
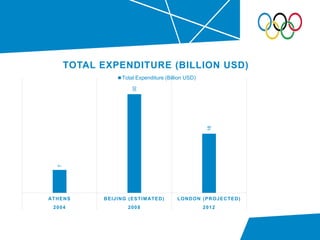
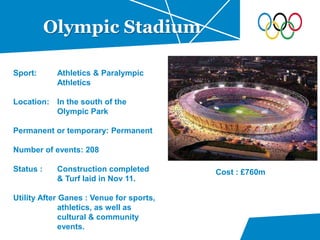
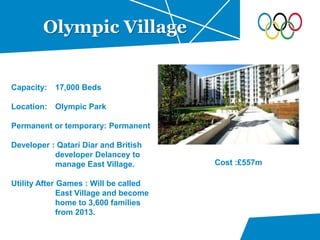
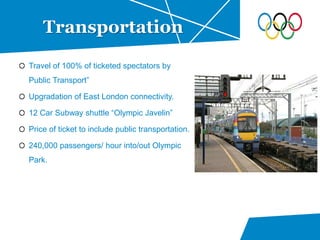
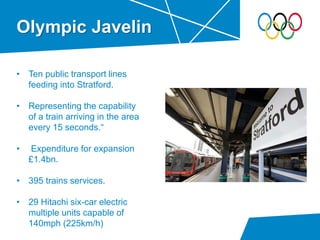
- Breakdown of expenditures on the Olympic Park, transportation infrastructure, and other areas that totaled £9 billion.