Recommended

Recommended
More Related Content
What's hot
What's hot (18)
Viewers also liked
Viewers also liked (10)
Similar to USRTP Poster
Similar to USRTP Poster (16)
USRTP Poster
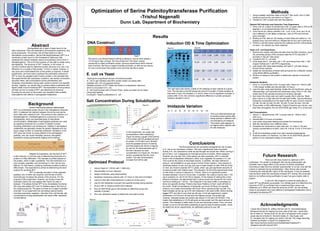
- 1. Optimization of Serine Palmitoyltransferase Purification -Trishul Nagenalli Dunn Lab, Department of Biochemistry n Background Abstract Background Results Methods Conclusions Future Research Acknowledgments Serine Palmitoyltransferase (abbreviated SPT) is a membrane protein found in the endoplasmic reticulum (ER). It catalyzes the reaction between the amino acid serine and a fatty acid, palmitoyl CoA. The product of this reaction is 3- ketosphinganine. 3-ketosphinganine is a precursor to many sphingolipids, which are essential lipids in intercellular communication. Metabolites of sphingolipid synthesis are used as signaling molecules for a number of cellular function including proliferation and senescence. Defects in sphingolipid metabolism are generally caused by genetic diseases and can have a large number of unwanted symptoms. Mutations in the SPT gene are known to cause defects in the sphingolipid pathway, and can cause hereditary sensory neuropathy. Symptoms include permanently tingling nerve endings. Despite its importance, the structure of SPT is still unknown. A common way of determining structures of a protein is X-Ray diffraction. This requires a purified sample of the protein, which is later crystallized. The cell membrane is a very complex organelle, and mimicking it in vitro can be very difficult. For that reason, purifying membrane proteins is also a difficult task. This experiment is aimed at determining the best protocol for purifying SPT. SPT is naturally encoded in three separate peptides, two of which are required, and the last of which tremendously increases the activity of the enzyme. For the purpose of this experiment, however, we chose to fuse the individual chains into one peptide with Factor Xa sites in between. This allows formed SPT to be immediately functional. We have also added GST and 10 Histidine tags to the front of the coding sequence. The gene is driven by a copper-inducible promoter. In our experiment we are testing various factors including expression organism, induction time, cell density, salt concentrations during solubilization and wash buffer imidazole concentrations. Induction OD & Time Optimization Time 1 2 3 4 5 2:00 1.73 2.48 2.89 3.13 3.10 12:30 1.25 1.95 2.29 2.66 2.79 11:00 .80 1.39 1.73 2.09 2.17 9:30 .38 .69 .88 1.09 1.16 E. coli vs Yeast Imidazole Variation M S 20 30 40 50 60 70 80 100 There are still many factors to optimize in SPT purification. The protein to detergent ratio during solubulization will probably have a large effect on the amount of protein solubilized. According to data found by another experimenter in our lab, only half the protein is collected during solubulization. Other factors also include mimicking the hydrophobic nature of the membrane. It may be possible that the lipids inside the membrane increase SPT activity. We could add lipids to our buffers during purification to see if we get a higher yield of protein. In the end, this research is aimed at being able to purify SPT as efficiently as possible. Our ultimate goal is to determine the structure of SPT by purifying it into a crystal and then using x-ray diffraction on it. When we know the structure of SPT, we can develop drugs to aid patients who have defects in sphingolipid metabolism due to improperly functioning SPT. The right hand side shows a table of OD readings of each sample at a given time. The dot-blot on the left shows the amount of protein in these samples at that point in time. For samples 3, 4, and 5, there is not a significant increase in protein after 12:30. Nor is there a significant difference in protein produced between samples 4 and 5. This is an electrophoresis gel of purified protein eluted after being washed in different mM concentrations of imidazole. The protein yield appears to be highest when washed with 50 mM imidazole. Optimized Protocol The first experiment we conducted compared the use of yeast or E. coli as our expression medium. We had a significantly lower enzymatic activity in E. coli compared to what we had thought we should see. When running a gel on the E. coli, it appeared we had high amounts of protein. When assayed, however, we only had 10% of the activity we were expecting. SPT is naturally found in the Endoplasmic Reticulum, which is an organelle not present in E. coli. This could be the cause of decreased activity. In addition, the best method for lysing E. coli available to us was using a French Press machine. This machine is extremely tedious to use, and can only lyse a small sample of cells. With all of this in mind, we chose to express SPT in yeast, which can give significant amounts of functional protein with relative ease. The induction OD and time experiments show us that when a culture is induced at 1 OD/mL, there is no significant protein increase between 3 and 4.5 hours later. In addition, the culture must be near 1 OD (as in samples 3,4, and 5) for this to happen. In the interest of making this a time efficient procedure, we determined that a culture should be induced for four and a half hours starting at 1 OD/mL. The imidazole in the wash buffer is necessary to block non-specific binding. Proteins that have Histidine in them could still bind to the nickel. Small concentrations of imidazole can knock off these non-specific proteins, but a large concentration will knock off our specific protein as well. The data indicates we can go up to 50 mM imidazole in the wash buffer without eluting tagged SPT, and that is now what we will use. In the salt experiment, protein solubilized in 0.5 M and 0 M salt have the highest activity. The protein gel, however, indicates double the protein was eluted in 0 M and 0.25 M NaCl. This means that solubilizing in 0.5 M salt gives us less protein and the same amount of activity. This indicates a better yield of pure and functional protein. Thus, we have chosen to use 0.5 M salt while solubilizing to get the bets functional protein. Given the data from all our experiments, an optimized protocol to your left. Salt Concentration During Solubilization 0 0.05 0.1 0.15 0.2 0.25 9 14 19 24 29 34 39 mMCoA Assay Time (minutes) 7/31 Elution Data Series1 Series2 Series3 Series4 Series5 Series6 Elution 1 Elution 2 Elution 3 Elution 4 Elution 5 Elution 6 •Yeast gives a significant amount of functional protein. •E. coli on gel indicates near 80% protein eluted, but assay data indicates only 10% of expected activity. •Multiple subunits of SPT folded and joined in endoplasmic reticulum, which is not present in E. coli. •E. coli must be lysed with a French Press, where as yeast can be lysed using bead beating Conclusion: Yeast is preferable to E. coli. I would like to thank Dr. Jeffrey Harmon and Dr. Somashekarappa Niranjana Kumari for helping me every step of the way. I would also like to thank Dr. Teresa Dunn for her aid in all aspects of the project. I would also lie to thank Dr. Kenneth Gable, Dr. Sita Gupta, and Dr. Gongshe Han for helping me while in the lab. The image depicting histidine purification in figure 8 is adapted from http://www.biochem.arizona.edu/miesfeld/teaching/Bioc471- 2/pages/Lecture5/Lecture5.html Sphingolipids are a class of lipids found in the cells membrane. They are essential to all eukaryotic organisms, and some prokaryotic. The primary role of these lipids is to aid in intercellular communication. Serine Palmitoyltransferase (SPT) is a membrane protein found in the Endoplasmic Reticulum that catalyzes the reaction between serine and palmitoyl CoA to form 3- ketosphinganine. This is the first reaction on the path to create many sphingolipids. The structure of SPT, however, is not known. A common method used to determine protein structure is to use x-ray diffraction on a crystal of that protein. To form a crystal, however, a very pure and concentrated form of the protein is required. In these experiments, we have tried to optimize the purification protocol for SPT to have the greatest yield of active protein in the shortest time. We experimented with expression mediums, cell density at induction, induction times, salt concentration during solubilization and imidazole concentrations during wash cycles to prevent non-specific binding. Together, our results help us achieve faster purification with higher yields of pure functional SPT. The implications of this protocol will help us form a crystal of SPT, and determine its structure. Knowing the structure of this protein can hopefully help us better treat patients with defects in sphingolipid metabolism. DNA Construct We want to use Nickel-Histidine affinity purification, and we have added a 10-His tag to help us there. We have fused the LCB 2a3a1 coding sequences to make purification easier; previous experiments show minimal loss of activity. We have a copper inducible promoter, so that we can induce for only a short time if the protein turns out to be harmful to yeast. 1. Induce Yeast at 1 OD/mL with 1 mMCuSO4. 2. Harvest after 4.5 hour induction. 3. Isolate membrane using bead beating. 4. Solubilize membrane proteins with 1% Triton X-100 and 0.5 M NaCl 5. Leave to bind with nickel beads for a minimum of two hours. 6. Use 50 mM imidazole to prevent non-specific binding during washes. 7. Elute 5 250 uL fractions in500 mM Imidazole. 8. Run an SDS-PAGE gel on the samples to determine purity and quantity of protein. 9. Run non-radioactive assay to determine enzymatic activity. 1. Using available restriction sites on the pET 28a vector, form a DNA construct such as the one show in in Figure 1. 2. Transform LCB1 Δ yeast cells with this plasmid. Optimal OD Induction and Induction Time Experiment: 1. Grow a 50 mL culture of transformed LCB 1 Δ yeast cells in YPD at 26 degrees C to an Optical Density (OD) of 0.85 OD/mL. 2. From the 50 mL culture, transfer 2 mL, 4 mL, 6 mL, 8 ml, and 10 mL into 5 different 4-Liter flasks containing 1 liter of YPD and let them grow overnight. 3. Starting at 9:30, take an OD reading of each flask and collect a 1 mL sample every one and half hour. Repeat this for four and a half hours. 4. Perform a dot blot assay using the His antibody and the LCB antibody on each 1 mL sample you have collected. Yeast vs E. coli Experiment: 1. Remove the copper-inducible promoter from the DNA construct. Insert the remaining portion of the construct after the IPTG inducible T7 promoter in the pET 28a vector. 2. Transform AG1 E. coli cells. 3. Grow yeast and E. coli cells until 1 OD, and induce them with 1 mM Copper Sulfate and 1 mM IPTG respectively. 4. Lyse yeast cells using bead beating, and lyse E. coli cells using a French Press machine. 5. Isolate the membranes of these cells and purify the LCB2a3a1 protein using Nickel affinity purification. 6. Perform an assay on the protein to determine quantity of functional protein. Imidazole Variation: 1. Grow 1L of transformed LCB 1 Δ yeast cells. Induce at 1 OD/mL with 1 mM Copper Sulfate and harvest after 4.5 hours. 2. Lyse the cells using bead beating, isolate the cell membrane using an ultracentrifuge, and solubilize the membrane using Triton X-100. Add nickel resin to the sample and leave for binding overnight. 3. Spin down the nickel resin and split it equally into 8 columns. Wash each column in a high salt and low salt wash buffer. Use the following imidazole concentrations in the wash buffer for each of the 8 columns: 20 mM, 30 mM, 40 mM, 50 mM, 60 mM, 70 mM, 80 mM, 100 mM 4. Elute protein in 500 mMImidazole. Collect 6 fractions per column, and pool them all together. Run an SDS-PAGE gel using 10 uL of the pool. Salt Concentration: 1. Induce 1 L oftransformed LCB 1 Δ yeast cells at 1 OD/mL with 1 mM CuSO4. 2. Harvest after 4.5 hours of induction 3. Lyse yeast using bead beating and isolate the membranes 4. Split the membrane into 5 different tubes 5. Solubilize the membrane in each tube with 1% Triton X-100 and varying concentrations of NaCl. Use 0 M, 0.25 M, 0.5 M, 0.75 M and 1 M. 6. Purify the solubilized protein from each sample independently. 7. Elute the protein in 5 fractions, run them on an SDS-PAGE gel and perform a non-radioactive assay on the protein. Figure 1 Figure 2a Figure 2b Figure 4 Figure 5a Figure 5b Figure 6 Figure 7 Figure 8 0 0.2 0.4 0.6 0.8 1 1.2 1.4 1.6 0 2 4 6 8 10nmolCoAgeneratedbySPT Time (min) 0 M y=0.15 .25 M y=.14 .5 M y=.16 .75 M y=.09 1 M y=.07 -0.01 0 0.01 0.02 0.03 0.04 0.05 0 2 4 6 8 10 0M NaCl Basline Elution 3 Elution 4 Elution 5 Linear (Elution 3) Linear (Elution 4) Linear (Elution 5) -0.02 -0.01 0 0.01 0.02 0.03 0.04 0.05 0 2 4 6 8 10 -CoA .5M .5M NaCl Baseline 3 Elution 4 Elution 5 Elution Linear (3 Elution ) In this experiment, we varied salt concentrations while solubilizing. Figure 3b shows a graph of the activity in the elution with the greatest amount of protein. 0.5 M NaCl and 0 M NaCl have the greatest amount of activity, and their graphs are shown in figures 3c and 3d. An electrophoresis gel of the first 3 elutions for each concentration is in figure 3a. The third elution consistently has the most protein. The salt concentrations increase from left to right. Figure 3a Figure 3b Figure 3c Figure 3d