1. Nodes contain 2 or 4 operating detectors.
The background radiation oscillates throughout the day.
o One possible explanation for this variance could be the change in
temperature throughout the day.
Seasonal changes as well as precipitation can have an effect on the
background radiation.
Due to these physical effects, the variance is much larger than the actual
statistical (Poisson) noise present in the background measurements.
The constant backgrounds in the figures are likely due to infrequent
background measurements. This might be attributed to heavy traffic
causing a detector to use the same measurement for an extended time
period.
Analysis of Background Gamma-Radiation Amplitude
Variation at U.S. Ports of Entry
Intern: Mentor:
Thomas Freeman | CSU East Bay 2017 | Computer Science Isaac Shokair | R&D S&E | Nuclear Engineering
Summer 2014
Abstract: The Technical Reachback (TRB) program at Sandia National Laboratories is sponsored by the Domestic Nuclear Detection Office (DNDO) of the
Department of Homeland Security. This project analyzes data and builds tools to enhance the capability for interdiction of illicit nuclear material at U.S. border
crossings . In order to produce the most effective tools, a good baseline analysis of background radiation must be established for each port of entry (POE). This
analysis shows that significant variation can occur between different ports of entry, as well as in the individual radiation detectors at a single Port of Entry.
Sandia National Laboratories is a multi-program laboratory managed and operated by Sandia Corporation, a wholly owned subsidiary of Lockheed Martin Corporation,
for the U.S. Department of Energy’s National Nuclear Security Administration under contract DE-AC04-94AL85000.
SAND2014-15860D
Data Analysis of Port Of Entry Database: Sandia Laboratories maintains a database containing background gamma-ray measurements from various ports of entry
in the U.S. Characterization of this background data allows for better development of alarm thresholds, detection algorithms, and easier identification of false
positives. Additionally, the analysis helps understand environmental impacts on detectors and whether or not a particular radiation portal is malfunctioning. The
figures below are samples that display the background gamma-radiation vs. time.
Lane: A
A
B
C
D
E
F
G
H
I
n mean sdev median
168643 3837 165.7 3844
n mean sdev median
12621 3798 159.3 3813
A
B
C
D
E
F
G
H
I
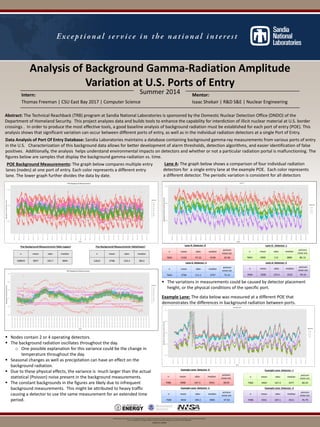
The variations in measurements could be caused by detector placement
height, or the physical conditions of the specific port.
Example Lane: The data below was measured at a different POE that
demonstrates the differences in background radiation between ports.
n mean sdev median
poisson
noise est.
7664 4156 97.22 4158 62.96
n mean sdev median
poisson
noise est.
7664 3900 113 3896 80.12
n mean sdev median
poisson
noise est.
7663 3796 111.1 3797 72.31
n mean sdev median
poisson
noise est.
7664 3508 133.4 3525 94.32
n mean sdev median
poisson
noise est.
7486 3988 167.3 3952 38.69
n mean sdev median
poisson
noise est.
7460 3404 167.4 3377 68.24
n mean sdev median
poisson
noise est.
7509 3944 199.2 3905 47.92
n mean sdev median
poisson
noise est.
7498 3551 207.1 3521 76.79
Example Lane
Poe Background Measurements Table (upper) Lane A: Detector: 0 Lane A: Detector: 1
Lane A: Detector: 2 Lane A: Detector: 3
Example Lane: Detector: 0 Example Lane: Detector: 1
Example Lane: Detector: 2 Example Lane: Detector: 3
Poe Background Measurements Table(lower)
Lane A: The graph below shows a comparison of four individual radiation
detectors for a single entry lane at the example POE. Each color represents
a different detector. The periodic variation is consistent for all detectors
POE Background Measurements: The graph below compares multiple entry
lanes (nodes) at one port of entry. Each color represents a different entry
lane. The lower graph further divides the data by date.
POE Background Measurements
Detector
POE Background Measurements
Detector
Lane ID
Lane ID