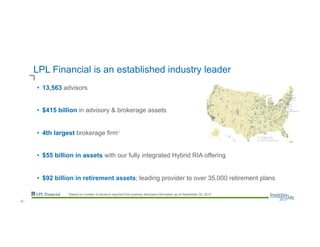
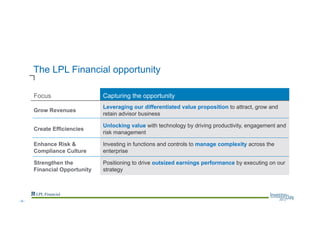
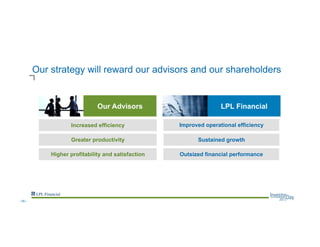
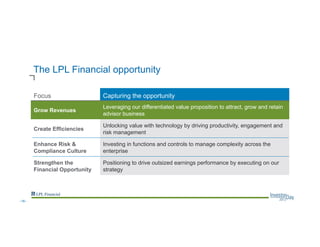
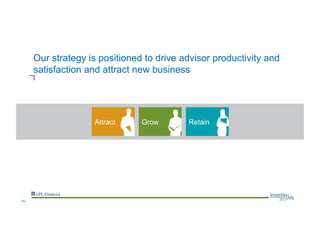
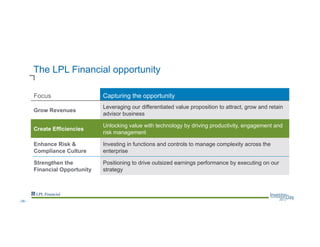
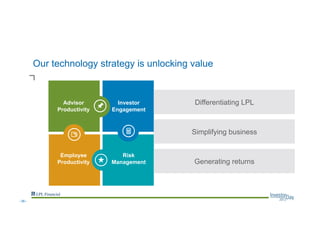
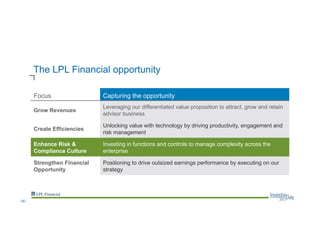
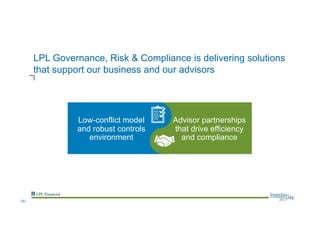
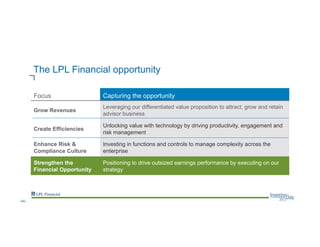
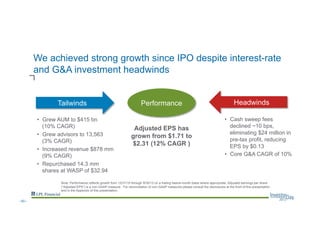
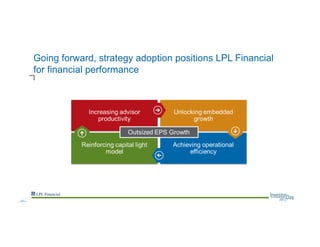
November 12, 2013
Westin Grand Central
New York, NY
Trap Kloman – Senior Vice President | Investor Relations
Safe Harbor Disclosure
Statements in this presentation regarding LPL Financial Holdings Inc.'s (the “Company”) future financial and operating results, plans, strategies, goals, future market position,
ability and plans to repurchase shares and pay dividends in the future, including statements relating to future efficiency gains, scale and projected expenses and savings as a
result of the Service Value Commitment (the “SVC”) or other initiatives, ability and plans to deliver technology functionality, features or upgrades, future growth, market share
and insured cash account portfolio, including the statements on the slides entitled “Shift to advisory creates margin opportunities”, “Normalized interest rates will bring financial
benefits”, “Investment in technology and Service Value Commitment position us for future efficiency”, “Managing growth through smart investment and simplicity and productivity
initiatives”, “Strategy execution drives outsized earnings performance” and “Capital-light model generates significant free cash flow, expanding discretionary capital”, as well as
any other statements that are not related to present facts or current conditions or that are not purely historical, constitute forward-looking statements. These forward-looking
statements are based on the Company's historical performance and its plans, estimates and expectations as of November 12, 2013. Forward-looking statements are not
guarantees that the future results, plans, intentions or expectations expressed or implied by the Company will be achieved. Matters subject to forward-looking statements involve
known and unknown risks and uncertainties, including economic, legislative, regulatory, competitive and other factors, which may cause actual financial or operating results,
levels of activity, or the timing of events, to be materially different than those expressed or implied by forward-looking statements. Important factors that could cause or contribute
to such differences include: finalization and execution of the Company’s plans related to the SVC, including the Company’s ability to successfully transform and transition
business processes to third party service providers; the Company’s success in negotiating and developing commercial arrangements with third party service providers that will
enable the Company to realize the service improvements and efficiencies expected to result from the SVC or other initiatives; the performance of third party service providers to
which business processes are transitioned from the Company; finalization and execution of the Company’s plans related to technology, including the Company’s ability to
successfully integrate technology from third party technology providers; the Company’s success in negotiating and developing commercial arrangements with third party
technology providers that will enable the Company to realize the improvements and efficiencies expected to result from such technology, including with respect to supervision
and oversight of advisor activities; the Company’s ability to control operating risks, information technology systems risks and sourcing risks; changes in general economic and
financial market conditions, including retail investor sentiment; fluctuations in the value of assets under custody; effects of competition in the financial services industry; changes
in the number of the Company's financial advisors and institutions, their ability to market effectively financial products and services, and the success of the Company’s initiatives
designed to engage them; changes in interest rates and fees payable by banks participating in the Company's cash sweep program, including the Company's success in
negotiating agreements with current or additional counterparties; the Company's success in integrating the operations of acquired businesses; the effect of current, pending and
future legislation, regulation and regulatory actions, including disciplinary actions imposed by self-regulatory organizations; and the other factors set forth in Part I, “Item 1A. Risk
Factors” in the Company's 2012 Annual Report on Form 10-K as may be amended or updated in our quarterly reports on Form 10-Q. Except as required by law, the Company
specifically disclaims any obligation to update any forward-looking statements as a result of future developments, even if its estimates change, and you should not rely on those
statements as representing the Company's views after November 12, 2013.
Non-GAAP Financial Measures
Adjusted Earnings represent net income before: (a) employee share-based compensation expense, (b) amortization of intangible assets
resulting from various acquisitions, (c) debt extinguishment costs, (d) restructuring and conversion costs, (e) equity issuance and related
offering costs and (f) other. Reconciling items are tax effected using the income tax rates in effect for the applicable period, adjusted for any
potentially non-deductible amounts. Adjusted Earnings per share represents Adjusted Earnings divided by weighted average outstanding
shares on a fully diluted basis. The Company prepares Adjusted Earnings and Adjusted Earnings per share to eliminate the effects of items
that it does not consider indicative of its core operating performance. The Company believes these measures provide investors with greater
transparency by helping illustrate the underlying financial and business trends relating to results of operations and financial condition and
comparability between current and prior periods. Adjusted Earnings and Adjusted Earnings per share are not measures of the Company's
financial performance under GAAP and should not be considered as an alternative to net income or earnings per share or any other
performance measure derived in accordance with GAAP, or as an alternative to cash flows from operating activities as a measure of
profitability or liquidity.
Adjusted EBITDA is defined as EBITDA (net income plus interest expense, income tax expense, depreciation and amortization), further
adjusted to exclude certain non-cash charges and other adjustments set forth in the table above. The Company presents Adjusted EBITDA
because the Company considers it a useful financial metric in assessing the Company's operating performance from period to period by
excluding certain items that the Company believes are not representative of its core business, such as certain material non-cash items and
other adjustments that are outside the control of management. Adjusted EBITDA is not a measure of the Company's financial performance
under GAAP and should not be considered as an alternative to net income or any other performance measure derived in accordance with
GAAP, or as an alternative to cash flows from operating activities as a measure of profitability or liquidity. In addition, Adjusted EBITDA can
differ significantly from company to company depending on long-term strategic decisions regarding capital structure, the tax jurisdictions in
which companies operate and capital investments.
You can find additional related information, including a reconciliation of such non-GAAP measures, in the Investor Relations section of our
website at www.lpl.com.
The LPL Financial Opportunity
Mark Casady – Chairman and CEO
LPL Financial is an established industry leader
•  13,563 advisors
•  $415 billion in advisory & brokerage assets
•  4th largest brokerage firm1
•  $55 billion in assets with our fully integrated Hybrid RIA offering
•  $92 billion in retirement assets; leading provider to over 35,000 retirement plans
1 Based on number of advisors reported from publicly disclosed information as of September 30, 2013
--2--
We serve a fundamental and growing need
Our Mission
We believe that objective financial advice is
a fundamental need for everyone. We
enable our clients to focus on what they do
best—create the personal, long-term
relationships that are the foundation for
turning life’s aspirations into financial
realities.
--3--
Strong performance since IPO
Added 1,119 net new advisors
Initiated retirement plan solution
Accelerated RIA and HNW growth
Launched Service Value Commitment
Established next-generation leadership
team
Business Performance Financial Performance
Note: Based on growth and developments since 12/31/10
Grew AUM by 31%
Increased advisory AUM from 29% to
34% of total AUM
Grew Hybrid RIA assets 293% to $55 bn
Repurchased 14.3 mm shares
Distributed $285 mm in dividends
--4--
The LPL Financial opportunity
Focus Capturing the opportunity
Grow Revenues
Leveraging our differentiated value proposition to attract, grow and
retain advisor business
Create Efficiencies
Unlocking value with technology by driving productivity, engagement and
risk management
Enhance Risk &
Compliance Culture
Investing in functions and controls to manage complexity across the
enterprise
Strengthen the
Financial Opportunity
Positioning to drive outsized earnings performance by executing on our
strategy
--5--
Speaker Topic
Dan Krems, Executive Vice President of
Corporate Strategy
Winning in the Marketplace
Derek Bruton, Managing Director,
Independent Advisor Services
Growing Revenue
Victor Fetter, Chief Information Officer Creating Efficiencies
Michelle Oroschakoff, Chief Risk Officer Enhancing Risk and Compliance Culture
Robert Moore, President
Creating Value for Sponsors: A panel discussion
Bill Glavin, CEO, Oppenheimer Funds
Bob Reynolds, CEO, Putnam Investments
Nick Lane, Senior Executive Director and Head of US Life and
Retirement, AXA Equitable
Dan Arnold, Chief Financial Officer Strengthening the Financial Opportunity
Agenda
--6--
Winning in the Marketplace: Building a Smarter, Simpler,
More Personal LPL
Dan Krems - Executive Vice President, Corporate Strategy
The market for retail advice is large and poised for growth
Source: Cerulli Quantitative Update: Advisor Metrics 2012 Note: 38.6M people between 55-64 years old are projected for year end 2012, 40.8M for 2015,
42.8M for 2020. Peak earner demographics are based on Census forecasts.
Investable assets = $19 trillion U.S. peak earners (age 55-64)
11% growth 2012-2020
--8--
The march toward independence continues
Source: Cerulli Quantitative Update: Intermediary Distribution 2012
LPL share of
Independent: 8%LPL share of
Independent: 5%
~$9T
~$13T
70%
30%
64%
36%
62%
38%
n/a
LPL expanding
market share
--9--
Established scale and scope to drive positioning to win
B/D & RIA Advisors
**LPL Financial is positioned to serve investors whose assets account for 92% of total retail assets. Market data per Cerulli
Quantitative Update: Intermediary Distribution 2012
Retirement
Practitioners
Mass Affluent
High Net Worth
Bank/Credit Union
Increasing scale
Expanding scope
3X +
Growth
By investor By advisor practice
--10--
LPL Financial
We are now building a smarter, simpler, more personal LPL
Focus on our footprint
Capitalize on continuing secular trend toward independent advice with a broad array of advisors
serving the vast majority of investors
Drive to simplicity
Combine technology, automation and process simplification to improve efficiency in our advisors’
businesses and our own
Unlock advisor productivity
Deliver a growing array of support functions and capabilities, enabling advisors to win more business
and enhance client satisfaction
--11--
Platform versatility and compelling economics create a
unique, competitive position
Versatility of
business model
HigherLower
Advisor
income /
profit margin
Low
High
Wirehouses
Regionals
Traditional IBDs
Custodians
--12--
Strategy capitalizes on opportunities within our core
business footprint
Markets
Drivers of
opportunity
LPL Financial
strategy
Independent advisors Consumer preference for
independence
Evolving diverse and
comprehensive model
Trend toward RIA / hybrid Leveraging integrated
solution
Financial institutions Revenue diversification and
operating efficiencies
Building upon 30% market
share and expanding bank
wealth management
Retirement plans Shift from defined benefit to
defined contribution
Monetizing advice for plans
--13--
We are unlocking additional value for advisors
Current Advisor Time Spend Increased Productivity
Capacity
Consuming
(>60%)
$ Revenue
Generating
(<40%)
Our Key Ingredients
Consultative practice management
Scalable investment platforms
Integrated technology
Robust service & compliance
1
2
3
4
Capacity
Consuming
$ Revenue
Generating
Source: Internal LPL Financial study
--14--
LPL empowers advisors to serve an evolving and
increasingly complex set of investor needs
Executing transactions Providing advice
Picking investments Managing portfolios
Answering investment
questions
Creating financial plans
Helping save for retirement Ensuring financial security
Returning calls
Communicating frequently
and proactively
Handling paperwork
Supporting a digital
experience
Prior Client
Service Paradigm
New Client
Service Paradigm
--15--
LPL Financial
Increased efficiency
Our strategy will reward our advisors and our shareholders
Greater productivity
Higher profitability and satisfaction
Our Advisors
Outsized financial performance
Improved operational efficiency
Sustained growth
--16--
Growing Revenue
Derek Bruton – Managing Director, Independent Advisor Services
The LPL Financial opportunity
Focus Capturing the opportunity
Grow Revenues
Leveraging our differentiated value proposition to attract, grow and retain
advisor business
Create Efficiencies
Unlocking value with technology by driving productivity, engagement and
risk management
Enhance Risk &
Compliance Culture
Investing in functions and controls to manage complexity across the
enterprise
Strengthen the
Financial Opportunity
Positioning to drive outsized earnings performance by executing on our
strategy
--18--
Our strategy is positioned to drive advisor productivity and
satisfaction and attract new business
Attract Grow Retain
--19--
Our differentiated business model wins in the marketplace
Attract
#1 destination for advisors looking to moveCapture of advisors in motion
LPL Financial’s success in 2012 is equivalent to
the next 7 IBD’s combined
Source: Discovery Database B/D Rep Movement Study, Dec 2012 Source: Cogent 2013 Advisor Migration Trends
LPL Financial Next 7 IBD’s
--20--
Our recruiting opportunity set is significant
Markets IBD Hybrid RIA Employee
LPL position Market leader Market leader Minimal presence Target breakaways
Recruiting
opportunity
Flight to quality
Leverage differentiated
platform
Evolve platform to address Shift to independence
Competitors
Raymond James, Commonwealth,
Ameriprise Minimal direct competition
Schwab, TD Ameritrade,
Fidelity
IBD’s, custodians
Attract
Industry AUM Source: Cerulli Quantitative Update: Advisor Metrics 2012
Total $12.8 trillion
--21--
Broad capabilities drive advisor productivity
Relationship
Manager
Investment
& Planning
Solutions
RIA
Enterprise
Consulting
Practice
Acquisition
&
Succession
PlanningRetirement
Partners
Insurance
Associates
Education
&
Consulting
Marketing
Grow
Comprehensive solution serving
an array of advisor practices
simplified by a single point of
contact with deep knowledge of an
advisor’s business
--22--
Benefits
•  Reallocation of time
•  Higher asset flows
•  Improving margins
•  Lower administrative costs
LPL advisors who fully utilize our capabilities outperform
those who don’t
Grow
Support transition to advisory
Investment & planning
solutions
Identify best practices Business consulting
Win new business Marketing
Technology that creates
efficiencies and drives
productivity
Integrated solutions
Asset-allocation strategies
and due diligence
Research
Advisor need LPL Financial Solution
--23--
Segmented approach to delivering capabilities creates a more
personal advisor experience and drives adoption
Execution
–  Recognize not every advisor is the same
–  Segment advisor base to gain insight into needs and key characteristics
–  Analyze advisor profitability to determine the most valuable segments
Result
–  Provide targeted advisors with more customized services
–  Drive greater efficiency
–  Improve advisor satisfaction and retention
Example Segments
•  Legacy
•  Emerging advisory
•  Large producers
•  New to industry
•  Ramping
•  Emerging brokerage
•  Core
•  Retirement plan
Grow
--24--
Solo brokerage
practice
Add financial
planning and
insurance
capabilities
Leverage
relationship
manager and
technology to
enhance
productivity and
account growth
Utilize practice
management
to convert to
fee-based
business
Convert to
Hybrid RIA
Partner to
evolve into large
enterprise
Our model provides flexibility as advisors mature and grow
Succession
planning
Retain
Production retention has averaged 97% over the last 7 years
--25--
We are extending our market leadership
Expanding recruiting to
attract new business
Investing in capabilities
and segmenting delivery
to drive adoption
Expanding solutions for
large enterprises and
succession planning
Attract Grow Retain
--26--
Creating Efficiencies
Victor Fetter – Chief Information Officer
The LPL Financial opportunity
Focus Capturing the opportunity
Grow Revenues
Leveraging our differentiated value proposition to attract, grow and retain
advisor business
Create Efficiencies
Unlocking value with technology by driving productivity, engagement and
risk management
Enhance Risk &
Compliance Culture
Investing in functions and controls to manage complexity across the
enterprise
Strengthen the
Financial Opportunity
Positioning to drive outsized earnings performance by executing on our
strategy
--28--
Risk & Compliance
Our integrated technology platform creates an
end-to-end solution
Brokerage & advisory custody
Self-clearing
Managed platform
Marketing &
Prospecting
Client & Lead
Management
Wealth &
Investment
Planning
Investment
Execution
Monitoring &
Servicing
Advisor
Practice
Solutions
--29--
Technology strategy simplifies business, increases
efficiency, and creates value
Advisor
Productivity
Investor
Engagement
Risk
Management
Employee
Productivity
--30--
We are taking a more nimble and responsive approach
The LPL Financial Way #LPLDigitalLife
Simpler
Smarter
More Personal
Architecture
Innovation
Talent
•  Capability based
•  Agile development
•  Predictive analytics
•  120-day delivery increments
•  Clearer project priorities
•  Monthly KPI reporting
•  Product management team
•  6x60 visits
•  Service360 job shadowing
•  Patent program
•  Innovation days
•  Business intelligence practice
•  User experience
•  Reusability
•  Security
•  Added 90+ technology hires
•  12 senior SVP’s+ hired
•  Extended partner network
--31--
Our solutions increase advisor productivity
Success metrics
•  30% of advisor checks are deposited with remote deposit
•  520k total trades, generating 3x normal weekly trade volume since June
•  3,200+ mobile devices activated
Streamlined Office Enhanced Trading
Key deliveries
Advisor
Productivity
LPL Financial Mobile
--32--
Key deliveries
New tools enhance investor engagement
Account View
Success metrics
•  600,000+ combined advisor/client log-ins to
Account View
•  2,700+ advisors branded Account View site
•  Website hosting services through marketing
•  22,000+ clients are now 100% green with eligible
documents
•  40% made the go-green election in the new
Account View
Go Green
Investor
Engagement
--33--
Key deliveries
Industry-leading software helps manage risk
Success metrics
•  Added efficiency through a single tool for all
managed alerts
•  Created foundational platform for other
compliance and risk-management applications
•  30% reduction in overnight processing time
•  Added more robust disaster recovery capability
Risk
Management
--34--
Key deliveries
Focus on employee tools makes their work easier
New imaging and workflow Equipment relevancy
Success metrics
•  300 workflows reduced to 40 through simplified
image routing
•  80% faster image search than previous
technology
•  1,000 new laptops/workstations deployed
•  2,000 laptops/workstations upgraded
•  Enhanced mobility
•  VOIP - 99.999% availability
Employee
Productivity
--35--
Our technology strategy is unlocking value
Advisor
Productivity
Investor
Engagement
Risk
Management
Employee
Productivity
Differentiating LPL
Simplifying business
Generating returns
--36--
Enhancing the Risk and Compliance Culture
Michelle Oroschakoff – Chief Risk Officer
The LPL Financial opportunity
Focus Capturing the opportunity
Grow Revenues
Leveraging our differentiated value proposition to attract, grow and retain
advisor business
Create Efficiencies
Unlocking value with technology by driving productivity, engagement and
risk management
Enhance Risk &
Compliance Culture
Investing in functions and controls to manage complexity across the
enterprise
Strengthen Financial
Opportunity
Positioning to drive outsized earnings performance by executing on our
strategy
--38--
LPL Governance, Risk & Compliance is delivering solutions
that support our business and our advisors
Low-conflict model
and robust controls
environment
Advisor partnerships
that drive efficiency
and compliance
--39--
Centralized governance structure helps keep pace with
changing regulatory environment
Business Units
Risk &
Supervisory
Functions
Management
Committee
Risk
Oversight
Committee
Independent
Control
Functions
Governance &
Risk
Committees
Governance
Control and
monitor
Frontline management
Partnership
Independent
Compliance
Oversight
Controls
--40--
A lower-risk model Controls
Retail investment advice
No proprietary products
Focus
Integrated technology
Research
Scale
--41--
Robust compliance and risk capabilities delivered through
integration of technology and specialized personnel
•  6,200 branch exams conducted annually
•  8,500+ advertising/sales pieces reviewed
monthly
•  Thousands of products have been approved
for sale in conjunction with a robust risk-
based review and approval process for
sponsors and products
•  29,000+ documents imaged monthly,
automating this time-consuming process
GRC
Supervision
Brokerage
compliance
Advisory
compliance
Product risk
management
Marketing
regulatory
review
Financial
intelligence
unit
Corporate
governance
Information
security
Business
continuity
Controls
--42--
325
499
0
100
200
300
400
500
600
2010 2013 YTD
GRC Employees
We are increasing resources for regionally managed
compliance and supervision
Branch Examiner Locations
Supervisory Locations0
10
20
30
40
2010 2013 YTD
Ratio - Advisors to GRC Staff
38 : 1
27 : 1
Controls
--43--
Oversight is tailored to advisors’ business practices
Branch manager sales
activities supervised by
experienced designated
principals
Complex product
sales supervision
by dedicated GRC
team
Additional control provided
by assessment of branch
manager supervision by
GRC's independent
quality-control function
All branches examined
on a risk-based approach,
10%-15% unannounced
Potential disciplinary
matters reviewed by
Advisor Business
Conduct Committee
chaired by GRC
Advisors supervised
directly by licensed
branch manager or
Home Office
supervisory
principals
GRC surveillance and
branch exams provide
oversight of supervision
performed by branch
managers, supervisory
principals and designated
principals
Partnership
--44--
Needs-based approach reduces advisor complexity and
drives efficiency Partnership
Advisor need LPL Financial solution
Identify suitable product Risk and Research due diligence on new products
Process complex products Dedicated team to review complex products
Maintain proper licensing
Robust onboarding process and ongoing automated
alerts to ensure proper licensing
Utilize network of tools to interface with clients Technology training
Ensure suitability and fiduciary standards are met
Review trades and portfolios for suitability and other
criteria in accordance with regulatory framework
Stay abreast of regulatory change
Regular policy updates, advisor regulatory alerts and
training
Create marketing material to grow business Review and approval of advertising materials
--45--
LPL is focused on delivering independent advice in a
low-conflict model
Low-conflict model
and robust controls
environment
Advisor partnerships
that drive efficiency
and compliance
Allows advisors to:
•  Conduct business with confidence that they are operating within regulatory
framework
•  Offer the best and most appropriate products to investors
•  Benefit from a capable and specialized Compliance and Risk network
--46--
Creating Value for Sponsors:
A panel discussion moderated by Robert Moore
Bill Glavin – CEO, OppenheimerFunds
Nick Lane – Senior Executive Director and Head of US Life and Retirement,
AXA Equitable
Bob Reynolds – CEO, Putnam Investments
Strengthening the Financial Opportunity
Dan Arnold – Chief Financial Officer
The LPL Financial opportunity
Focus Capturing the opportunity
Grow Revenues
Leveraging our differentiated value proposition to attract, grow and retain
advisor business
Create Efficiencies
Unlocking value with technology by driving productivity, engagement and
risk management
Enhance Risk &
Compliance Culture
Investing in functions and controls to manage complexity across the
enterprise
Strengthen the
Financial Opportunity
Positioning to drive outsized earnings performance by executing on our
strategy
--49--
Performance
We achieved strong growth since IPO despite interest-rate
and G&A investment headwinds
•  Grew AUM to $415 bn
(10% CAGR)
•  Grew advisors to 13,563
(3% CAGR)
•  Increased revenue $878 mm
(9% CAGR)
•  Repurchased 14.3 mm
shares at WASP of $32.94
•  Cash sweep fees
declined ~10 bps,
eliminating $24 million in
pre-tax profit, reducing
EPS by $0.13
•  Core G&A CAGR of 10%
Adjusted EPS has
grown from $1.71 to
$2.31 (12% CAGR )
Tailwinds
Note: Performance reflects growth from 12/31/10 through 9/30/13 on a trailing twelve-month basis where appropriate. Adjusted earnings per share
(“Adjusted EPS”) is a non-GAAP measure. For reconciliation of non-GAAP measures please consult the disclosures at the front of this presentation
and in the Appendix of this presentation.
Headwinds
--50--
Going forward, strategy adoption positions LPL Financial
for financial performance
--51--
Improving advisor efficiency leads to greater
productivity
•  Q3 2013 annualized commission
per advisor is $156k
•  An incremental $5k in
commissions per advisor would
result in $9 mm in incremental
gross margin based on current
advisor count
Increasing
advisor
productivity
--52--
Differentiated offering and industry trends yield strong
advisory asset growth
•  Additional net new
advisory asset, ex-
market, growth of 8-10%
annually
•  The launch of our
integrated independent
RIA platform has further
accelerated advisory
growth
Increasing
advisor
productivity
--53--
Shift to advisory creates margin opportunities
•  Advisory AUM growth is over 2x faster than
brokerage, climbing from 26% to 34% of
total assets
•  The gross margin ROA on advisory assets is
~35 bps, 1.4x greater than brokerage AUM
•  A 5% shift from brokerage AUM to advisory
AUM would generate an additional $21
million in recurring gross margin
Note: Advisory gross margin ROA represents revenue from both advisory fees after production expense, and associated asset-based and transaction and other fees directly
attributable to the Corporate and Independent RIA offerings. The Advisory gross margin ROA is based on the weighted average of the Corporate and Independent RIA assets.
In the current interest-rate environment the Independent RIA gross margin ROA is less than the Corporate RIA gross margin ROA due to the higher concentration of ICA based
assets. The weighted average Advisory gross margin ROA and the gross margin upside from a 5% shift to advisory are based on current asset levels.
Unlocking
embedded
growth
--54--
Track record of innovation
•  Conversion to omnibus
recordkeeping
•  Expansion of Plus Sponsor
programs
•  Salesforce CRM
•  Advisory sponsorship revenue
•  Premium technology revenue
Innovation leads to high-margin attachment
revenue growth
* Represents advisor and account fees based upon Transaction and Other Fees, less the transaction component
Attachment revenue
ex-cash has increased
from 17% to 23% of
advisor production
since 2007
Unlocking
embedded
growth
--55--
Normalized interest rates will bring financial benefits
ICA MMF Total
Assets ($ in bn) $17.3 $8.2 $25.5
Current fee (bps) 65 6 46
Max fee (bps) 185 53 142
Annualized incremental pre-tax income
($ in mm)
$208 $39
$246
•  EPS impact of ~$1.40
•  Maximum fees are achieved when Federal Funds Effective rate (FFER) is ~250 bps1
•  ICA upside from FFER recognized incrementally and immediately as FFER improves
1 If maximum bank spread fee compression occurs, the minimum FFER rate to maximize fees would increase up to approximately 345 bps
Unlocking
embedded
growth
--56--
Cash sweep assets stable as percent of growing AUM
Unlocking
embedded
growth
--57--
Investment in technology and Service Value
Commitment position us for future efficiency
Note: Core G&A is defined as compensation and G&A expenses excluding promotional expense, depreciation
and amortization and items excluded in our determination of adjusted earnings.
Achieving
operational
efficiency
--58--
Managing growth through smart investment and
simplicity and productivity initiatives
Note: Volume-related G&A growth may elevate when revenue growth exceeds 10%
* Simplicity & productivity savings from initiatives such as procurement and outsourcing
Achieving
operational
efficiency
--59--
Strategy execution drives outsized earnings performance
Build on track record of growth since 2000:
Revenue CAGR = 13%
Adjusted EBITDA CAGR = 17%
Adjusted EPS growth potential
Potential revenue growth
5% 10% 15%
Potential
G&A
Growth
4% 8% 23% 38%
6% 4% 19% 35%
8% 1% 16% 31%
Note: Adjusted EBITDA is a non-GAAP measure
Achieving
operational
efficiency
--60--
Capital-light model generates significant free cash
flow, expanding discretionary capital
Note: Adjusted EBITDA is a non-GAAP measure. Cash from operations defined as change in cash available for corporate use before capital
expenditures, dividends and share repurchases
Cash from operations is approximately 55% of Adjusted EBITDA
2x-3x leverage maintains optimal cost of capital
Reinforcing
capital
light model
--61--
Strategy adoption positions LPL Financial for financial
performance
--62--
Compelling Investment Thesis
Compelling investment thesis
•  Capitalizing on industry move to independence
with differentiated business model
•  Increasing advisor productivity
•  Driving operational efficiency
•  Unlocking embedded growth
•  Unique capital-light model and shareholder
friendly approach to capital allocation
--64--
Appendix
Adjusted Earnings reconciliation
--66--
Adjusted Earnings reconciliation
(a) Generally, EBITDA Adjustments and amortization of intangible assets have been tax effected using a federal rate of 35% and the applicable effective state rate, which was 3.30%, net of the federal tax benefit, for the periods
presented, except as otherwise noted below.
(b) Represents the after-tax expense of non-qualified stock options for which the Company receives a tax deduction upon exercise, restricted stock awards for which the Company receives a tax deduction upon vesting, and the full
expense impact of incentive stock options granted to employees that have vested and qualify for preferential tax treatment and conversely for which the Company does not receive a tax deduction. Share-based compensation for vesting
of incentive stock options was $0.9 million, $1.1 million, $1.2 million, $1.3 million and $1.6 million for the three months ended September 30, 2013, June 30, 2013, March 31, 2013, December 31, 2012 and September 30, 2012,
respectively.
(c) Represents the after-tax expense of acquisition and related costs for which the Company receives a tax deduction. The three months ended March 31, 2013 includes a $3.8 million reduction of expense related to the estimated fair
value of contingent consideration for the stock acquisition of Concord that is not deductible for tax purposes.
(d) Represents the after-tax expense of equity issuance and offering costs related to the closing of a secondary offering in the second quarter of 2012. Results for the three months ended September 30, 2012 include the full expense
impact of a $3.9 million charge relating to the late deposit of withholding taxes related to the exercise of certain non-qualified stock options in connection with the Company's 2010 initial public offering, that is not deductible for tax
purposes.
(e) Represents the expected tax benefit available to the Company from the accumulated net operating losses of Concord that arose prior to its acquisition by the Company; such benefits were recorded in the third quarter of 2012.
(f) Represents Adjusted Earnings, a non-GAAP measure, divided by weighted average number of shares outstanding on a fully diluted basis. Set forth is a reconciliation of earnings per share on a fully diluted basis, as calculated in
accordance with GAAP to Adjusted Earnings per share:
--67--

LPL_Master_Powerpoint_v6

  • 1.
    November 12, 2013 WestinGrand Central New York, NY
  • 2.
    Trap Kloman –Senior Vice President | Investor Relations
  • 3.
    Safe Harbor Disclosure Statementsin this presentation regarding LPL Financial Holdings Inc.'s (the “Company”) future financial and operating results, plans, strategies, goals, future market position, ability and plans to repurchase shares and pay dividends in the future, including statements relating to future efficiency gains, scale and projected expenses and savings as a result of the Service Value Commitment (the “SVC”) or other initiatives, ability and plans to deliver technology functionality, features or upgrades, future growth, market share and insured cash account portfolio, including the statements on the slides entitled “Shift to advisory creates margin opportunities”, “Normalized interest rates will bring financial benefits”, “Investment in technology and Service Value Commitment position us for future efficiency”, “Managing growth through smart investment and simplicity and productivity initiatives”, “Strategy execution drives outsized earnings performance” and “Capital-light model generates significant free cash flow, expanding discretionary capital”, as well as any other statements that are not related to present facts or current conditions or that are not purely historical, constitute forward-looking statements. These forward-looking statements are based on the Company's historical performance and its plans, estimates and expectations as of November 12, 2013. Forward-looking statements are not guarantees that the future results, plans, intentions or expectations expressed or implied by the Company will be achieved. Matters subject to forward-looking statements involve known and unknown risks and uncertainties, including economic, legislative, regulatory, competitive and other factors, which may cause actual financial or operating results, levels of activity, or the timing of events, to be materially different than those expressed or implied by forward-looking statements. Important factors that could cause or contribute to such differences include: finalization and execution of the Company’s plans related to the SVC, including the Company’s ability to successfully transform and transition business processes to third party service providers; the Company’s success in negotiating and developing commercial arrangements with third party service providers that will enable the Company to realize the service improvements and efficiencies expected to result from the SVC or other initiatives; the performance of third party service providers to which business processes are transitioned from the Company; finalization and execution of the Company’s plans related to technology, including the Company’s ability to successfully integrate technology from third party technology providers; the Company’s success in negotiating and developing commercial arrangements with third party technology providers that will enable the Company to realize the improvements and efficiencies expected to result from such technology, including with respect to supervision and oversight of advisor activities; the Company’s ability to control operating risks, information technology systems risks and sourcing risks; changes in general economic and financial market conditions, including retail investor sentiment; fluctuations in the value of assets under custody; effects of competition in the financial services industry; changes in the number of the Company's financial advisors and institutions, their ability to market effectively financial products and services, and the success of the Company’s initiatives designed to engage them; changes in interest rates and fees payable by banks participating in the Company's cash sweep program, including the Company's success in negotiating agreements with current or additional counterparties; the Company's success in integrating the operations of acquired businesses; the effect of current, pending and future legislation, regulation and regulatory actions, including disciplinary actions imposed by self-regulatory organizations; and the other factors set forth in Part I, “Item 1A. Risk Factors” in the Company's 2012 Annual Report on Form 10-K as may be amended or updated in our quarterly reports on Form 10-Q. Except as required by law, the Company specifically disclaims any obligation to update any forward-looking statements as a result of future developments, even if its estimates change, and you should not rely on those statements as representing the Company's views after November 12, 2013.
  • 4.
    Non-GAAP Financial Measures AdjustedEarnings represent net income before: (a) employee share-based compensation expense, (b) amortization of intangible assets resulting from various acquisitions, (c) debt extinguishment costs, (d) restructuring and conversion costs, (e) equity issuance and related offering costs and (f) other. Reconciling items are tax effected using the income tax rates in effect for the applicable period, adjusted for any potentially non-deductible amounts. Adjusted Earnings per share represents Adjusted Earnings divided by weighted average outstanding shares on a fully diluted basis. The Company prepares Adjusted Earnings and Adjusted Earnings per share to eliminate the effects of items that it does not consider indicative of its core operating performance. The Company believes these measures provide investors with greater transparency by helping illustrate the underlying financial and business trends relating to results of operations and financial condition and comparability between current and prior periods. Adjusted Earnings and Adjusted Earnings per share are not measures of the Company's financial performance under GAAP and should not be considered as an alternative to net income or earnings per share or any other performance measure derived in accordance with GAAP, or as an alternative to cash flows from operating activities as a measure of profitability or liquidity. Adjusted EBITDA is defined as EBITDA (net income plus interest expense, income tax expense, depreciation and amortization), further adjusted to exclude certain non-cash charges and other adjustments set forth in the table above. The Company presents Adjusted EBITDA because the Company considers it a useful financial metric in assessing the Company's operating performance from period to period by excluding certain items that the Company believes are not representative of its core business, such as certain material non-cash items and other adjustments that are outside the control of management. Adjusted EBITDA is not a measure of the Company's financial performance under GAAP and should not be considered as an alternative to net income or any other performance measure derived in accordance with GAAP, or as an alternative to cash flows from operating activities as a measure of profitability or liquidity. In addition, Adjusted EBITDA can differ significantly from company to company depending on long-term strategic decisions regarding capital structure, the tax jurisdictions in which companies operate and capital investments. You can find additional related information, including a reconciliation of such non-GAAP measures, in the Investor Relations section of our website at www.lpl.com.
  • 5.
    The LPL FinancialOpportunity Mark Casady – Chairman and CEO
  • 6.
    LPL Financial isan established industry leader •  13,563 advisors •  $415 billion in advisory & brokerage assets •  4th largest brokerage firm1 •  $55 billion in assets with our fully integrated Hybrid RIA offering •  $92 billion in retirement assets; leading provider to over 35,000 retirement plans 1 Based on number of advisors reported from publicly disclosed information as of September 30, 2013 --2--
  • 7.
    We serve afundamental and growing need Our Mission We believe that objective financial advice is a fundamental need for everyone. We enable our clients to focus on what they do best—create the personal, long-term relationships that are the foundation for turning life’s aspirations into financial realities. --3--
  • 8.
    Strong performance sinceIPO Added 1,119 net new advisors Initiated retirement plan solution Accelerated RIA and HNW growth Launched Service Value Commitment Established next-generation leadership team Business Performance Financial Performance Note: Based on growth and developments since 12/31/10 Grew AUM by 31% Increased advisory AUM from 29% to 34% of total AUM Grew Hybrid RIA assets 293% to $55 bn Repurchased 14.3 mm shares Distributed $285 mm in dividends --4--
  • 9.
    The LPL Financialopportunity Focus Capturing the opportunity Grow Revenues Leveraging our differentiated value proposition to attract, grow and retain advisor business Create Efficiencies Unlocking value with technology by driving productivity, engagement and risk management Enhance Risk & Compliance Culture Investing in functions and controls to manage complexity across the enterprise Strengthen the Financial Opportunity Positioning to drive outsized earnings performance by executing on our strategy --5--
  • 10.
    Speaker Topic Dan Krems,Executive Vice President of Corporate Strategy Winning in the Marketplace Derek Bruton, Managing Director, Independent Advisor Services Growing Revenue Victor Fetter, Chief Information Officer Creating Efficiencies Michelle Oroschakoff, Chief Risk Officer Enhancing Risk and Compliance Culture Robert Moore, President Creating Value for Sponsors: A panel discussion Bill Glavin, CEO, Oppenheimer Funds Bob Reynolds, CEO, Putnam Investments Nick Lane, Senior Executive Director and Head of US Life and Retirement, AXA Equitable Dan Arnold, Chief Financial Officer Strengthening the Financial Opportunity Agenda --6--
  • 11.
    Winning in theMarketplace: Building a Smarter, Simpler, More Personal LPL Dan Krems - Executive Vice President, Corporate Strategy
  • 12.
    The market forretail advice is large and poised for growth Source: Cerulli Quantitative Update: Advisor Metrics 2012 Note: 38.6M people between 55-64 years old are projected for year end 2012, 40.8M for 2015, 42.8M for 2020. Peak earner demographics are based on Census forecasts. Investable assets = $19 trillion U.S. peak earners (age 55-64) 11% growth 2012-2020 --8--
  • 13.
    The march towardindependence continues Source: Cerulli Quantitative Update: Intermediary Distribution 2012 LPL share of Independent: 8%LPL share of Independent: 5% ~$9T ~$13T 70% 30% 64% 36% 62% 38% n/a LPL expanding market share --9--
  • 14.
    Established scale andscope to drive positioning to win B/D & RIA Advisors **LPL Financial is positioned to serve investors whose assets account for 92% of total retail assets. Market data per Cerulli Quantitative Update: Intermediary Distribution 2012 Retirement Practitioners Mass Affluent High Net Worth Bank/Credit Union Increasing scale Expanding scope 3X + Growth By investor By advisor practice --10--
  • 15.
    LPL Financial We arenow building a smarter, simpler, more personal LPL Focus on our footprint Capitalize on continuing secular trend toward independent advice with a broad array of advisors serving the vast majority of investors Drive to simplicity Combine technology, automation and process simplification to improve efficiency in our advisors’ businesses and our own Unlock advisor productivity Deliver a growing array of support functions and capabilities, enabling advisors to win more business and enhance client satisfaction --11--
  • 16.
    Platform versatility andcompelling economics create a unique, competitive position Versatility of business model HigherLower Advisor income / profit margin Low High Wirehouses Regionals Traditional IBDs Custodians --12--
  • 17.
    Strategy capitalizes onopportunities within our core business footprint Markets Drivers of opportunity LPL Financial strategy Independent advisors Consumer preference for independence Evolving diverse and comprehensive model Trend toward RIA / hybrid Leveraging integrated solution Financial institutions Revenue diversification and operating efficiencies Building upon 30% market share and expanding bank wealth management Retirement plans Shift from defined benefit to defined contribution Monetizing advice for plans --13--
  • 18.
    We are unlockingadditional value for advisors Current Advisor Time Spend Increased Productivity Capacity Consuming (>60%) $ Revenue Generating (<40%) Our Key Ingredients Consultative practice management Scalable investment platforms Integrated technology Robust service & compliance 1 2 3 4 Capacity Consuming $ Revenue Generating Source: Internal LPL Financial study --14--
  • 19.
    LPL empowers advisorsto serve an evolving and increasingly complex set of investor needs Executing transactions Providing advice Picking investments Managing portfolios Answering investment questions Creating financial plans Helping save for retirement Ensuring financial security Returning calls Communicating frequently and proactively Handling paperwork Supporting a digital experience Prior Client Service Paradigm New Client Service Paradigm --15--
  • 20.
    LPL Financial Increased efficiency Ourstrategy will reward our advisors and our shareholders Greater productivity Higher profitability and satisfaction Our Advisors Outsized financial performance Improved operational efficiency Sustained growth --16--
  • 21.
    Growing Revenue Derek Bruton– Managing Director, Independent Advisor Services
  • 22.
    The LPL Financialopportunity Focus Capturing the opportunity Grow Revenues Leveraging our differentiated value proposition to attract, grow and retain advisor business Create Efficiencies Unlocking value with technology by driving productivity, engagement and risk management Enhance Risk & Compliance Culture Investing in functions and controls to manage complexity across the enterprise Strengthen the Financial Opportunity Positioning to drive outsized earnings performance by executing on our strategy --18--
  • 23.
    Our strategy ispositioned to drive advisor productivity and satisfaction and attract new business Attract Grow Retain --19--
  • 24.
    Our differentiated businessmodel wins in the marketplace Attract #1 destination for advisors looking to moveCapture of advisors in motion LPL Financial’s success in 2012 is equivalent to the next 7 IBD’s combined Source: Discovery Database B/D Rep Movement Study, Dec 2012 Source: Cogent 2013 Advisor Migration Trends LPL Financial Next 7 IBD’s --20--
  • 25.
    Our recruiting opportunityset is significant Markets IBD Hybrid RIA Employee LPL position Market leader Market leader Minimal presence Target breakaways Recruiting opportunity Flight to quality Leverage differentiated platform Evolve platform to address Shift to independence Competitors Raymond James, Commonwealth, Ameriprise Minimal direct competition Schwab, TD Ameritrade, Fidelity IBD’s, custodians Attract Industry AUM Source: Cerulli Quantitative Update: Advisor Metrics 2012 Total $12.8 trillion --21--
  • 26.
    Broad capabilities driveadvisor productivity Relationship Manager Investment & Planning Solutions RIA Enterprise Consulting Practice Acquisition & Succession PlanningRetirement Partners Insurance Associates Education & Consulting Marketing Grow Comprehensive solution serving an array of advisor practices simplified by a single point of contact with deep knowledge of an advisor’s business --22--
  • 27.
    Benefits •  Reallocation oftime •  Higher asset flows •  Improving margins •  Lower administrative costs LPL advisors who fully utilize our capabilities outperform those who don’t Grow Support transition to advisory Investment & planning solutions Identify best practices Business consulting Win new business Marketing Technology that creates efficiencies and drives productivity Integrated solutions Asset-allocation strategies and due diligence Research Advisor need LPL Financial Solution --23--
  • 28.
    Segmented approach todelivering capabilities creates a more personal advisor experience and drives adoption Execution –  Recognize not every advisor is the same –  Segment advisor base to gain insight into needs and key characteristics –  Analyze advisor profitability to determine the most valuable segments Result –  Provide targeted advisors with more customized services –  Drive greater efficiency –  Improve advisor satisfaction and retention Example Segments •  Legacy •  Emerging advisory •  Large producers •  New to industry •  Ramping •  Emerging brokerage •  Core •  Retirement plan Grow --24--
  • 29.
    Solo brokerage practice Add financial planningand insurance capabilities Leverage relationship manager and technology to enhance productivity and account growth Utilize practice management to convert to fee-based business Convert to Hybrid RIA Partner to evolve into large enterprise Our model provides flexibility as advisors mature and grow Succession planning Retain Production retention has averaged 97% over the last 7 years --25--
  • 30.
    We are extendingour market leadership Expanding recruiting to attract new business Investing in capabilities and segmenting delivery to drive adoption Expanding solutions for large enterprises and succession planning Attract Grow Retain --26--
  • 31.
    Creating Efficiencies Victor Fetter– Chief Information Officer
  • 32.
    The LPL Financialopportunity Focus Capturing the opportunity Grow Revenues Leveraging our differentiated value proposition to attract, grow and retain advisor business Create Efficiencies Unlocking value with technology by driving productivity, engagement and risk management Enhance Risk & Compliance Culture Investing in functions and controls to manage complexity across the enterprise Strengthen the Financial Opportunity Positioning to drive outsized earnings performance by executing on our strategy --28--
  • 33.
    Risk & Compliance Ourintegrated technology platform creates an end-to-end solution Brokerage & advisory custody Self-clearing Managed platform Marketing & Prospecting Client & Lead Management Wealth & Investment Planning Investment Execution Monitoring & Servicing Advisor Practice Solutions --29--
  • 34.
    Technology strategy simplifiesbusiness, increases efficiency, and creates value Advisor Productivity Investor Engagement Risk Management Employee Productivity --30--
  • 35.
    We are takinga more nimble and responsive approach The LPL Financial Way #LPLDigitalLife Simpler Smarter More Personal Architecture Innovation Talent •  Capability based •  Agile development •  Predictive analytics •  120-day delivery increments •  Clearer project priorities •  Monthly KPI reporting •  Product management team •  6x60 visits •  Service360 job shadowing •  Patent program •  Innovation days •  Business intelligence practice •  User experience •  Reusability •  Security •  Added 90+ technology hires •  12 senior SVP’s+ hired •  Extended partner network --31--
  • 36.
    Our solutions increaseadvisor productivity Success metrics •  30% of advisor checks are deposited with remote deposit •  520k total trades, generating 3x normal weekly trade volume since June •  3,200+ mobile devices activated Streamlined Office Enhanced Trading Key deliveries Advisor Productivity LPL Financial Mobile --32--
  • 37.
    Key deliveries New toolsenhance investor engagement Account View Success metrics •  600,000+ combined advisor/client log-ins to Account View •  2,700+ advisors branded Account View site •  Website hosting services through marketing •  22,000+ clients are now 100% green with eligible documents •  40% made the go-green election in the new Account View Go Green Investor Engagement --33--
  • 38.
    Key deliveries Industry-leading softwarehelps manage risk Success metrics •  Added efficiency through a single tool for all managed alerts •  Created foundational platform for other compliance and risk-management applications •  30% reduction in overnight processing time •  Added more robust disaster recovery capability Risk Management --34--
  • 39.
    Key deliveries Focus onemployee tools makes their work easier New imaging and workflow Equipment relevancy Success metrics •  300 workflows reduced to 40 through simplified image routing •  80% faster image search than previous technology •  1,000 new laptops/workstations deployed •  2,000 laptops/workstations upgraded •  Enhanced mobility •  VOIP - 99.999% availability Employee Productivity --35--
  • 40.
    Our technology strategyis unlocking value Advisor Productivity Investor Engagement Risk Management Employee Productivity Differentiating LPL Simplifying business Generating returns --36--
  • 41.
    Enhancing the Riskand Compliance Culture Michelle Oroschakoff – Chief Risk Officer
  • 42.
    The LPL Financialopportunity Focus Capturing the opportunity Grow Revenues Leveraging our differentiated value proposition to attract, grow and retain advisor business Create Efficiencies Unlocking value with technology by driving productivity, engagement and risk management Enhance Risk & Compliance Culture Investing in functions and controls to manage complexity across the enterprise Strengthen Financial Opportunity Positioning to drive outsized earnings performance by executing on our strategy --38--
  • 43.
    LPL Governance, Risk& Compliance is delivering solutions that support our business and our advisors Low-conflict model and robust controls environment Advisor partnerships that drive efficiency and compliance --39--
  • 44.
    Centralized governance structurehelps keep pace with changing regulatory environment Business Units Risk & Supervisory Functions Management Committee Risk Oversight Committee Independent Control Functions Governance & Risk Committees Governance Control and monitor Frontline management Partnership Independent Compliance Oversight Controls --40--
  • 45.
    A lower-risk modelControls Retail investment advice No proprietary products Focus Integrated technology Research Scale --41--
  • 46.
    Robust compliance andrisk capabilities delivered through integration of technology and specialized personnel •  6,200 branch exams conducted annually •  8,500+ advertising/sales pieces reviewed monthly •  Thousands of products have been approved for sale in conjunction with a robust risk- based review and approval process for sponsors and products •  29,000+ documents imaged monthly, automating this time-consuming process GRC Supervision Brokerage compliance Advisory compliance Product risk management Marketing regulatory review Financial intelligence unit Corporate governance Information security Business continuity Controls --42--
  • 47.
    325 499 0 100 200 300 400 500 600 2010 2013 YTD GRCEmployees We are increasing resources for regionally managed compliance and supervision Branch Examiner Locations Supervisory Locations0 10 20 30 40 2010 2013 YTD Ratio - Advisors to GRC Staff 38 : 1 27 : 1 Controls --43--
  • 48.
    Oversight is tailoredto advisors’ business practices Branch manager sales activities supervised by experienced designated principals Complex product sales supervision by dedicated GRC team Additional control provided by assessment of branch manager supervision by GRC's independent quality-control function All branches examined on a risk-based approach, 10%-15% unannounced Potential disciplinary matters reviewed by Advisor Business Conduct Committee chaired by GRC Advisors supervised directly by licensed branch manager or Home Office supervisory principals GRC surveillance and branch exams provide oversight of supervision performed by branch managers, supervisory principals and designated principals Partnership --44--
  • 49.
    Needs-based approach reducesadvisor complexity and drives efficiency Partnership Advisor need LPL Financial solution Identify suitable product Risk and Research due diligence on new products Process complex products Dedicated team to review complex products Maintain proper licensing Robust onboarding process and ongoing automated alerts to ensure proper licensing Utilize network of tools to interface with clients Technology training Ensure suitability and fiduciary standards are met Review trades and portfolios for suitability and other criteria in accordance with regulatory framework Stay abreast of regulatory change Regular policy updates, advisor regulatory alerts and training Create marketing material to grow business Review and approval of advertising materials --45--
  • 50.
    LPL is focusedon delivering independent advice in a low-conflict model Low-conflict model and robust controls environment Advisor partnerships that drive efficiency and compliance Allows advisors to: •  Conduct business with confidence that they are operating within regulatory framework •  Offer the best and most appropriate products to investors •  Benefit from a capable and specialized Compliance and Risk network --46--
  • 51.
    Creating Value forSponsors: A panel discussion moderated by Robert Moore Bill Glavin – CEO, OppenheimerFunds Nick Lane – Senior Executive Director and Head of US Life and Retirement, AXA Equitable Bob Reynolds – CEO, Putnam Investments
  • 52.
    Strengthening the FinancialOpportunity Dan Arnold – Chief Financial Officer
  • 53.
    The LPL Financialopportunity Focus Capturing the opportunity Grow Revenues Leveraging our differentiated value proposition to attract, grow and retain advisor business Create Efficiencies Unlocking value with technology by driving productivity, engagement and risk management Enhance Risk & Compliance Culture Investing in functions and controls to manage complexity across the enterprise Strengthen the Financial Opportunity Positioning to drive outsized earnings performance by executing on our strategy --49--
  • 54.
    Performance We achieved stronggrowth since IPO despite interest-rate and G&A investment headwinds •  Grew AUM to $415 bn (10% CAGR) •  Grew advisors to 13,563 (3% CAGR) •  Increased revenue $878 mm (9% CAGR) •  Repurchased 14.3 mm shares at WASP of $32.94 •  Cash sweep fees declined ~10 bps, eliminating $24 million in pre-tax profit, reducing EPS by $0.13 •  Core G&A CAGR of 10% Adjusted EPS has grown from $1.71 to $2.31 (12% CAGR ) Tailwinds Note: Performance reflects growth from 12/31/10 through 9/30/13 on a trailing twelve-month basis where appropriate. Adjusted earnings per share (“Adjusted EPS”) is a non-GAAP measure. For reconciliation of non-GAAP measures please consult the disclosures at the front of this presentation and in the Appendix of this presentation. Headwinds --50--
  • 55.
    Going forward, strategyadoption positions LPL Financial for financial performance --51--
  • 56.
    Improving advisor efficiencyleads to greater productivity •  Q3 2013 annualized commission per advisor is $156k •  An incremental $5k in commissions per advisor would result in $9 mm in incremental gross margin based on current advisor count Increasing advisor productivity --52--
  • 57.
    Differentiated offering andindustry trends yield strong advisory asset growth •  Additional net new advisory asset, ex- market, growth of 8-10% annually •  The launch of our integrated independent RIA platform has further accelerated advisory growth Increasing advisor productivity --53--
  • 58.
    Shift to advisorycreates margin opportunities •  Advisory AUM growth is over 2x faster than brokerage, climbing from 26% to 34% of total assets •  The gross margin ROA on advisory assets is ~35 bps, 1.4x greater than brokerage AUM •  A 5% shift from brokerage AUM to advisory AUM would generate an additional $21 million in recurring gross margin Note: Advisory gross margin ROA represents revenue from both advisory fees after production expense, and associated asset-based and transaction and other fees directly attributable to the Corporate and Independent RIA offerings. The Advisory gross margin ROA is based on the weighted average of the Corporate and Independent RIA assets. In the current interest-rate environment the Independent RIA gross margin ROA is less than the Corporate RIA gross margin ROA due to the higher concentration of ICA based assets. The weighted average Advisory gross margin ROA and the gross margin upside from a 5% shift to advisory are based on current asset levels. Unlocking embedded growth --54--
  • 59.
    Track record ofinnovation •  Conversion to omnibus recordkeeping •  Expansion of Plus Sponsor programs •  Salesforce CRM •  Advisory sponsorship revenue •  Premium technology revenue Innovation leads to high-margin attachment revenue growth * Represents advisor and account fees based upon Transaction and Other Fees, less the transaction component Attachment revenue ex-cash has increased from 17% to 23% of advisor production since 2007 Unlocking embedded growth --55--
  • 60.
    Normalized interest rateswill bring financial benefits ICA MMF Total Assets ($ in bn) $17.3 $8.2 $25.5 Current fee (bps) 65 6 46 Max fee (bps) 185 53 142 Annualized incremental pre-tax income ($ in mm) $208 $39 $246 •  EPS impact of ~$1.40 •  Maximum fees are achieved when Federal Funds Effective rate (FFER) is ~250 bps1 •  ICA upside from FFER recognized incrementally and immediately as FFER improves 1 If maximum bank spread fee compression occurs, the minimum FFER rate to maximize fees would increase up to approximately 345 bps Unlocking embedded growth --56--
  • 61.
    Cash sweep assetsstable as percent of growing AUM Unlocking embedded growth --57--
  • 62.
    Investment in technologyand Service Value Commitment position us for future efficiency Note: Core G&A is defined as compensation and G&A expenses excluding promotional expense, depreciation and amortization and items excluded in our determination of adjusted earnings. Achieving operational efficiency --58--
  • 63.
    Managing growth throughsmart investment and simplicity and productivity initiatives Note: Volume-related G&A growth may elevate when revenue growth exceeds 10% * Simplicity & productivity savings from initiatives such as procurement and outsourcing Achieving operational efficiency --59--
  • 64.
    Strategy execution drivesoutsized earnings performance Build on track record of growth since 2000: Revenue CAGR = 13% Adjusted EBITDA CAGR = 17% Adjusted EPS growth potential Potential revenue growth 5% 10% 15% Potential G&A Growth 4% 8% 23% 38% 6% 4% 19% 35% 8% 1% 16% 31% Note: Adjusted EBITDA is a non-GAAP measure Achieving operational efficiency --60--
  • 65.
    Capital-light model generatessignificant free cash flow, expanding discretionary capital Note: Adjusted EBITDA is a non-GAAP measure. Cash from operations defined as change in cash available for corporate use before capital expenditures, dividends and share repurchases Cash from operations is approximately 55% of Adjusted EBITDA 2x-3x leverage maintains optimal cost of capital Reinforcing capital light model --61--
  • 66.
    Strategy adoption positionsLPL Financial for financial performance --62--
  • 67.
  • 68.
    Compelling investment thesis • Capitalizing on industry move to independence with differentiated business model •  Increasing advisor productivity •  Driving operational efficiency •  Unlocking embedded growth •  Unique capital-light model and shareholder friendly approach to capital allocation --64--
  • 69.
  • 70.
  • 71.
    Adjusted Earnings reconciliation (a)Generally, EBITDA Adjustments and amortization of intangible assets have been tax effected using a federal rate of 35% and the applicable effective state rate, which was 3.30%, net of the federal tax benefit, for the periods presented, except as otherwise noted below. (b) Represents the after-tax expense of non-qualified stock options for which the Company receives a tax deduction upon exercise, restricted stock awards for which the Company receives a tax deduction upon vesting, and the full expense impact of incentive stock options granted to employees that have vested and qualify for preferential tax treatment and conversely for which the Company does not receive a tax deduction. Share-based compensation for vesting of incentive stock options was $0.9 million, $1.1 million, $1.2 million, $1.3 million and $1.6 million for the three months ended September 30, 2013, June 30, 2013, March 31, 2013, December 31, 2012 and September 30, 2012, respectively. (c) Represents the after-tax expense of acquisition and related costs for which the Company receives a tax deduction. The three months ended March 31, 2013 includes a $3.8 million reduction of expense related to the estimated fair value of contingent consideration for the stock acquisition of Concord that is not deductible for tax purposes. (d) Represents the after-tax expense of equity issuance and offering costs related to the closing of a secondary offering in the second quarter of 2012. Results for the three months ended September 30, 2012 include the full expense impact of a $3.9 million charge relating to the late deposit of withholding taxes related to the exercise of certain non-qualified stock options in connection with the Company's 2010 initial public offering, that is not deductible for tax purposes. (e) Represents the expected tax benefit available to the Company from the accumulated net operating losses of Concord that arose prior to its acquisition by the Company; such benefits were recorded in the third quarter of 2012. (f) Represents Adjusted Earnings, a non-GAAP measure, divided by weighted average number of shares outstanding on a fully diluted basis. Set forth is a reconciliation of earnings per share on a fully diluted basis, as calculated in accordance with GAAP to Adjusted Earnings per share: --67--