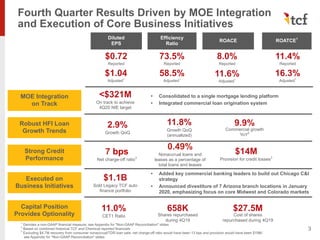
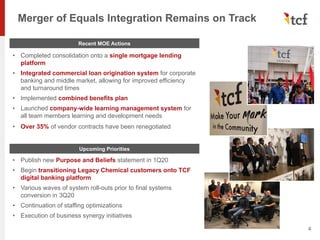
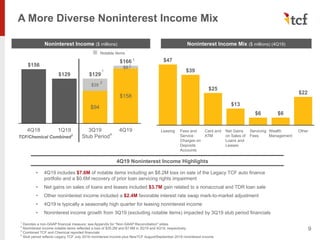
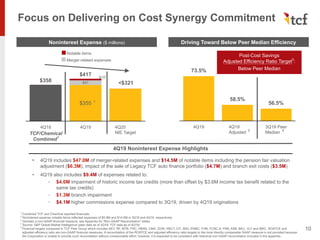
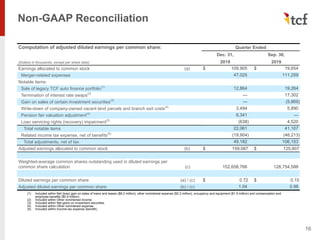
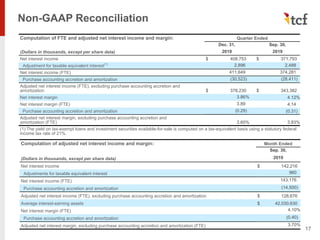
TCF Financial Corporation held a 4Q19 earnings presentation on January 27, 2020. The presentation contained forward-looking statements regarding TCF's financial performance and the merger with Chemical Financial Corporation. The presentation also contained cautionary language stating that TCF's actual future results could differ from projected results due to risks and uncertainties. TCF provided non-GAAP financial measures to allow for comparisons between periods and other institutions, but warned that non-GAAP measures have limitations. TCF reported diluted EPS of $0.72 but adjusted diluted EPS was $1.04. Integration of the merger was on track and loan growth was strong, particularly in commercial loans, while credit quality remained solid.
TCF Financial Corporation presented its 1Q20 earnings. Key highlights included:
- Loan and lease growth of 3.5% year-over-year driven by 12.4% commercial growth, while deposit growth was 2.0% year-over-year.
- Integration of the merger of equals with Chemical Financial remains on track despite COVID-19 challenges.
- Diluted EPS was $0.32 but was adjusted to $0.57. ROATCE was 5.4% but adjusted to 9.2%
TCF Financial Corporation provided an earnings presentation for the second quarter of 2020. The presentation discussed progress on integrating legacy Chemical and TCF systems, with key integration activities completed on schedule. Second quarter results were impacted by merger and integration expenses as well as the economic effects of the COVID-19 pandemic, though the company remains well-capitalized with strong liquidity and credit performance. Management also noted that Paycheck Protection Program lending totaled $1.9 billion during the quarter.
TCF Financial Corporation successfully completed the integration of its merger with Chemical Financial Corporation (MOE) on time in the third quarter of 2020 despite challenges from COVID-19. Key accomplishments included migrating to a single mortgage lending platform, commercial loan origination system, and core banking system. Third quarter results were impacted by the economic effects of the pandemic but loan deferrals declined significantly. TCF remains focused on achieving its cost savings targets from the merger.
TCF Financial Corporation held an earnings presentation on October 28, 2019 to discuss its third quarter 2019 results. The presentation focused on three main themes: 1) the closing of the merger of equals with Chemical Financial Corporation on August 1, 2019 and subsequent repositioning of the balance sheet; 2) reporting strong adjusted business results for the quarter despite challenges from purchase accounting; and 3) maintaining a strong capital position that provides strategic flexibility going forward.
The document provides cautionary statements regarding forward-looking statements made in the 2019 Annual Meeting of Stockholders presentation. It notes that any predictions involve risks and uncertainties, and actual results could differ materially from what is discussed. It lists numerous factors that could influence future performance, such as economic conditions, cybersecurity issues, interest rate changes, regulatory changes, and issues integrating any future acquisitions. The document also applies these cautions specifically to statements about the planned merger with Chemical Financial Corporation.
TCF Financial Corporation held an investor presentation on February 11, 2020 to discuss the merger with Chemical Financial Corporation. The presentation highlighted that the combined company will be a premier Midwest bank with $47 billion in total assets and $34 billion in loans and deposits each. It was noted that the merger of equals will create scale and product offerings to better compete in key Midwest markets. The new company will have a commercial loan focus of 67% and consumer loans of 33%. The presentation also introduced the new purpose and beliefs of the combined organization to unite the cultures as One TCF and outlined the experienced management team and their ability to recruit top talent for the larger regional bank.
TCF Financial Corporation and Chemical Financial Corporation announced a merger of equals to create a premier Midwest bank called the New TCF. The new bank will have $46 billion in total assets, $6.1 billion market capitalization, and serve 1.5 million retail customers across its Midwest footprint. Management believes the merger combines the strengths of both banks and will accelerate value creation through $180 million in cost savings, a full-scale product offering, continued organic growth, and maintaining a strong risk culture. The new bank aims to drive improved returns through executing on its integration and growth strategies.
This document summarizes Principal Financial Group's fourth quarter 2018 earnings results. It provides key financial metrics including record full year 2018 non-GAAP operating earnings of $1.6 billion, up 8% over the prior year. It discusses significant variances that impacted 4Q18 results, including higher DAC amortization from equity market performance and lower than expected performance in Brazil. The document also provides details on the company's investment performance, asset management business results, and retirement and income solutions business results.
This document discusses LPL Financial's business opportunity and provides forward-looking statements and notices about non-GAAP financial measures. It highlights that LPL Financial is the leading financial services provider to independent advisors, RIAs, and financial institutions. Key messages are that LPL Financial's differentiated value proposition drives advisor growth, the scale of its advisory and brokerage offerings provides flexibility to manage change, and its financial performance demonstrates business growth and earnings potential. The document contains cautionary language about forward-looking statements and defines non-GAAP financial measures including adjusted earnings and adjusted EBITDA.
The document provides an overview of a presentation given by LPL Financial Holdings Inc. It includes statements regarding LPL's future plans and financial performance, as well as required disclosures around forward-looking statements and non-GAAP financial measures. The presentation focuses on LPL's strategy to capture opportunities by growing revenues, creating efficiencies through technology investments, enhancing its risk and compliance culture, and strengthening its financial performance.
- Canadian Tire Corporation reported strong third quarter results with consolidated revenue excluding petroleum increasing 1.8% and same store sales up 4.1%.
- Net income was $197.8 million, down from $219.9 million in the prior year which included a large property sale gain. Excluding this gain, EPS increased 6.6%.
- The retail segment saw improved gross margins across banners although income declined due to higher expenses. CT REIT income rose on property acquisitions.
- Financial services maintained revenue and margin growth despite increased expenses.
This document provides an overview and summary of Tribune Publishing Company's third quarter 2014 financial performance. Key points include:
- Total operating revenues decreased 4.7% to $404 million for Q3 2014 compared to the prior year.
- Total operating expenses increased 0.7% to $399.5 million for Q3 2014.
- Advertising revenues decreased 9.5% to $220.8 million for Q3 2014, driven by declines in retail, national, and classified advertising. Circulation revenues increased slightly by 1.2% to $107.5 million.
- Canadian Tire Corporation reported strong second quarter financial results, with consolidated revenue excluding petroleum increasing 4.5% and retail EBITDA growth of 11.2%.
- Same store sales increased 3.4% consolidated, with gains across core retail banners.
- Financial services income declined due to higher costs outpacing marginal revenue growth, though average account balances increased.
- Management remains focused on initiatives to drive productivity, IT capabilities, marketing/loyalty programs, and digital capabilities to support future growth.
Trilogy International Partners Inc. held an investor presentation in September 2019 to provide an overview of the company and its two main operating segments, 2degrees in New Zealand and NuevaTel in Bolivia. The summary discusses:
- 2degrees has seen strong double-digit revenue and subscriber growth in New Zealand in 2019. It operates in a stable three-player mobile market with opportunities for continued growth in postpaid subscribers and data adoption.
- NuevaTel closed a $100 million tower sale-leaseback agreement in Bolivia and launched fixed LTE services. The business is showing signs of stabilizing after pricing pressures and number portability issues impacted results in 2018.
- The presentation evaluates Trilogy
This document provides highlights from Aimia's Q1 2017 results, including forward-looking statements about certain financial metrics for 2017. Such statements involve assumptions and are subject to risks and uncertainties that could cause actual results to differ materially. It also contains non-GAAP financial measures and reconciliations to GAAP measures. The document cautions that the assumptions used to make forward-looking statements about 2017 may prove incorrect or inaccurate.
This document discusses LPL Financial's business model and opportunities for growth. It notes that LPL Financial is the leading independent broker-dealer and provides services to independent advisors, institutions, and retirement plans. It also highlights trends in the financial industry that are favorable for independent advisors and the growth opportunities these trends present for LPL Financial. Additionally, the document summarizes LPL Financial's financial performance and discusses the potential for increased earnings from a recovery in interest rates that would boost its cash sweep revenue.
- Canadian Tire Corporation reported strong first quarter 2016 financial results, with consolidated revenue excluding petroleum increasing 4.3% and retail EBITDA rising 8.8%.
- Same store sales increased 1.0% at Canadian Tire, 7.6% at FGL Sports, and 0.8% at Mark's.
- Financial Services income before taxes was down 7.1% for the quarter due to lower loan growth and number of active accounts, though investments are aimed at driving growth in the second half of 2016.
- Higher income was reported at the Retail and CT REIT segments, though Financial Services income declined and expenses increased across segments.
This document provides a summary of BMC Stock Holdings' third quarter 2018 earnings presentation. It discusses forward-looking statements regarding sales growth, earnings performance, and strategic direction. It also notes important risk factors that could impact actual results, such as economic conditions, industry pressures, commodity prices, and legal claims. Finally, it provides context on BMC's merger history and defines non-GAAP financial measures used in the presentation to analyze trends, performance, and for planning purposes.
BMC reported strong third quarter 2018 results, with net sales growth of 12.4% driven by increases in structural components and millwork, doors, and windows. Adjusted EBITDA grew 25.4% to $74.4 million due to higher prices absorbing costs and SG&A leverage. For full year 2018, BMC estimates net sales of $3.65-$3.73 billion and Adjusted EBITDA of $246-$254 million, reflecting continued growth and margin expansion.
Q2 2018 earnings call presentation as of 07 28-18 510 pmbmcstockholdings
BMC reported strong second quarter 2018 results, with net income growing $22.8 million to $40.4 million. Adjusted EBITDA was up $19.3 million to $78.8 million. The company saw growth in value-added components and improved profitability. BMC also highlighted strategic priorities around organic growth, operational excellence, building culture, and strategic expansion.
This document provides highlights from Aimia's Q4 2016 results, including forward-looking statements about Aimia's financial metrics and performance in 2017. It also defines and reconciles several non-GAAP financial measures used by Aimia to measure performance, such as adjusted EBITDA and free cash flow, noting that these measures are not comparable to similar measures used by other companies. Finally, it cautions that Aimia's forward-looking statements are based on assumptions that may prove to be incorrect and are subject to various risks and uncertainties.
Sem group earnings presentation 4q & full year-2018_finalSemGroupCorporation
Fourth Quarter and Full-Year 2018 Results Earnings Conference Call
In 3 sentences:
SemGroup reported adjusted EBITDA of $394 million for full-year 2018, an increase from $328 million in 2017. For 2019, SemGroup expects adjusted EBITDA between $420-465 million. SemGroup also provided 2019 capital expenditure guidance of $307 million, with $150 million allocated for growth projects in the U.S. and $230 million for the SemCAMS Midstream joint venture in Canada.
Sem group earnings presentation 4q & full year 2018 finalSemGroupCorporation
Fourth Quarter and Full-Year 2018 Results Earnings Conference Call February 27, 2019
The document discusses SemGroup's non-GAAP financial measures including Adjusted EBITDA, Cash Available for Dividends, and Total Segment Profit which are used to evaluate performance but are not substitutes for GAAP measures. It provides definitions and adjustments for each measure. The document also contains forward-looking statements regarding SemGroup's prospects, financial performance, annual dividend growth, and other matters which are subject to known and unknown risks that could cause actual results to differ.
- Principal Financial Group reported third quarter 2019 non-GAAP operating earnings of $345 million and earnings per share of $1.23.
- Results were impacted by an annual actuarial assumption review that lowered earnings by $39.8 million across business units. Higher expenses also lowered earnings by $10.7 million.
- The acquisition of Wells Fargo's retirement business closed on July 1st, adding $876 billion in assets under administration. Integration is on track.
This document highlights Aimia's Q2 2016 results and provides forward-looking statements about Aimia's financial metrics and performance in 2016. It cautions that these forward-looking statements are based on assumptions that may prove to be incorrect and are subject to various risks and uncertainties. It also notes that Aimia's actual results could differ materially from the forward-looking statements presented. The document defines various non-GAAP financial measures used by Aimia and refers readers to Aimia's MD&A for reconciliations of these measures to comparable GAAP measures.
Aimia reported its Q3 2016 highlights. Gross billings decreased 3.8% year-over-year but were down only 0.4% excluding foreign exchange impacts. Adjusted EBITDA increased to $60.5 million compared to $46.1 million in Q3 2015, with the margin expanding to 10.8% from 7.9%. Free cash flow before dividends paid was $86.7 million compared to $59 million driven by higher EBITDA, lower capital expenditures and tax refunds. On a trailing twelve-month basis, free cash flow per share increased over 20% to $0.55 compared to $0.67 in Q3 2015.
This document summarizes SemGroup's first quarter 2018 earnings conference call. It discusses SemGroup's non-GAAP financial measures of Adjusted EBITDA and Total Segment Profit, which exclude certain items to make performance more comparable between periods. The document also warns that non-GAAP measures have limitations and should not be considered in isolation as substitutes for GAAP measures. Additionally, the document contains forward-looking statements regarding SemGroup's 2018 operating budget, capital expenditures plan, and recent capital raising activities totaling around $800 million.
SemGroup reported fourth quarter and full-year 2017 results. Key highlights include $111 million in Adjusted EBITDA for Q4 and $328 million for the full year. SemGroup also executed several strategic transactions including a $350 million preferred equity raise, selling its interest in Glass Mountain Pipeline for $300 million, and estimated proceeds of $140 million from selling SemMaterials Mexico and SemLogistics assets. SemGroup provided 2018 Adjusted EBITDA guidance of $385-$415 million and capital expenditures guidance of $40 million for maintenance spending.
- Revenue increased 2.9% to $12.8 billion in Q2 2022, driven by same-store sales growth in food and drug retail. Operating income was $742 million.
- Adjusted EBITDA increased 9.3% to $1.5 billion in Q2 2022 due to margin expansion in drug retail and growth in higher margin categories.
- Net earnings available to common shareholders were $387 million or $1.16 per share, up from $375 million or $1.09 per share in Q2 2021, benefiting from improved retail performance, but offset by a $111 million tax-related charge for President's Choice Bank.
Q3 2015 Canadian Tire Corporation Earnings Conference Call PresentationInvestorCanadianTire
The document summarizes Canadian Tire Corporation's third quarter 2015 financial results. It reports that consolidated revenue increased 5.3% excluding petroleum, and diluted EPS grew 20.5%. Same-store sales increased at Canadian Tire, FGL Sports, and decreased slightly at Mark's. Financial Services saw growth in credit card receivables but a decline in income before taxes. The quarter also saw a dividend increase and an intent to repurchase shares by the end of 2016.
Aon plc reported third quarter 2018 results that showed continued positive performance across key metrics. Organic revenue growth was 6% in Q3 and 4% year-to-date, an acceleration from the prior year. Operating margin expanded 190 basis points to 18.5% in Q3 and 210 basis points year-to-date. Earnings per share grew 34% in Q3 and 29% year-to-date. The company is well positioned for long-term value creation through mid-single digit organic revenue growth, continued operating margin expansion, and double-digit free cash flow growth.
- Canadian Tire Corporation reported financial results for the fourth quarter and full year of 2015.
- Key highlights included strong revenue and earnings growth despite one less week of retail operations. Diluted EPS grew 23.3% in Q4 and 13.5% for the full year.
- Same store sales increased at Canadian Tire and FGL Sports but declined slightly at Mark's.
- Financial Services saw higher income from credit card receivables growth and lower allowance for future write-offs.
- The company will purchase up to 6.0 million shares through a normal course issuer bid.
Aon reported its second quarter 2018 results, with continued momentum across key metrics. Organic revenue grew 5% overall in Q2, driven by strong growth in Commercial Risk, Reinsurance, and Health solutions. Operating margin expanded 130 basis points in Q2, and earnings per share grew 31% year-over-year. Adjusted free cash flow grew 17% year-to-date, excluding impacts from restructuring initiatives. Aon is investing in innovation and a single operating model to drive further long-term growth and unlock significant shareholder value through increasing free cash flow and reducing shares outstanding.
QTS Realty Trust held a second quarter 2020 earnings presentation. Some key points:
- They signed $21M in new and modified leases, with an average rent per square foot of $548, a 24% increase over the prior four quarters.
- Their booked-not-billed backlog reached a record $111M, providing visibility into future growth.
- Same space renewal rates increased 2.6% in Q2, in line with expectations of low to mid-single digit increases.
- Churn for Q2 was 0.5% and 1.1% year-to-date, leading them to lower full-year churn guidance to 3-5% from 3-6
Sem group announces hfotco acquisition final presentationSemGroupCorporation
SemGroup acquired Houston Fuel Oil Terminal Company (HFOTCO) for $1.5 billion initially, with a second $600 million payment due by end of 2018. HFOTCO owns 330 acres and 16.8 million barrels of storage on the Houston Ship Channel with connections to major pipelines and refineries. The acquisition enhances SemGroup's scale and diversification with take-or-pay contracts from investment-grade customers. Growth projects are expected to increase HFOTCO's adjusted EBITDA to $180-190 million by 2019.
- Aon reported its first quarter 2018 results on May 4, 2018.
- Organic revenue growth was 4% in both 2017 and 2016, up from 3% in 2015 and 2014, showing accelerating growth.
- The divestiture of outsourcing businesses provided $3 billion in capital to invest in high-growth, high-margin areas and further aligns the portfolio around clients' priorities.
The document provides an overview of Canadian Tire Corporation's financial results for the fourth quarter and full year of 2016. It highlights that the company achieved strong revenue growth, improved gross margins, and higher diluted earnings per share compared to the prior year periods. It also notes solid performance from the Financial Services segment. The document contains forward-looking statements and identifies risks that could affect the company's actual results.
Aon plc reported strong fourth quarter and full year 2015 results across key metrics such as organic revenue growth, operating margin, earnings per share (EPS), and free cash flow. Organic revenue grew 5% in Risk Solutions and 4% in HR Solutions. Operating margin increased in both segments driven by organic revenue growth and investments in data and analytics. EPS grew 20% through strong operating performance and capital management. Free cash flow reached a record high of $1.7 billion due to improved cash flow from operations and working capital.
Aon plc reported third quarter 2015 results with the following highlights:
- Solid organic revenue growth of 1% in Risk Solutions and 5% in HR Solutions despite macroeconomic challenges.
- Operating margin increased 50 basis points in Risk Solutions and 90 basis points in HR Solutions.
- EPS grew 9% excluding impacts of foreign exchange and a one-time gain in prior year, driven by operational improvements.
- Year-to-date free cash flow grew 22% from improved working capital and lower pension/restructuring payments, partly offset by higher capital expenditures.
- Canadian Tire Corporation reported strong first quarter results for 2017, with consolidated revenue increasing 6.0% compared to the same period last year.
- Retail EBITDA grew 30.5% due to higher revenue and gross margin at Canadian Tire and Mark's. Diluted EPS increased 37.8% year-over-year.
- Same store sales were up 0.3% consolidated, with Canadian Tire up 0.5% and Mark's up 5.4%, while FGL Sports declined 2.7%.
- Financial Services delivered solid results with 5.8% growth in average credit card receivables and increased income before taxes.
May investor presentation earnings only 05 07-18 440 pmbmcstockholdings
BMC reported strong financial results in the first quarter of 2018, with net income growing $11.6 million to $15.4 million compared to the first quarter of 2017. Adjusted EBITDA increased $13.6 million to $47.2 million, driven by a 10.1% increase in total net sales. Gross profit dollars and margins improved due to a focus on value-added components and operational excellence initiatives. Management remains focused on unlocking productivity and efficiency to continue delivering profitable growth.
Aon plc reported strong financial results for the fourth quarter and full year of 2016. Some key highlights include:
- Organic revenue growth of 3% in both segments for the fourth quarter driven by growth across regions and businesses.
- Record operating margins of 26.2% for Risk Solutions and 20.8% for HR Solutions in the fourth quarter due to organic revenue growth and expense discipline.
- Double digit earnings growth of 13% for the fourth quarter and 7% for the full year 2016 driven by strong operating performance and capital management initiatives.
- Record free cash flow of $2.1 billion for 2016, a 22% increase over 2015, demonstrating effective cash generation.
This document summarizes SemGroup's second quarter 2018 earnings conference call. It discusses non-GAAP financial measures used by SemGroup like Adjusted EBITDA, Cash Available for Dividends, and Total Segment Profit. It provides definitions of these terms and notes that they are not substitutes for GAAP measures but are used by management to evaluate performance. The document also contains forward-looking statements about SemGroup's prospects, plans, and financial performance that are based on current expectations and assumptions which involve risks and uncertainties.
- SemGroup reported a 40% increase in Adjusted EBITDA for the third quarter compared to the second quarter due to the Maurepas Pipeline becoming fully operational and the acquisition of HFOTCO commencing in mid-July.
- SemGroup's strategic focus is on growing EBITDA through increased secure cash flows from core geographic regions like Canada, the Mid-Continent region, and the Gulf Coast.
- SemGroup is making progress on raising the $600 million needed for the second payment for the HFOTCO acquisition, with plans to fully pay by the end of the first quarter of 2018 to capture an early payment discount, including through the sale of its interest in the Glass Mountain Pipeline for $
The document summarizes DuPont's first quarter 2016 earnings conference call. Some key points:
- Operating earnings per share were flat at $1.26 compared to the previous year, but were up 8% excluding currency impacts. GAAP earnings per share grew 25%.
- Segment operating earnings declined 5% due to negative currency impacts of -4% and lower volumes of -2%.
- Lower corporate expenses and shares outstanding offset lower segment results and a higher tax rate to keep operating EPS flat.
- Segment results were negatively impacted by $0.10 per share from currency translation.
- Aon plc reported third quarter 2016 results with solid organic revenue growth and free cash flow.
- Risk Solutions organic revenue grew 3% and HR Solutions grew 4%, with 5% growth in both Americas Retail Brokerage and Outsourcing.
- Operating margin for Risk Solutions increased slightly due to revenue growth and foreign exchange impact, while HR Solutions margin declined due to legacy contract costs and portfolio repositioning.
- Earnings per share improved 4% through effective capital management and operational improvements. Year-to-date free cash flow increased 24% on strong cash flow from operations and lower capital expenditures.
The document discusses SemGroup's non-GAAP financial measures of Adjusted EBITDA, Cash Available for Dividends (CAFD) and Total Segment Profit. It explains that Adjusted EBITDA removes certain selected items from net income to improve comparability between periods and includes a list of the types of items generally excluded. CAFD is based on Adjusted EBITDA less certain cash payments to analyze performance after obligations. Total Segment Profit represents revenue less costs and expenses, adjusted for certain items, and is how management assesses segment performance. The measures are used by management and may be presented to investors but have limitations as analytical tools.
Best practices for project execution and deliveryCLIVE MINCHIN
A select set of project management best practices to keep your project on-track, on-cost and aligned to scope. Many firms have don't have the necessary skills, diligence, methods and oversight of their projects; this leads to slippage, higher costs and longer timeframes. Often firms have a history of projects that simply failed to move the needle. These best practices will help your firm avoid these pitfalls but they require fortitude to apply.
3 Simple Steps To Buy Verified Payoneer Account In 2024SEOSMMEARTH
Buy Verified Payoneer Account: Quick and Secure Way to Receive Payments
Buy Verified Payoneer Account With 100% secure documents, [ USA, UK, CA ]. Are you looking for a reliable and safe way to receive payments online? Then you need buy verified Payoneer account ! Payoneer is a global payment platform that allows businesses and individuals to send and receive money in over 200 countries.
If You Want To More Information just Contact Now:
Skype: SEOSMMEARTH
Telegram: @seosmmearth
Gmail: seosmmearth@gmail.com
Building Your Employer Brand with Social MediaLuanWise
Presented at The Global HR Summit, 6th June 2024
In this keynote, Luan Wise will provide invaluable insights to elevate your employer brand on social media platforms including LinkedIn, Facebook, Instagram, X (formerly Twitter) and TikTok. You'll learn how compelling content can authentically showcase your company culture, values, and employee experiences to support your talent acquisition and retention objectives. Additionally, you'll understand the power of employee advocacy to amplify reach and engagement – helping to position your organization as an employer of choice in today's competitive talent landscape.
How are Lilac French Bulldogs Beauty Charming the World and Capturing Hearts....Lacey Max
“After being the most listed dog breed in the United States for 31
years in a row, the Labrador Retriever has dropped to second place
in the American Kennel Club's annual survey of the country's most
popular canines. The French Bulldog is the new top dog in the
United States as of 2022. The stylish puppy has ascended the
rankings in rapid time despite having health concerns and limited
color choices.”
How to Implement a Strategy: Transform Your Strategy with BSC Designer's Comp...Aleksey Savkin
The Strategy Implementation System offers a structured approach to translating stakeholder needs into actionable strategies using high-level and low-level scorecards. It involves stakeholder analysis, strategy decomposition, adoption of strategic frameworks like Balanced Scorecard or OKR, and alignment of goals, initiatives, and KPIs.
Key Components:
- Stakeholder Analysis
- Strategy Decomposition
- Adoption of Business Frameworks
- Goal Setting
- Initiatives and Action Plans
- KPIs and Performance Metrics
- Learning and Adaptation
- Alignment and Cascading of Scorecards
Benefits:
- Systematic strategy formulation and execution.
- Framework flexibility and automation.
- Enhanced alignment and strategic focus across the organization.
❼❷⓿❺❻❷❽❷❼❽ Dpboss Matka Result Satta Matka Guessing Satta Fix jodi Kalyan Final ank Satta Matka Dpbos Final ank Satta Matta Matka 143 Kalyan Matka Guessing Final Matka Final ank Today Matka 420 Satta Batta Satta 143 Kalyan Chart Main Bazar Chart vip Matka Guessing Dpboss 143 Guessing Kalyan night
Taurus Zodiac Sign: Unveiling the Traits, Dates, and Horoscope Insights of th...my Pandit
Dive into the steadfast world of the Taurus Zodiac Sign. Discover the grounded, stable, and logical nature of Taurus individuals, and explore their key personality traits, important dates, and horoscope insights. Learn how the determination and patience of the Taurus sign make them the rock-steady achievers and anchors of the zodiac.
Easily Verify Compliance and Security with Binance KYCAny kyc Account
Use our simple KYC verification guide to make sure your Binance account is safe and compliant. Discover the fundamentals, appreciate the significance of KYC, and trade on one of the biggest cryptocurrency exchanges with confidence.
[To download this presentation, visit:
https://www.oeconsulting.com.sg/training-presentations]
This PowerPoint compilation offers a comprehensive overview of 20 leading innovation management frameworks and methodologies, selected for their broad applicability across various industries and organizational contexts. These frameworks are valuable resources for a wide range of users, including business professionals, educators, and consultants.
Each framework is presented with visually engaging diagrams and templates, ensuring the content is both informative and appealing. While this compilation is thorough, please note that the slides are intended as supplementary resources and may not be sufficient for standalone instructional purposes.
This compilation is ideal for anyone looking to enhance their understanding of innovation management and drive meaningful change within their organization. Whether you aim to improve product development processes, enhance customer experiences, or drive digital transformation, these frameworks offer valuable insights and tools to help you achieve your goals.
INCLUDED FRAMEWORKS/MODELS:
1. Stanford’s Design Thinking
2. IDEO’s Human-Centered Design
3. Strategyzer’s Business Model Innovation
4. Lean Startup Methodology
5. Agile Innovation Framework
6. Doblin’s Ten Types of Innovation
7. McKinsey’s Three Horizons of Growth
8. Customer Journey Map
9. Christensen’s Disruptive Innovation Theory
10. Blue Ocean Strategy
11. Strategyn’s Jobs-To-Be-Done (JTBD) Framework with Job Map
12. Design Sprint Framework
13. The Double Diamond
14. Lean Six Sigma DMAIC
15. TRIZ Problem-Solving Framework
16. Edward de Bono’s Six Thinking Hats
17. Stage-Gate Model
18. Toyota’s Six Steps of Kaizen
19. Microsoft’s Digital Transformation Framework
20. Design for Six Sigma (DFSS)
To download this presentation, visit:
https://www.oeconsulting.com.sg/training-presentations
B2B payments are rapidly changing. Find out the 5 key questions you need to be asking yourself to be sure you are mastering B2B payments today. Learn more at www.BlueSnap.com.
The APCO Geopolitical Radar - Q3 2024 The Global Operating Environment for Bu...APCO
The Radar reflects input from APCO’s teams located around the world. It distils a host of interconnected events and trends into insights to inform operational and strategic decisions. Issues covered in this edition include:
How MJ Global Leads the Packaging Industry.pdfMJ Global
MJ Global's success in staying ahead of the curve in the packaging industry is a testament to its dedication to innovation, sustainability, and customer-centricity. By embracing technological advancements, leading in eco-friendly solutions, collaborating with industry leaders, and adapting to evolving consumer preferences, MJ Global continues to set new standards in the packaging sector.
How to Implement a Real Estate CRM SoftwareSalesTown
To implement a CRM for real estate, set clear goals, choose a CRM with key real estate features, and customize it to your needs. Migrate your data, train your team, and use automation to save time. Monitor performance, ensure data security, and use the CRM to enhance marketing. Regularly check its effectiveness to improve your business.
2. Cautionary Statements for the Purposes of Safe
Harbor Provisions of the Securities Litigation
Reform Act
Any statements contained in this presentation regarding the outlook for the Corporation's businesses and their respective markets, such as projections of future performance, targets,
guidance, statements of the Corporation's plans and objectives, forecasts of market trends and other matters are forward-looking statements based on the Corporation's assumptions and
beliefs. Such statements may be identified by such words or phrases as "will likely result," "are expected to," "will continue," "outlook," "will benefit," "is anticipated," "estimate," "project,"
"management believes" or similar expressions. These forward-looking statements are subject to certain risks and uncertainties that could cause actual results to differ materially from those
discussed in such statements, and no assurance can be given that the results in any forward-looking statement will be achieved. For these statements, TCF claims the protection of the
safe harbor for forward-looking statements contained in the Private Securities Litigation Reform Act of 1995. Any forward-looking statement speaks only as of the date on which it is made,
and we disclaim any obligation to subsequently revise any forward-looking statement to reflect events or circumstances after such date or to reflect the occurrence of anticipated or
unanticipated events.
This presentation also contains forward-looking statements regarding TCF’s outlook or expectations with respect to the merger and integration with Chemical Financial Corporation
(“Chemical”). Examples of forward-looking statements include, but are not limited to, statements regarding outlook and expectations with respect to strategic and financial benefits of the
merger, including the expected impact of the transaction on TCF’s future financial performance (including anticipated accretion to earnings per share, the tangible book value earn-back
period and other operating and return metrics), the expected costs to be incurred in connection with the merger, and operational aspects of post-merger integration.
Certain factors could cause the Corporation's future results to differ materially from those expressed or implied in any forward-looking statements contained herein. These factors include
the factors discussed in Part I, Item 1A of the Corporation’s Annual Report on Form 10-K for the year ended December 31, 2018 under the heading "Risk Factors" or otherwise disclosed
in documents filed or furnished by the Corporation with or to the SEC after the filing of such Annual Report on Form 10-K, the factors discussed below, and any other cautionary statements,
written or oral, which may be made or referred to in connection with any such forward-looking statements. Since it is not possible to foresee all such factors, these factors should not be
considered as complete or exhaustive: deterioration in general economic, political and banking industry conditions; cyber-security breaches, hacking, denial of service, security breaches,
loss or theft of information, or other cyber-attacks that disrupt TCF’s business operations or damage its reputation; fluctuation in interest rates that result in decreases in the value of assets
or a mismatch between yields earned on TCF's interest-earning assets and the rates paid on its deposits and borrowings; lack of access to liquidity; inability to grow deposits, increase
earnings and revenue, manage operating expenses, or pay and receive dividends; adverse effects related to competition from traditional competitors, non-bank providers of financial
services and new technologies; soundness of other financial institutions and other counterparty risk, including the risk of default, operational disruptions, security breaches, or diminished
availability of counterparties who satisfy our credit quality requirements; adverse developments affecting TCF's branches, including supermarket branches; risks related to developing new
products, markets or lines of business; adverse changes in monetary, fiscal or tax policies; heightened consumer protection, supervisory or regulatory practices or requirements; deficiencies
in TCF's compliance programs or risk mitigation frameworks; the effect of any negative publicity or reputational damage; technological or operational difficulties; failure to keep pace with
technological change, including with respect to customer demands or system upgrades; risks related to TCF's loan sales activity; dependence on accurate and complete information from
customers and counterparties; the failure to attract and retain key employees; inability to successfully execute on TCF's growth strategy through acquisitions or expanding existing business
relationships; changes in accounting standards or interpretations of existing standards; adverse federal, state or foreign tax assessments; litigation or government enforcement actions;
ineffective internal controls; and the effects of man-made and natural disasters, any of which may negatively affect our operations and/or our customers.
Use of Non-GAAP Financial Measures
Management uses the adjusted net income, adjusted diluted earnings per common share, adjusted ROAA, adjusted ROACE, ROATCE, adjusted ROATCE, adjusted efficiency ratio,
adjusted net interest income, net interest margin (FTE), net interest margin (FTE), adjusted net interest margin (FTE), adjusted noninterest income, adjusted noninterest expense, tangible
book value per common share and tangible common equity to tangible assets internally to measure performance and believes that these financial measures not recognized under generally
accepted accounting principles in the United States ("GAAP") (i.e. non-GAAP) provide meaningful information to investors that will permit them to assess the Corporation's capital and
ability to withstand unexpected market or economic conditions and to assess the performance of the Corporation in relation to other banking institutions on the same basis as that applied
by management, analysts and banking regulators. TCF adjusts certain results to exclude merger-related expenses and notable items in addition to presenting net interest income and net
interest margin (FTE) excluding purchase accounting accretion and amortization. Management believes these measures are useful to investors in understanding TCF's business and
operating results.
These non-GAAP financial measures are not defined by GAAP and other entities may calculate them differently than TCF does. Non-GAAP financial measures have inherent limitations
and are not required to be uniformly applied. Although these non-GAAP financial measures are frequently used by stakeholders in the evaluation of a corporation, they have limitations as
analytical tools and should not be considered in isolation or as a substitute for analyses of results as reported under GAAP. In particular, a measure of earnings that excludes selected
items does not represent the amount that effectively accrues directly to shareholders.
2
3. Fourth Quarter Results Driven by MOE Integration
and Execution of Core Business Initiatives
3
Diluted
EPS
Efficiency
Ratio
ROATCE1
$0.72
Reported
$1.04
Adjusted1
73.5%
Reported
58.5%
Adjusted1
11.4%
Reported
16.3%
Adjusted1
1
Denotes a non-GAAP financial measure; see Appendix for "Non-GAAP Reconciliation" slides
2
Based on combined historical TCF and Chemical reported financials
3
Excluding $4.7M recovery from consumer nonaccrual/TDR loan sale, net charge-off ratio would have been 13 bps and provision would have been $19M;
see Appendix for "Non-GAAP Reconciliation" slides
11.0%
CET1 Ratio
$27.5M
Cost of shares
repurchased during 4Q19
658K
Shares repurchased
during 4Q19
ROACE
8.0%
Reported
11.6%
Adjusted1
MOE Integration
on Track
2.9%
Growth QoQ
11.8%
Growth QoQ
(annualized)
9.9%
Commercial growth
YoY2
Executed on
Business Initiatives
Robust HFI Loan
Growth Trends
Strong Credit
Performance
Capital Position
Provides Optionality
<$321M
On track to achieve
4Q20 NIE target
• Consolidated to a single mortgage lending platform
• Integrated commercial loan origination system
$1.1B
Sold Legacy TCF auto
finance portfolio
7 bps
Net charge-off ratio3
0.49%
Nonaccrual loans and
leases as a percentage of
total loans and leases
$14M
Provision for credit losses3
• Added key commercial banking leaders to build out Chicago C&I
strategy
• Announced divestiture of 7 Arizona branch locations in January
2020, emphasizing focus on core Midwest and Colorado markets
4. Merger of Equals Integration Remains on Track
4
• Completed consolidation onto a single mortgage lending
platform
• Integrated commercial loan origination system for corporate
banking and middle market, allowing for improved efficiency
and turnaround times
• Implemented combined benefits plan
• Launched company-wide learning management system for
all team members learning and development needs
• Over 35% of vendor contracts have been renegotiated
Recent MOE Actions
• Publish new Purpose and Beliefs statement in 1Q20
• Begin transitioning Legacy Chemical customers onto TCF
digital banking platform
• Various waves of system roll-outs prior to final systems
conversion in 3Q20
• Continuation of staffing optimizations
• Execution of business synergy initiatives
Upcoming Priorities
5. 4Q19 Loan and Lease Highlights
6.6% YoY growth, excluding Legacy TCF Auto1
4Q18 3Q19 4Q19
$32.3
$33.5 $34.5$34.3
Loan Growth Driven by Commercial Portfolio
5
HFI Loans and Leases ($ billions)
1
Total period-end loans and leases of $34.5B, up $0.2B or 0.5% YoY
2
Combined TCF and Chemical reported financials
3
Annualized and presented on a fully tax-equivalent basis
4
Excludes the Legacy TCF auto finance portfolio at 12/31/18, which had a balance of $2.0B
Legacy TCF Auto
TCF/Chemical
Combined 2
Loans and Leases (ex. Legacy TCF Auto)
$2.0
• $499M of C&I growth QoQ
• 4Q19 loan and lease yield of 5.24%3
, down 38 bps from
3Q19, impacted by:
◦ Full-quarter of Chemical loan and lease balances
◦ Full-quarter impact of September 2019 rate cut
and the incremental October rate cut
HFI Loan and Lease Growth Drivers ($ billions)
YoY Change2
(Dollars in billions)
Dec. 31,
2019 $ %
Commercial and industrial $ 11.3 $ 1.1 10.6%
Commercial real estate 9.3 0.9 10.1
Lease financing 2.7 0.2 6.7
Total commercial 23.3 2.2 9.9
Residential mortgage 6.2 0.4 6.6
Consumer installment 1.5 — —
Legacy TCF auto finance — (2.0) (100)
Home equity 3.5 (0.4) (9.2)
Total consumer 11.2 (2.0) (14.8)
HFI loans and leases $ 34.5 $ 0.2 0.5
HFI loans and leases, ex. TCF
auto finance4
$ 34.5 $ 2.2 6.6
$1.0B of commercial
loan and lease growth
in 4Q19
3Q19 C&I CRE Lease
financing
Consumer 4Q19
$33.5
$0.5
$0.4 $0.1 $0.0 $34.5
6. 4Q18 3Q19 4Q19
$25.6 $26.9 $27.0
$8.9
$34.5
$8.4
$35.3
$7.5
$34.5
4Q19 Deposit Highlights
TCF/Chemical
Combined2
Disciplined Deposit Pricing with Improved Mix
6
Deposit Growth ($ billions)
CDs
Deposits
(ex. CDs)
• Total deposits down $818M QoQ driven by the seasonal
decline of municipal deposits and the proactive run-off of
higher cost funding through balance sheet management
strategies, including the sale of the Legacy TCF auto
finance portfolio:
◦ CDs down $930M including $402M of brokered
CD run-off
Cost of Deposits Down 6 bps from 3Q193
4Q19 Deposit Cost Highlights
YoY non-CD growth of 5%1
1
Total period-end deposits of $34.5B, down $29M or 0.1% YoY
2
Combined TCF and Chemical reported financials
3
Annualized
• CDs as a percentage of total deposits declined to
22% from 24% at September 30, 2019
• Cost of CDs of 1.97%, down 10 bps from 3Q19
• Cost of deposits (ex. CDs) of 0.57%, down 1 bp from
3Q19
• Short duration CD portfolio with 70% maturing over
the next six months with an average rate of 2.11%
4Q18 1Q19 2Q19 3Q19 4Q19
0.79%
0.90%
0.95%
0.94%
0.88%
TCF/Chemical Combined2
7. 4Q19 Investment Securities Highlights
2Q19 3Q19 4Q19
$5.7
$6.9$7.2
2.81% 2.84%
67%
10%
13%
10%
Reinvesting in the Investment Securities Portfolio
7
Investment Securities Balances ($ billions)
• Purchased investment securities in 4Q19 with an average
tax-equivalent yield of 2.71%2
, compared to the 3Q19
purchase yield of 2.63%2
and the weighted average yield
of securities sold in 3Q19 of 2.43%
• $170M remaining to redeploy from 3Q19 securities sale of
$1.6B
Investment Securities Mix (4Q19)
$7B
4.1 Years
duration at
December 31, 2019
1
Combined TCF and Chemical reported financials
2
Annualized and presented on a fully tax-equivalent basis
Obligations of states
and political
subdivisions
$0.9B
Agency
CMBS
$0.7B
Other
$0.7B
Agency
MBS
$4.7B
TCF/Chemical
Combined1
96%
AA and AAA rated
Yield2
12.5%
of total assets
14.7%
of total assets
15.3%
of total assets
Investment Securities Portfolio Attributes (4Q19)
8. 3Q19 Sept. 2019
Month Actual
4Q19
3.83% 3.70% 3.60%
0.31%
4.14%
0.40%
4.10%
0.29%
3.89%
Net Interest Income and Net Interest Margin
Impacted by Purchase Accounting Accretion
8
Net Interest Income ($ millions)
Purchase Accounting Accretion
Net Interest Margin2
1
Stub period reflects Legacy TCF July 2019 NII plus New TCF August/September 2019 NII
2
Annualized and presented on a fully tax-equivalent basis; see Appendix for "Non-GAAP Reconciliation" slides
3
Denotes a non-GAAP financial measure; see Appendix for "Non-GAAP Reconciliation" slides
Purchase Accounting Accretion
Stub Period1
Stub Period1
4Q19 Net Interest Income and Net Interest Margin Highlights
• Net interest income growth from 3Q19 impacted by 3Q19 stub period financials
• Net interest margin (FTE) impacted by full quarter of Chemical balance sheet
3 3 3
3Q19 Sept. 2019
Month Actual
4Q19
$343
$128
$378
$28
$371
$15
$143
$31
$409
9. 4Q19 Noninterest Income Highlights
4Q18 1Q19 3Q19 4Q19
$94
$158
$156
$129
$35
$129
$8
$166
Leasing Fees and
Service
Charges on
Deposits
Accounts
Card and
ATM
Net Gains
on Sales of
Loans and
Leases
Servicing
Fees
Wealth
Management
Other
$47
$39
$25
$13
$6 $6
$22
A More Diverse Noninterest Income Mix
9
Noninterest Income ($ millions)
Notable Items
Noninterest Income Mix ($ millions) (4Q19)
1
Denotes a non-GAAP financial measure; see Appendix for "Non-GAAP Reconciliation" slides
2
Noninterest income notable items reflected a loss of $35.2M and $7.6M in 3Q19 and 4Q19, respectively
3
Combined TCF and Chemical reported financials
4
Stub period reflects Legacy TCF July 2019 noninterest income plus NewTCF August/September 2019 noninterest income
2
TCF/Chemical Combined3
• 4Q19 includes $7.6M of notable items including an $8.2M loss on sale of the Legacy TCF auto finance
portfolio and a $0.6M recovery of prior loan servicing rights impairment
• Net gains on sales of loans and leases included $3.7M gain related to a nonaccrual and TDR loan sale
• Other noninterest income included a $2.4M favorable interest rate swap mark-to-market adjustment
• 4Q19 is typically a seasonally high quarter for leasing noninterest income
• Noninterest income growth from 3Q19 (excluding notable items) impacted by 3Q19 stub period financials
2
Stub Period4
1
1
10. • 4Q19 includes $47.0M of merger-related expenses and $14.5M of notable items including the pension fair valuation
adjustment ($6.3M), impact of the sale of Legacy TCF auto finance portfolio ($4.7M) and branch exit costs ($3.5M)
• 4Q19 also includes $9.4M of expenses related to:
◦ $4.0M impairment of historic income tax credits (more than offset by $3.6M income tax benefit related to the
same tax credits)
◦ $1.3M branch impairment
◦ $4.1M higher commissions expense compared to 3Q19, driven by 4Q19 originations
4Q18 4Q19 4Q20
NIE Target
$358
$355
$47
$417
4Q19 Noninterest Expense Highlights
Focus on Delivering on Cost Synergy Commitment
Noninterest Expense ($ millions)
1
Combined TCF and Chemical reported financials
2
Noninterest expense notable items reflected expenses of $5.9M and $14.5M in 3Q19 and 4Q19, respectively
3
Denotes a non-GAAP financial measure; see Appendix for "Non-GAAP Reconciliation" slides
4
Source: S&P Global Market Intelligence (peer data as of 3Q19; TCF data as of 4Q19)
5
Financial targets compared to TCF Peer Group which includes KEY, RF, MTB, FRC, HBAN, CMA, ZION, PBCT, CIT, SNV, EWBC, FHN, FCNC.A, FNB, ASB, BKU, VLY and IBKC. ROATCE and
adjusted efficiency ratio are non-GAAP financial measures. A reconciliation of the ROATCE and adjusted efficiency ratio targets to the most directly comparable GAAP measure is not provided because
the Corporation is unable to provide such reconciliation without unreasonable effort, however, it is expected to be consistent with historical non-GAAP reconciliation included in the appendix.
Merger-related expenses
Notable items
$152
3
<$321
Driving Toward Below Peer Median Efficiency
4Q19 4Q19
Adjusted
3Q19 Peer
Median
73.5%
58.5%
56.5%
3 4
Post-Cost Savings
Adjusted Efficiency Ratio Target5
:
Below Peer Median
TCF/Chemical
Combined1
10
11. 3Q19 4Q19
$121 $113
0.36% 0.33%
2Q19 3Q19 4Q19
$16
$29
$6
$21
$27
$14
0.18%
0.39%
0.07%
3Q19 4Q19
0.09% 0.09%
3Q19 4Q19
$182 $170
0.54%
0.49%
Credit Quality Trends Remain Strong
11
1
Annualized
2
Includes $4.7M recovery from consumer nonaccrual/TDR loan sale. Excluding the recovery, 4Q19 net charge-offs were $11M, NCO ratio was 0.13% and provision for credit
losses was $19M (see Appendix for "Non-GAAP Reconciliation" slides)
3
Combined TCF and Chemical reported financials
4
Excludes nonaccrual loans and leases
Net Charge-offs and Provision ($ millions) Allowance for Loan and Lease Losses ($ millions)
Over 90-Day Delinquencies4
Nonaccrual Loans and Leases ($ millions)
Net charge-offs Provision for credit losses
Net charge-offs / average loans and leases1
ALLL / total loans and leases
Nonaccrual loans and leases
Nonaccrual loans and leases / total loans and leases
2
TCF/Chemical
Combined 3
12. Strong Capital Position
12
Capital Priorities
Organic Growth
Ample opportunities for growth given complementary business
platforms and adjacent markets
Dividends
Dividend payout ratio target of 30% - 40%
Share Repurchases
Evaluate share repurchases based on excess capital after organic
growth and dividends
Corporate Development
Remain disciplined for opportunities including whole banks, lending or
deposit platforms, or portfolios
CET1 Ratio
(Near-term Target)
~10.0%
CET1 Ratio
(4Q19)
11.0%
ROATCE
(Post-Cost Savings Target)1
Top-Quartile2
1
ROATCE is a non-GAAP financial measure. A reconciliation of the ROATCE target to the most directly comparable GAAP measure is not provided because the Company is unable
to provide such reconciliation without unreasonable effort, however it is expected to be consistent with the historical non-GAAP reconciliation included in the appendix
2
Compared to TCF's Peer Group including KEY, RF, MTB, FRC, HBAN, CMA, ZION, PBCT, CIT, SNV, EWBC, FHN, FCNC.A, FNB, ASB, BKU, VLY and IBKC
Repurchased 658K shares of common stock in 4Q19 at a cost of $27.5M
($122.5M remaining under current share repurchase program)
13. 3Q19 Peer
Median
4Q19 TCF
Adjusted
4Q19 TCF
Reported
56.5%
58.5%
73.5%
4Q19 TCF
Adjusted
3Q19 Peer
Top Quartile
4Q19 TCF
Reported
16.3%
15.8%
11.4%
Driving Shareholder Value Through
Strong Returns and Efficiencies
We believe ROATCE and Efficiency Ratio are aligned with shareholder value creation
Targeting Strong Performance Relative to Peer Banks1
13
1
Source: S&P Global Market Intelligence (peer data as of 3Q19; TCF data as of 4Q19)
2
Financial targets compared to TCF Peer Group which includes KEY, RF, MTB, FRC, HBAN, CMA, ZION, PBCT, CIT, SNV, EWBC, FHN, FCNC.A, FNB, ASB, BKU, VLY and IBKC. ROATCE and
adjusted efficiency ratio are non-GAAP financial measures. A reconciliation of the ROATCE and adjusted efficiency ratio targets to the most directly comparable GAAP measure is not provided because
the Company is unable to provide such reconciliation without unreasonable effort, however, it is expected to be consistent with historical non-GAAP reconciliation included in the appendix.
3
Denotes a non-GAAP financial measure; see Appendix for “Non-GAAP Reconciliation” slides
Efficiency Ratio (%) ROATCE (%)3
Post-MOE Cost
Savings Adjusted
Efficiency Ratio Target2
Below Peer Median
Post-MOE
Cost Savings
Adjusted
ROATCE Target2
Top-Quartile
3
3
15. (Dollars in thousands, except per share data)
4Q19
Reported
Merger-
related
Items Notable Items
4Q19
Adjusted1
Net interest income $ 408,753 $ — $ — $ 408,753
Provision for credit losses 14,403 — — 14,403
Noninterest income: —
Net gains (losses) on sales of loans and leases 12,934 — (8,194) (2) 21,128
Other noninterest income 22,123 — 638 (3) 21,485
All other noninterest income line items 122,995 — — 122,995
Total noninterest income 158,052 — (7,556) 165,608
Noninterest expense:
Compensation and employee benefits 180,969 — (930) (4) 180,039
Occupancy and equipment 56,771 — (1,543) (4) 55,228
Merger-related expenses 47,025 (47,025) — —
Other noninterest expense 108,935 — (12,032) (5) 96,903
All other noninterest expense line items 22,871 — — 22,871
Total noninterest expense 416,571 (47,025) (14,505) 355,041
Income before income tax expense 135,831 (47,025) (22,061) 204,917
Income tax expense (benefit) 21,375 (10,966) (8,938) (6) 41,279
Income after income tax expense 114,456 (36,059) (13,123) 163,638
Income attributable to non-controlling interest 2,057 — — 2,057
Net income attributable to TCF 112,399 (36,059) (13,123) 161,581
Preferred stock dividends 2,494 — — 2,494
Net income available to common shareholders $ 109,905 $ (36,059) $ (13,123) $ 159,087
Diluted earnings per share $ 0.72 $ (0.24) $ (0.08) $ 1.04
Average diluted common shares outstanding 152,658,766 — — 152,658,766
Return on average assets 0.99% 1.42%
Return on average common equity 8.00% 11.57%
Return on average tangible common equity1
11.35% 16.25%
Efficiency ratio(7)
73.49% 58.51%
Impact of 4Q19 Merger-related Expenses
and Notable Items
15
1
Denotes a non-GAAP financial measure; see Appendix for "Reconciliation of GAAP to Non-GAAP Financial Measures" slides
2
Includes a portion of the loss on sale of Legacy TCF auto finance portfolio.
3
Includes recovery of loan servicing rights impairment.
4
Includes expenses related to the Legacy TCF auto finance portfolio sale.
5
Includes a $1.5M loss related to the Legacy TCF auto finance portfolio sale, $3.5M of branch exit costs, and a $6.3M pension fair valuation adjustment.
6
Includes a tax basis benefit adjustment ($3.8M) and income tax benefit based on TCF's normal tax rate on pretax notable items
7
Adjusted efficiency ratio also excludes lease financing equipment depreciation, other intangible amortization, impairment of historic income tax credits and net interest income FTE adjustment.
16. Non-GAAP Reconciliation
16
Computation of adjusted diluted earnings per common share: Quarter Ended
Dec. 31, Sep. 30,
(Dollars in thousands, except per share data) 2019 2019
Earnings allocated to common stock (a) $ 109,905 $ 19,654
Merger-related expenses 47,025 111,259
Notable items:
Sale of legacy TCF auto finance portfolio(1)
12,864 19,264
Termination of interest rate swaps(2)
— 17,302
Gain on sales of certain investment securities(3)
— (5,869)
Write-down of company-owned vacant land parcels and branch exit costs(4)
3,494 5,890
Pension fair valuation adjustment(4)
6,341 —
Loan servicing rights (recovery) impairment(2)
(638) 4,520
Total notable items 22,061 41,107
Related income tax expense, net of benefits(5)
(19,904) (46,213)
Total adjustments, net of tax 49,182 106,153
Adjusted earnings allocated to common stock (b) $ 159,087 $ 125,807
Weighted-average common shares outstanding used in diluted earnings per
common share calculation (c) 152,658,766 128,754,588
Diluted earnings per common share (a) / (c) $ 0.72 $ 0.15
Adjusted diluted earnings per common share (b) / (c) 1.04 0.98
(1) Included within Net (loss) gain on sales of loans and leases ($8.2 million), other noninterest expense ($2.2 million), occupancy and equipment ($1.5 million) and compensation and
employee benefits ($0.9 million)
(2) Included within Other noninterest income.
(3) Included within Net gains on investment securities.
(4) Included within Other noninterest expense.
(5) Included within Income tax expense (benefit).
17. Non-GAAP Reconciliation
17
Computation of FTE and adjusted net interest income and margin: Quarter Ended
Dec. 31, Sep. 30,
(Dollars in thousands, except per share data) 2019 2019
Net interest income $ 408,753 $ 371,793
Adjustment for taxable equivalent interest(1)
2,896 2,488
Net interest income (FTE) 411,649 374,281
Purchase accounting accretion and amortization (30,523) (28,411)
Adjusted net interest income (FTE), excluding purchase accounting accretion and
amortization $ 378,230 $ 343,382
Net interest margin 3.86% 4.12%
Net interest margin (FTE) 3.89 4.14
Purchase accounting accretion and amortization (0.29) (0.31)
Adjusted net interest margin, excluding purchase accounting accretion and
amortization (FTE) 3.60% 3.83%
(1) The yield on tax-exempt loans and investment securities available-for-sale is computed on a tax-equivalent basis using a statutory federal
income tax rate of 21%.
Computation of adjusted net interest income and margin: Month Ended
Sep. 30,
(Dollars in thousands, except per share data) 2019
Net interest income $ 142,216
Adjustments for taxable equivalent interest 960
Net interest income (FTE) 143,176
Purchase accounting accretion and amortization (14,500)
Adjusted net interest income (FTE), excluding purchase accounting accretion and amortization $ 128,676
Average interest-earning assets $ 42,030,630
Net interest margin (FTE) 4.10%
Purchase accounting accretion and amortization (0.40)
Adjusted net interest margin, excluding purchase accounting accretion and amortization (FTE) 3.70%
18. Non-GAAP Reconciliation
18
Computation of adjusted provision and net charge-offs:
Quarter Ended
Dec. 31,
(Dollars in thousands) 2019
Provision $ 14,403
Provision benefit due to the consumer nonaccrual and TDR loan sale 4,694
Adjusted provision, excluding consumer nonaccrual and TDR loan sale $ 19,097
Net charge-offs (a) $ (6,237)
Recovery related to the consumer nonaccrual and TDR loan sale (b) (4,694)
Adjusted net charge-offs, excluding consumer nonaccrual and TDR loan sale (c) $ (10,931)
Average loans and leases (d) $ 33,804,883
Net charge-off rate as a percentage of average loans and leases(1)
(a)/(d) 0.07%
Impact of recovery to net charge-off ratio related to the consumer nonaccrual and TDR loan sale(1)
(b)/(d) 0.06
Adjusted net charge-off ratio, excluding consumer nonaccrual and TDR loan sale(1)
(c)/(d) 0.13%
(1) Annualized
19. Non-GAAP Reconciliation
19
Computation of adjusted return on average assets, common equity, average tangible common equity and
average tangible common equity: Quarter Ended
Dec. 31, Sep. 30,
(Dollars in thousands) 2019 2019
Adjusted net income after tax expense:
Income after tax expense (a) $ 114,456 $ 24,978
Merger-related expenses 47,025 111,259
Notable items 22,061 41,107
Related income tax expense, net of tax benefits (19,904) (46,213)
Adjusted net income after tax expense for ROAA calculation (b) 163,638 131,131
Net income available to common shareholders (c) 109,905 19,654
Other intangibles amortization 5,505 4,544
Related income tax expense (1,284) (1,085)
Net income available to common shareholders used in ROATCE calculation (d) 114,126 23,113
Adjusted net income available to common shareholders:
Net income available to common shareholders 109,905 19,654
Notable items 22,061 41,107
Merger-related expenses 47,025 111,259
Related income tax expense, net of tax benefits (19,904) (46,213)
Net income available to common shareholders used in adjusted ROAA and ROACE calculation (e) 159,087 125,807
Other intangibles amortization 5,505 4,544
Related income tax expense (1,284) (1,085)
Net income available to common shareholders used in adjusted ROATCE calculation (f) 163,308 129,266
Average balances:
Average assets (g) 46,119,514 39,094,366
Total equity 5,691,119 4,683,129
Non-controlling interest in subsidiaries (23,683) (25,516)
Total TCF Financial Corporation shareholders' equity 5,667,436 4,657,613
Preferred stock (169,302) (169,302)
Average total common shareholders' equity used in ROACE calculation (h) 5,498,134 4,488,311
Goodwill, net (1,266,166) (890,155)
Other intangibles, net (211,294) (142,925)
Average tangible common shareholders' equity used in ROATCE calculation (i) $ 4,020,674 $ 3,455,231
ROAA(1)
(a) / (g) 0.99% 0.26%
Adjusted ROAA(1)
(b) / (g) 1.42 1.34
ROACE(1)
(c) / (h) 8.00 1.75
Adjusted ROACE(1)
(e) / (h) 11.57 11.21
ROATCE(1)
(d) / (i) 11.35 2.68
Adjusted ROATCE(1)
(f) / (i) 16.25 14.96
(1) Annualized.
20. Non-GAAP Reconciliation
Computation of adjusted efficiency ratio, noninterest income and noninterest expense: Quarter Ended
Dec. 31, Sep. 30,
(Dollars in thousands) 2019 2019
Noninterest expense (a) $ 416,571 $ 425,620
Merger-related expenses (47,025) (111,259)
Write-down of company-owned vacant land parcels and branch exit costs (3,494) (5,890)
Sale of Legacy TCF auto finance portfolio (4,670) —
Pension fair valuation adjustment (6,341) —
Adjusted noninterest expense 355,041 308,471
Lease financing equipment depreciation (18,629) (19,408)
Amortization of intangibles (5,505) (4,544)
Impairment of historic income tax credits (4,030) —
Adjusted noninterest expense, efficiency ratio (b) 326,877 284,519
Net interest income $ 408,753 $ 371,793
Noninterest income 158,052 94,258
Total revenue (c) $ 566,805 $ 466,051
Noninterest income $ 158,052 $ 94,258
Sale of Legacy TCF auto finance portfolio 8,194 19,264
Termination of interest rate swaps — 17,302
Gain on sales of certain investment securities — (5,869)
Loan servicing rights (recovery) impairment (638) 4,520
Adjusted noninterest income 165,608 129,475
Net interest income 408,753 371,793
Net interest income FTE adjustment 2,896 2,488
Adjusted net interest income 411,649 374,281
Lease financing equipment depreciation (18,629) (19,408)
Adjusted total revenue, efficiency ratio (d) $ 558,628 $ 484,348
Efficiency ratio (a) / (c) 73.49% 91.32%
Adjusted efficiency ratio (b) / (d) 58.51% 58.74% 20
21. Non-GAAP Reconciliation
21
Computation of tangible common equity to tangible assets and tangible
book value per common share: Quarter Ended
Dec. 31, Sep. 30,
(Dollars in thousands, except per share data) 2019 2019
Total equity $ 5,727,241 $ 5,693,417
Non-controlling interest in subsidiaries (20,226) (23,313)
Total TCF Financial Corporation shareholders' equity 5,707,015 5,670,104
Preferred stock (169,302) (169,302)
Total common shareholders' equity (a) 5,537,713 5,500,802
Goodwill, net (1,299,878) (1,265,111)
Other intangibles, net (168,368) (215,910)
Tangible common shareholders' equity (b) $ 4,069,467 $ 4,019,781
Total assets (c) $ 46,651,553 $ 45,692,511
Goodwill, net (1,299,878) (1,265,111)
Other intangibles, net (168,368) (215,910)
Tangible assets (d) $ 45,183,307 $ 44,211,490
Common stock shares outstanding (e) 152,965,571 153,571,381
Common equity to assets (a) / (c) 11.87% 12.04%
Tangible common equity to tangible assets (b) / (d) 9.01 9.09
Book value per common share (a) / (e) $ 36.20 $ 35.82
Tangible book value per common share (b) / (e) 26.60 26.18