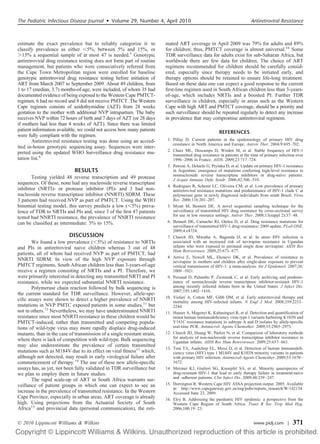
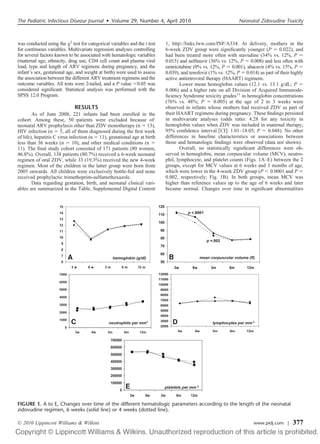
SlideShare a Scribd company logo
1 of 19
Download to read offline
BRIEF REPORTS
HUMAN RHINOVIRUS CAUSES SEVERE INFECTION
IN PRETERM INFANTS
Rene´e O. van Piggelen, MD,* Anton M. van Loon, PhD,†
Tanette G. Krediet, MD, PhD,*
and Malgorzata A. Verboon-Maciolek, MD, PhD*
Abstract: Data of 11 infants (median gestational age and birth weight 30
weeks and 1520 g, respectively) with severe human rhinovirus infection
(HRV) are described. Nine of 11 (82%) were preterm infants and 7 of these
9 (78%) became infected during their stay in the neonatal intensive care
unit. All infants presented with respiratory distress and all needed respi-
ratory support for a median of 6 days. Radiologic findings included
perihilar streakiness, atelectasis, focal consolidation, and hyperinflation.
The diagnosis of HRV infection was made by real-time polymerase chain
reaction in nasopharyngeal aspirate. All infants recovered from their HRV
infection. HRV can cause severe disease in preterm infants requiring
respiratory support.
Key Words: human rhinovirus, neonatal infection, preterm infant
Accepted for publication October 20, 2009.
From the Departments of *Neonatology, and †Virology, University Med-
ical Center, Utrecht, The Netherlands.
Address for correspondence: Malgorzata A. Verboon-Maciolek, MD, PhD,
Department of Neonatology, University Medical Center, Lundlaan 6,
3584 EA Utrecht, KE 04.123.1, The Netherlands. E-mail: m.verboon-
maciolek@umcutrecht.nl.
Copyright © 2010 by Lippincott Williams & Wilkins
DOI: 10.1097/INF.0b013e3181c6e60f
Human rhinoviruses (HRV) are a major cause of common cold
in adults and children.1
Usually HRV infections run a mild
course, but it has recently been shown that HRV can be associated
with severe lower respiratory tract infection in children.2
There are
no published data available on HRV infections in preterm infants.
We retrospectively analyzed the data of all neonates with con-
firmed HRV infection admitted to our neonatal intensive care unit
(NICU) from 2003 until 2008.
MATERIALS AND METHODS
We included all infants with a confirmed diagnosis of HRV
infection and admitted from 2003, when the HRV real-time poly-
merase chain reaction (PCR) was introduced in our hospital, until
2008. We analyzed the clinical, virologic, radiologic and labora-
tory data of these infants. The diagnosis of HRV infection was
made on the basis of a positive real-time PCR for HRV in a
nasopharyngeal aspirate. Samples of all infants were also tested by
real-time PCR for the following viral and bacterial pathogens:
respiratory syncytial virus (RSV), human metapneumovirus, para-
influenzaviruses 1 to 4, influenzaviruses A and B, human corona-
viruses (HCoV: 229E, OC43, and NL-63), adenoviruses, Myco-
plasma pneumoniae, Chlamydia pneumoniae, and since 2006
bocavirus. All PCRs were real-time assays based on TaqMan
probes. The target for the HRV PCR was the 5Ј noncoding region
of the genome. The amount of virus in each sample was recorded
semi-quantitatively based on the cycle threshold (Ct) value of the
sample in the PCR. The Ct value indicates the number of cycles
needed in PCR before a sample becomes positive, and is therefore
directly related to the amount of viral genome in the sample. Thus,
a low Ct value corresponds to a high viral load, and a high Ct value
to a low viral load. HRV was recorded as the dominating virus in
a sample when the Ct value was at least 4 cycles lower than the Ct
value for any other virus. Ct values above 45 were considered to
be negative. Molecular typing of HRV was not performed.
RESULTS
During the study period viral infection was suspected in 62
infants admitted to our NICU. Depending on the clinical presen-
tation (sepsis, meningitis, or pneumonia) we looked for viral
agents of infection in different clinical samples. In patients with
pneumonia we performed a PCR on respiratory viruses in naso-
pharyngeal aspirate as described in the methods section. In 8 of 62
infants, we could not identify any virus. In 22 (41%) of 54 infants
with a proven viral infection, we identified 24 respiratory viruses.
The most frequently detected viruses were HRV (n ϭ 11) and RSV
(n ϭ 8). The remaining respiratory viruses were HCoV (n ϭ 2),
influenza virus (n ϭ 1), adenovirus (n ϭ 1), and parainfluenza
virus (n ϭ 1). In 1 infant, 3 different respiratory viruses (HRV,
RSV, and HCoV) were found.
The characteristics of 11 infants with HRV infection are
shown in Table 1. Nine of 11 infants (82%) were born prematurely
with a median gestational age of 30 weeks (range: 26–32 weeks).
The other 2 infants were born at term (39 and 41 weeks, respec-
tively). One underwent surgical correction because of a diaphrag-
matic hernia, whereas the other was admitted from home at 5 days
of age. The median age at onset of symptoms was 49 days (range:
5–94 days). In 7 of 11 infants HRV infection was acquired during
their hospital stay.
The main presenting symptoms were respiratory distress
(9/11), apnea (7/11), rhinorrhea (6/11), and hypothermia (5/11).
All infants required respiratory support for a median of 6 days
(range: 3–11 days), in 9 infants mechanical ventilation was nec-
essary. The C-reactive protein was slightly elevated at onset of
symptoms with a median value of 15 mg/L, and the white blood
cell count was consistently normal. The Ct value of HRV was low
in all infants with a median of 21 (range: 18.4–28.8) at onset of
symptoms, indicating the presence of high viral loads of HRV in
the respiratory tract. In 2 infants (patient 9 and 11), the Ct value
increased from 24.6 to 29.4 and from 18.4 to 35.6, respectively, in
samples taken 7 days later. Chest radiographs revealed perihilar
streakiness (10/11), atelectasis (9/11), focal consolidation (6/11),
and hyperinflation (6/11). Most infants had 2 or more of the above
mentioned radiologic findings. One patient (patient 4) had a
coinfection with 2 other viral pathogens, HCoV and RSV, but the
viral loads of RSV (Ct: 35.1) and HCoV (Ct: 31.2) were consid-
erably lower than that of HRV (Ct: 26.5). We did not find any
nosocomial spread of HRV among our infants. Our patients were
not clustered in time, but represented separate events. All infants
recovered from the episode of HRV infection, but 4 patients (1
term and 3 preterm) subsequently developed recurrent lower re-
spiratory tract infections.
DISCUSSION
Our study shows that HRV can cause severe pulmonary
disease among infants admitted to a NICU. HRV is generally
known as the causative agent of the common cold. The association
of HRV with asthma exacerbations, wheezing, and lower respira-
tory tract infections has been well recognized.2– 4
Recently, HRV
also appeared to be an important reason for hospitalization in
young children.5–7
However, HRV can also be detected in asymp-
tomatic children.8
It is suggested that the identification of HRV in
asymptomatic infants represents low-level infection without clin-
ical symptoms, or is a first sign of developing illness.5
Data on
HRV infections in very young infants are limited. In our previous
retrospective analysis (1992–2003) of viral infections in our
NICU, we found that HRV contributed to 2% of all proven viral
infections among admitted infants.9
This percentage recently in-
creased to 20% (unpublished data), which can be explained by the
The Pediatric Infectious Disease Journal • Volume 29, Number 4, April 2010364 | www.pidj.com
introduction of real-time PCR for the identification of viruses in
infants with severe respiratory disease.
The clinical presentation of HRV infection in infants de-
scribed in our study did not differ from that of RSV infection.10,11
All infants developed rhinorrhea, respiratory distress, apnea, and
hypothermia, and required respiratory support for 3 to 11 days. It
was not possible to differentiate between RSV and HRV infection
based on radiologic findings. The presence of atelectasis which
changed position daily and the huge production of sputum were
common findings. We recorded relatively low Ct values corre-
sponding to relatively high viral loads in the respiratory samples of
our patients. In one infant (patient 4), who was infected with 3
different respiratory viruses, HSV was considered the major caus-
ative agent because of its lowest Ct value. In 2 infants the Ct value
performed again after 7 days was increased significantly, which
was associated with clinical recovery. All infants recovered, but 4
developed recurrent respiratory tract infections which could not be
explained solely by prematurity. In conclusion, HRV can cause
severe pulmonary disease in preterm infants, requiring respiratory
support.
REFERENCES
1. Brownlee JW, Turner RB. New developments in the epidemiology and
clinical spectrum of rhinovirus infections. Curr Opin Pediatr. 2008;20:
67–71.
2. Louie JK, Roy-Burman A, Guardia-Labar L, et al. Rhinovirus associated
with severe lower respiratory tract infections in children. Pediatr Infect Dis
J. 2009;28:337–339.
3. Tan WC. Viruses in asthma exacerbations. Curr Opin Pulm Med. 2005;11:
21–26.
4. Kusel MM, de Klerk NH, Holt PG, et al. Role of respiratory viruses in acute
upper and lower respiratory tract illness in the first year of life: a birth
cohort study. Pediatr Infect Dis J. 2006;25:680–686.
5. Jartti T, Lee WM, Pappas T, et al. Serial viral infections in infants with
recurrent respiratory illnesses. Eur Respir J. 2008;32:314–320.
6. Miller EK, Lu X, Erdman DD, et al. Rhinovirus-associated hospitalizations
in young children. J Infect Dis. 2007;195:773–781.
7. Piotrowska Z, Vazquez M, Shapiro ED, et al. Rhinoviruses are a major
cause of wheezing and hospitalization in children less than 2 years of age.
Pediatr Infect Dis J. 2009;28:25–29.
8. Wright PF, Deatly AM, Karron RA, et al. Comparison of results of
detection of rhinovirus by PCR and viral culture in human nasal wash
specimens from subjects with and without clinical symptoms of respiratory
illness. J Clin Microbiol. 2007;45:2126–2129.
9. Verboon-Maciolek MA, Krediet TG, Gerards LJ, et al. Clinical and epide-
miologic characteristics of viral infections in a neonatal intensive care unit
during a 12-year period. Pediatr Infect Dis J. 2005;24:901–904.
10. Prodhan P, Westra SJ, Lin J, et al. Chest radiological patterns predict the
duration of mechanical ventilation in children with RSV infection. Pediatr
Radiol. 2009;39:117–123.
11. Forster J, Schumacher RF. The clinical picture presented by premature
neonates infected with respiratory syncytial virus. Eur J Pediatr. 1995;154:
901–905.
TABLE 1. Clinical, Laboratory, Virologic and Radiologic Data of 11 Infants With HRV Infection
Patient/Birth/Sex
GA
(wk)
BW
(g)
Onset
(d)
Clinical Signs
CRP at Onset
(max) (mg/L)
WBC Count
at Onset
ϫ109
/L
Ct
Value
Respiratory
Support (d)
Chest Radiograph
1/October 2003/M 29 1495 34 Apneas, rhinorrhea,
respiratory distress
9 (48) 7.0 28.3 4 Atelectasis, perihilar
streakiness focal
consolidation
2/February 2005/F 32 1900 18 Respiratory distress 17 (37) 16.7 23.4 6 Atelectasis, perihilar
streakiness,
hyperinflation
3/November 2005/M 30 1520 75 Hypothermia, rhinorrhea,
respiratory distress
79 (81) 8.9 22.9 6 Atelectasis, perihilar
streakiness,
hyperinflation,
focal consolidation
4/November 2005/F 32 2095 28 Hypothermia, apneas,
respiratory distress
15 (109) 16.7 26.5 6 Atelectasis, perihilar
streakiness,
hyperinflation
5/May 2006/M* 32 1700 49 Respiratory distress 17 (17) 18 23.9 11 Atelectasis, perihilar
streakiness,
hyperinflation,
focal consolidation
6/April 2006/F 28 895 90 Hypothermia, apneas 27 (27) 4.5 28.8 5 Atelectasis, perihilar
streakiness
7/October 2006/M 29 970 94 Apneas, rhinorrhea,
respiratory distress
2 (6) 9.5 27.1 7 Atelectasis, perihilar
streakiness,
hyperinflation,
focal consolidation
8/November 2006/M 41 3050 5 Hypothermia, respiratory
distress
16 (21) 10.6 19.5 3 Atelectasis, perihilar
streakiness
9/April 2007/F 30 1150 45 Hypothermia, apneas,
rhinorrhea
6 (6) 11.0 24.6 7 Perihilar streakiness
10/September 2007/M†
39 3480 50 Apneas, rhinorrhea,
respiratory distress
2 (2) 7.7 20.5 11 Atelectasis,
hyperinflation
focal consolidation
11/December 2007/F‡
26 890 68 Apneas, rhinorrhea,
respiratory distress
2 (2) 10.1 18.4 8 Perihilar streakiness,
focal consolidation
*Patient 5: VACTERL anomaly.
†
Patient 10: congenital diaphragmatic hernia.
‡
Patient 11: chronic lung disease.
The Pediatric Infectious Disease Journal • Volume 29, Number 4, April 2010 Human Rhinovirus Infection in Preterm Infants
© 2010 Lippincott Williams & Wilkins www.pidj.com | 365
CLINICAL PERFORMANCE OF A RAPID INFLUENZA
TEST AND COMPARISON OF NASAL VERSUS
THROAT SWABS TO DETECT 2009 PANDEMIC
INFLUENZA A (H1N1) INFECTION IN THAI
CHILDREN
Piyarat Suntarattiwong, MD,* Richard G. Jarman, PhD,†
Jens Levy, PhD,‡ Henry C. Baggett, MD, MPH,§
Robert V. Gibbons, MD, MPH,†
Tawee Chotpitayasunondh, MD, DTM&H,* and
James M. Simmerman, PhD, RN‡
Abstract: We identified febrile pediatric outpatients seeking care for influenza
like illness in Bangkok. Two nasal and 1 throat swab were tested using the
QuickVue AϩB rapid influenza kit and reverse transcription-polymerase chain
reaction. Among 142 pandemic influenza A (H1N1)-positive patients, the
QuickVue test identified 89 positive tests for a sensitivity of 62.7% (95%
confidence interval ͓CI͔: 54.7–70.6). Specificity was 99.2% (95% CI: 98–
100). In the 0 to 2 years age group, sensitivity was 76.7% (95% CI: 61.5–91.8).
Throat and nasal swabs are equally useful diagnostic specimens for reverse
transcription-polymerase chain reaction diagnosis.
Key Words: influenza, rapid diagnostic tests, pandemic, Thailand
Accepted for publication October 20, 2009.
From the *Queen Sirikit National Institute of Child Health Department of
Medical Service, Ministry of Public Health, Bangkok, Thailand; †US
Armed Forces Research Institute of Medical Sciences, Bangkok, Thailand;
‡Influenza Division, International Emerging Infections Program, Thailand
MOPH-US CDC Collaboration, Nonthaburi, Thailand; and §International
Emerging Infections Program, Thailand MOPH-US CDC Collaboration,
Nonthaburi, Thailand.
The opinions or assertions contained herein are the private views of the
authors and are not to be construed as official, or as reflecting the views
of the US Centers for Disease Control and Prevention, the Department
of the Army or the Department of Defense.
Address for correspondence: James M. Simmerman, PhD, RN, International
Emerging Infections Program, Thailand MOPH-US CDC Collaboration,
Box 68 CDC, APO AP 96546, Nonthaburi, Thailand. E-mail:
msimmerman@cdc.gov.
DOI: 10.1097/INF.0b013e3181c6f05c
Anovel quadruple reassortant influenza A/H1N1 virus emerged
in North America in early 2009 and rapidly spread to hundreds
of countries around the world causing the World Health Organi-
zation to declare a pandemic on June 11.1
Following sporadic
infections in returning Thai travelers in May and June, community
transmission was established and 14,976 cases and 119 deaths due
to laboratory-confirmed 2009 pandemic influenza A (H1N1) virus
infection were reported in Thailand by August 22, 2009.2
Rapid
laboratory diagnosis of influenza can improve clinical care, facil-
itate outbreak investigations, and support infection control mea-
sures. Highly sensitive real-time reverse transcription-polymerase
chain reaction (RTPCR) assays are the preferred diagnostic
method but are complex and costly, often not available in devel-
oping countries, and results are seldom available in time to
influence treatment decisions. In contrast, commercially available
rapid influenza diagnostic tests (RIDTs) are simple, produce re-
sults in a few minutes, and are widely used to detect influenza
infections in outpatient settings. Broadly, RIDTs have been found
to have high specificity (76%–100%) but low to moderate sensi-
tivity (10%–100%) to detect seasonal influenza viruses.3
We investigated the sensitivity and specificity of the Quick-
Vue AϩB rapid influenza test to detect 2009 pandemic influenza
A (H1N1) virus infection compared with real time RTPCR in
febrile pediatric outpatients in Bangkok, Thailand. We also studied
whether nasal or throat swabs produce superior specimens to
detect the 2009 pandemic virus by RTPCR.
MATERIALS AND METHODS
The study was approved by the Ethical Review Committee
of the Queen Sirikit National Institute of Child Health. During July
2009 and August 2009, we prospectively identified and obtained
written consent from the guardians of pediatric patients who
sought outpatient care for influenza-like illness (ILI). For children
less than 2 years of age, ILI was defined as fever Ն38°C and one
or more of the following symptoms: nasal discharge/congestion,
cough, conjunctivitis, respiratory distress, sore throat, new seizure.
For children Ն2 years of age ILI was defined as fever Ն38°C and
cough or sore throat. Eligible patients were 1 month to 15 years of
age. Rapid test results were immediately provided to the attending
physician to support treatment decisions. RTPCR was used as the
standard to calculate the performance of the rapid test. We ex-
cluded subjects who tested positive by RTPCR for seasonal influ-
enza strains from the analysis. We derived 95% confidence limits
for sensitivity and specificity using the Wald-normal-approxima-
tion using R version 2.8.1. We used the simple kappa coefficient to
test for agreement between throat and nasal swabs by RTPCR.
Specimens (2 nasal and 1 throat) were collected from each
child by hospital nurses experienced in collecting respiratory swab
specimens. The foam-tipped nasal swab provided by the manufac-
turer was immediately tested according to manufacturer instruc-
tions using the QuickVue Influenza AϩB rapid diagnostic kit
(Quidel Co., San Diego, CA). The remaining Dacron-tipped nasal
and throat swabs were immediately placed in separate M4RT viral
transport media (Remel, Lenexa, KS), and sent the same day on
wet ice to the Armed Forces Institute of Medical Sciences. These
specimens were aliquoted within 24 hours and then stored at
Ϫ70°C until processed for RTPCR. Viral ribonucleic acid was
extracted from 140 ␮L of inoculated viral transport media using
the QIAamp viral ribonucleic acid mini kit method (Qiagen, Los
Angeles, CA) according to the manufacturer instructions. All
respiratory samples were first tested with universal influenza A and
universal influenza B primers and probes. Samples that were
positive for universal influenza A were tested with 2009 pandemic
influenza A (H1N1) primers and probe sequences. If negative for
the pandemic strain, seasonal H1 and H3 specific probes and primer
sequences were used. Probes and primers were developed by the US
Centers for Disease Control and Prevention, Atlanta, GA.
RESULTS
Respiratory swab specimens were collected from 426 chil-
dren of whom 418 had RTPCR results. Subjects ranged in age
from 6 months to 14 years including 233 (56%) participants less
than 3 years (Table 1). All subjects agreed to participate. No
participants received antiviral medication prior to being tested.
About 71% of participants were tested within the first 2 days
following symptom onset (range: 0–8 days, median ϭ 2). Among
181 (43%) subjects whose nasal swab was RTPCR-positive for
influenza, 142 (78%) were positive for the 2009 pandemic influ-
enza A (H1N1) virus and 39 were positive for seasonal influenza
viruses (30 type A/H3, 4 type A/H1, and 5 type B).
Among the 142 pandemic influenza A (H1N1) RTPCR posi-
tive patients, the QuickVue rapid test identified 89 positive tests for a
sensitivity of 62.7% (95% confidence interval ͓CI͔: 54.7–70.6). Spec-
ificity was 99.2% (95% CI: 98–100). In the 0 to 2 years age group,
sensitivity was 76.7% (95% CI: 61.5–91.8). Two false-positives
occurred in patients 0 to 2 years of age. The sensitivity of the rapid test
was greatest in children less than 3 years of age. In this sample with
a pandemic influenza A (H1N1) prevalence of 34%, the rapid test’s
Suntarattiwong et al The Pediatric Infectious Disease Journal • Volume 29, Number 4, April 2010
© 2010 Lippincott Williams & Wilkins366 | www.pidj.com
overall positive predictive value was 97.8% and negative predictive
value was 81.6%. The sensitivity of the QuickVue test for seasonal
influenza viruses was 27/39 or 69.2% (95% CI: 54.7–83.7). RTPCR
results obtained from nasal and throat swabs were similar. A total of
142 of 418 (33.97%) nasal swabs were RTPCR positive for 2009
pandemic influenza A (H1N1) virus, while 140 (33.49%) throat swabs
were RTPCR positive. The kappa value for agreement between the
throat and nasal swab specimens for 2009 pandemic influenza A
(H1N1) virus was 0.932 (95% CI: 0.89–0.97). When seasonal influ-
enza viruses were included the kappa value was 0.939 (95% CI:
0.91–0.97).
DISCUSSION
We demonstrated that the QuickVue test had a sensitivity of
62.7% to detect 2009 pandemic influenza A (H1N1) viruses com-
pared with RTPCR in febrile pediatric outpatients in Thailand. We
used the World Health Organization case definition for ILI. Use of a
broader case definition might have influenced the positive and nega-
tive predictive values of the rapid test. In contrast to human infections
with avian influenza A (H5N1) where throat and lower respiratory
tract specimens have been found to be superior to nasal swabs,4
we
observed no significant difference between throat and nasal swabs to
identify 2009 pandemic influenza A(H1N1) by RTPCR.
The performance of RIDTs may vary by virus subtype3
and
has been poor when tested with nonhuman influenza viruses.5
While the 2009 pandemic influenza A (H1N1) virus is from a
swine lineage, the QuickVue test demonstrated moderate sensitiv-
ity similar to the performance of the same test with seasonal
influenza viruses in pediatric age groups.6
However, recent small
studies have reported lower sensitivity of RIDTs with the 2009
pandemic influenza A (H1N1) virus. Faix et al7
reported that the
QuickVue Influenza AϩB test identified 20 of 39 patients who
were 2009 pandemic influenza A (H1N1) positive by RTPCR for
a sensitivity of 51% (95% CI: 35–67). Vasoo et al8
compared the
performance of 3 RIDTs using 60 specimens from children and
young adults that were tested positive by Luminex xTAG RVP and
reported sensitivity of the QuickVue AϩB test was 53.3% (95%
CI: 40.9–65.4). Drexler et al9
reported that compared with RT-
PCR, the BinaxNOW Influenza A and B Rapid test had a sensi-
tivity of 11.1% (95% CI: 6.7–17.7) in 144 pandemic influenza
A(H1N1) positive patients with a median age of 18 years.
Several factors may have contributed to the greater sensi-
tivity we observed. First, our study population included only
children and 71% were tested within 72 hours of symptom onset.
Because children shed higher quantities of virus and for longer
duration than adults,10
this may explain the higher sensitivity we
observed compared with other studies where adult specimens were
tested and the time from symptom onset to specimen collection
was longer or unknown.7
Previous studies tested specimens that
had been shipped, frozen, and thawed prior to testing which may
have reduced the performance of the test. In our study, specimen
collection was standardized and rapid testing was completed on
fresh specimens within minutes of receipt.
Seasonal and pandemic viruses continually undergo anti-
genic drift which makes regular reassessment of the sensitivity of
RIDTs essential. RIDT performance can vary by brand and by
virus subtype. Adherence to package insert instructions and careful
attention to clinical specimen quality is essential to optimize the
performance of all RIDTs. For clinical decision-making, all results
from RIDTs must be interpreted in the context of patient’s risk for
serious complications, the severity of illness, and circulating in-
fluenza strain information.
REFERENCES
1. Dawood FS, Jain S, Finelli L, et al. Emergence of a novel swine-origin
influenza A (H1N1) virus in humans. N Engl J Med. 2009;360:2605–2615.
2. BOE. Pandemic A (H1N1) update. Thailand Bureau of Epidemiology.
2009. Cited September 3, 2009. Available at: http://203.157.15.4/Flu/
situation/y52/flu_200908310921.pdf.
3. Hurt AC, Alexander R, Hibbert J, et al. Performance of six influenza rapid
tests in detecting human influenza in clinical specimens. J Clin Virol.
2007;39:132–135.
4. Abdel-Ghafar AN, Chotpitayasunondh T, Gao Z, et al. Update on avian
influenza A (H5N1) virus infection in humans. N Engl J Med. 2008;358:
261–273.
5. Fedorko DP, Nelson NA, McAuliffe J, et al. Performance of rapid tests for
detection of avian influenza A virus types H5N1 and H9N2. J Clin
Microbiol. 2006;44:1596–1597.
6. Cheng CK, Cowling BJ, Chan KH, et al. Factors affecting QuickVue
Influenza AϩB rapid test performance in the community setting. Diagn
Microbiol Infect Dis. 2009;65:35–41.
7. Faix DJ, Sherman SS, Waterman SH. Rapid-test sensitivity for novel swine-
origin influenza A (H1N1) virus in humans. N Engl J Med. 2009;361:728–729.
8. Vasoo S, Stevens J, Singh K. Rapid antigen tests for diagnosis of pandemic
(Swine) influenza A/H1N1. Clin Infect Dis. 2009;49:1090–1093.
9. Drexler JF, Helmer A, Kirberg H, et al. Poor clinical sensitivity of rapid
antigen test for influenza A pandemic (H1N1) 2009 virus. Emerg Infect Dis.
2009;15:1662–1664.
10. Steininger C, Kundli M, Aberle SW, et al. Effectiveness of reverse tran-
scription-PCR, virus isolation, and enzyme-linked immunosorbent assay for
diagnosis of influenza A virus infection in different age groups. J Clin
Microbiol. 2002;40:2051–2056.
TABLE 1. Sensitivity and Specificity of the QuickVue AϩB Rapid Test
Compared to RTPCR
Test
Age Category*
All
0–2 (n ϭ 150) 3–6 (n ϭ 128) 7–14 (n ϭ 100)
PCRϩ 30 55 57 142
QVϩ 23 29 37 89
QVϪ 7 26 20 53
Sensitivity (95% CI) 76.7 (61.5–91.8) 52.7 (39.5–65.9) 64.9 (52.5–77.3) 62.7 (54.7–70.6)
PCRϪ 120 73 43 237
QVϩ 2 0 0 2
QVϪ 118 73 43 235
Specificity (95% CI) 98.3 (96.0–100) 100 100 99.2 (98.0–100)
*Age missing for one child in PCRϪ group.
The Pediatric Infectious Disease Journal • Volume 29, Number 4, April 2010 Rapid Influenza Test
© 2010 Lippincott Williams & Wilkins www.pidj.com | 367
SHOULD HIGHER VANCOMYCIN TROUGH LEVELS BE
TARGETED FOR INVASIVE COMMUNITY-ACQUIRED
METHICILLIN-RESISTANT STAPHYLOCOCCUS AUREUS
INFECTIONS IN CHILDREN?
Natalia Jimenez-Truque, MQC, MSCI, Isaac Thomsen, MD,
Elizabeth Saye, BS, and C. Buddy Creech, MD, MPH
Abstract: Methicillin-resistant Staphylococcus aureus isolates with van-
comycin minimal inhibitory concentrations (MICs) Ն1.5 ␮g/mL have been
associated with poorer clinical outcomes and treatment failures in adults.
We evaluated vancomycin MICs in 71 invasive pediatric community-
acquired MRSA isolates from 2004 to 2008, using the E-test micromethod
and the E-test macro-method. The modal MIC by micromethod was 1.5
␮g/mL, and median vancomycin MICs did not increase over time.
Key Words: MRSA, vancomycin, methicillin resistance, Staphylococcus
aureus, pediatric, invasive
Accepted for publication October 8, 2009.
From the Department of Pediatric Infectious Diseases, Vanderbilt Univer-
sity Medical Center, Nashville, TN.
Supported, in part, by Vanderbilt CTSA grant 1 UL1 RR024975 from
NCRR/NIH and Fogarty International Center grant 1 R25 TW007697.
Address for correspondence: C. Buddy Creech, MD, MPH, 1161 21st Ave
South, CCC-5311 Medical Center North, Nashville, TN 37232. E-mail:
buddy.creech@vanderbilt.edu.
DOI: 10.1097/INF.0b013e3181c52a04
Since the emergence of methicillin-resistant S. aureus (MRSA),
vancomycin has been a key antimicrobial agent for the treat-
ment of MRSA infections.1,2
Concerns surrounding the long-term
use of vancomycin as a primary therapy were confirmed when the
first vancomycin–intermediate S. aureus (VISA) isolate was diag-
nosed in Japan in 1996.3
Recently, it was shown in adult patients
that strains with minimal inhibitory concentrations (MICs) Ն1.5
␮g/mL, though not above the susceptibility breakpoint of 2 ␮g/
mL, were associated with clinical failure.4,5
This increase in
vancomycin MICs over time is defined as MIC creep.6 – 8
Because of MIC creep, tissue penetration of vancomycin,
and other factors, the vancomycin MIC breakpoints were lowered
in 2006. According to these breakpoints, an isolate with an MIC of
Յ2 ␮g/mL is considered susceptible to vancomycin, an isolate
with intermediate resistance has an MIC of 4 to 8 ␮g/mL, and an
isolate with an MIC Ն16 ␮g/mL is resistant. Some bacterial
colonies within the staphylococcal population, on exposure to
vancomycin, develop an intermediately resistant phenotype known
as heterogeneous-vancomycin intermediate S. aureus (hVISA), a
phenotype that may be responsible for treatment failures despite
overall vancomycin susceptibility.2,6
Most data regarding MIC creep has been collected from
adult isolates. It is unclear whether this phenomenon occurs in
MRSA isolates from pediatric patients, specifically those classified
as community-associated MRSA (CA-MRSA). CA-MRSA iso-
lates would be expected to have lower vancomycin MICs when
compared with hospital-associated MRSA isolates due to the lack
of selective vancomycin pressure in the community. We hypoth-
esized that vancomycin MICs have not changed significantly over
time in the pediatric population, because risk factors such as
frequent vancomycin exposure and foreign bodies such as cathe-
ters or prosthetic joints are not likely to be present in children with
CA-MRSA disease. To evaluate this, we studied the vancomycin
MICs for pediatric CA-MRSA isolates from 2004 to 2008 based
on site of infection.
MATERIALS AND METHODS
S. aureus Clinical Isolates. Since 2004, all pediatric CA-MRSA
isolates at Vanderbilt Children’s Hospital have been archived.
Each isolate represents a unique pediatric patient. Isolates are
considered to be CA-MRSA based on application of Centers for
Disease Control-criteria.9
For this study, we analyzed vancomycin
MICs for 71 previously characterized invasive pediatric CA-
MRSA isolates collected from 2004 to 2008 that were viable in
culture and in which site of infection and date were known. These
71 invasive CA-MRSA isolates were randomly selected from a
de-identified pediatric clinical isolate database of 1376 unique
isolates, using a random number generator. In 706 isolates, unam-
biguous notation of site of infection was available; from these, 80
were from patients with invasive MRSA disease, and 71 were
viable in culture and had molecular features characteristic of
CA-MRSA.
Isolates were initially classified as MRSA by the clinical
laboratory of Vanderbilt Children’s Hospital and subsequently
confirmed by our laboratory based on growth on mannitol salt agar
plates containing oxacillin and a positive latex agglutination test
for clumping factor (Staphaurex, Remel). DNA was extracted and
purified and was used as template for polymerase chain reaction
(PCR) detection of nuc and mecA genes and for staphylococcal
cassette chromosome mec (SCCmec) typing, as described else-
where.10
Genotyping of isolates was performed by pulse-field gel
electrophoresis and/or repetitive element sequence based PCR.11
E-Test Micro- and Macro-Methods. S. aureus strain ATCC 29213
was used as the reference strain for both E-test methods (AB-
Biodisk, Solna, Sweden), which were performed according to the
manufacturer’s guidelines. For the micromethod, a 0.5 McFarland
standard was prepared in sterile saline, inoculated onto Mueller-
Hinton agar, and incubated for 24 hours at 35°C. For the macro-
method, a 2 McFarland standard was inoculated onto brain-heart
infusion agar and incubated for 48 hours at 35°C. Testing of the
clinical isolates was done in a single laboratory, and the results
were recorded by a single observer. S. aureus isolates with van-
comycin MICs by micromethod of Յ2 ␮g/mL were considered
susceptible (VSSA) based on Clinical and Laboratory Standards
Institute guidelines. Intermediate susceptibility to vancomycin
(VISA) was defined by MICs of 4 to 8 ␮g/mL, and vancomycin
resistance (VRSA) by MICs of Ն16 ␮g/mL.
Analysis of MICs over time and by site of infection was
performed using the Kruskal-Wallis H method. A P value of 0.05
was considered statistically significant. All analyses were per-
formed with SPSS Version 16.0.
RESULTS
To confirm that each of the 71 isolates clinically determined
to be community-associated were also genotypically consistent
with CA-MRSA, we performed SCCmec typing and genotyping by
pulsed-field gel electrophoresis or rep-PCR. All of the isolates had
SCCmec IV cassette and belonged to USA300, the current epi-
demic clone in the United States. Of the 71 invasive isolates, 47
(66.2%) were from joint infections (Table 1).
Overall, the modal MIC by micromethod was 1.5 ␮g/mL.
Fifty-six isolates had an MIC Ն1.5 ␮g/mL. Three isolates had
an MIC of 2 ␮g/mL, but are considered susceptible by Clinical
and Laboratory Standards Institute breakpoints. Only 15 iso-
lates had an MIC Ͻ1.5 ␮g/mL. Median and mean vancomycin
MICs did not increase over time (P ϭ 0.245, Inter-Quartile
Range [IQR] 1.5–1.5 ␮g/mL). Similarly, MIC values were not
significantly different across different infection sites (P ϭ
0.952, IQR ϭ 1.5–1.5 ␮g/mL).
Jimenez-Truque et al The Pediatric Infectious Disease Journal • Volume 29, Number 4, April 2010
© 2010 Lippincott Williams & Wilkins368 | www.pidj.com
By the macro-method, 2 isolates (1 from 2005, 1 from 2004)
had vancomycin concentrations of 8 and 12 ␮g/ml, respectively.
These isolates were susceptible by the micromethod, a character-
istic consistent with hVISA. By the macromethod, changes in
vancomycin concentrations over time in both the mean and the
median were not different (P ϭ 0.052, IQR ϭ 3 to 4 ␮g/mL), nor
were the differences by infection sites (P ϭ 0.085, IQR ϭ 3–4
␮g/mL).
DISCUSSION
The modal vancomycin MIC of 1.5 ␮g/mL in our isolates is
higher than the previously reported modal MIC of 1.0 ␮g/mL for
S. aureus.2
This has clinical importance if treatment with vanco-
mycin is considered, since MRSA isolates with vancomycin MICs
Ն1.5 ␮g/mL have been associated with poorer clinical outcomes
and vancomycin treatment failures in adults, despite the fact that
they are lower than the vancomycin susceptibility breakpoint.4,5
Though vancomycin is the mainstay of treatment for most
children with invasive CA-MRSA infections, the pharmacologic
properties of the drug, such as poor penetration into lung and
bone12
and potential for nephrotoxicity,12
are challenging. For this
reason, many choose clindamycin for first-line therapy for uncom-
plicated osteoarticular disease, given the likelihood of susceptibil-
ity and excellent bioavailability. However, for bacteremia or com-
plicated osteoarticular disease, vancomycin is still recommended
by most, and clinicians typically use plasma trough values to
evaluate safety and therapeutic window. At our institution, target
trough values are set between 5 and 12 ␮g/mL; however, in recent
years, many clinicians have pushed the troughs to 10 to 15 ␮g/mL,
particularly for osteoarticular disease or pulmonary disease where
vancomycin concentrations are only 10% to 15% of plasma.12
In
this study, we demonstrated that 56 of 71 isolates had MIC values
Ն1.5 ␮g/mL. For patients with bone or joint infections caused by
strains with vancomycin MICs of 1.5 ␮g/mL, troughs of no less
than 10 ␮g/mL are likely needed for the drug to be fully effective.
We did not see a creep in MICs of vancomycin during the
period studied. These findings agree with some authors who have
reported steady vancomycin MICs over time,2,8
but disagree with
others, who have reported the existence of a vancomycin “MIC
creep.”6,7
Most of this work has been done in hospital-associated
MRSA; therefore, the same selective pressures generating MIC
creep are likely not present in this cohort of patients with CA-
MRSA. Additionally, by the macromethod, 2 isolates with vanco-
mycin concentrations of 8 and 12 ␮g/mL, respectively, are con-
sidered to be hVISA. Currently, the E-test macromethod is
considered the most sensitive screening method for detecting
hVISA.13
Although they represent a low percentage, they might be
clinically significant, especially since there are no previous studies
that address hVISA in a pediatric population. The 2 hVISA isolates
were from years 2004 to 2005, implying that this is not a growing
phenomenon in this collection of isolates.
One limitation of this study is that the sample size depended
on all the available and viable pediatric invasive CA-MRSA
isolates at our institution. However, there were no systematic
biases towards CA-MRSA isolates with higher vancomycin MICs
because until 2009 very few CA-MRSA had formal MIC testing.
Another limitation is that we were unable to assess the association
between vancomycin MIC and clinical outcomes, since clinical
information was unavailable for the patients—a prospective study
would be the most definitive way to determine this relation. Last,
since many clinical laboratories use the E-test because of its
cost-effectiveness, we chose to use this method for MIC determi-
nation. While this method can overestimate the MIC when com-
pared with broth microdilution,14
the MIC by E-test may be more
reliable in predicting vancomycin treatment outcomes.15,16
Clinicians should recognize that MRSA isolates, including
those that are epidemiologically and genotypically CA-MRSA,
may have higher vancomycin MICs than expected, and that this
might complicate response to treatment. We recommend that all
pediatric patients treated with vancomycin for invasive CA-
MRSA disease, particularly those with osteoarticular disease or
pneumonia, have formal MIC testing of their staphylococcal
isolate (micromethod) to guide serum vancomycin target trough
concentrations.
REFERENCES
1. Smith TL, Pearson ML, Wilcox KR, et al. Emergence of vancomycin
resistance in Staphylococcus aureus. N Engl J Med. 1999;340:493–501.
2. Jones RN. Microbiological features of vancomycin in the 21st century:
minimum inhibitory concentration creep, bactericidal/static activity, and
TABLE 1. Median, Mean, Mode, and Range for Vancomycin MICs According to Year and Site of Infection by
E-Test Micro- and Macro-Methods
N (%)
Micro-Method (␮g/mL)
Range
Macro-Method (␮g/mL)
RangeMedian
(IQR)
Mean
(95% CI)
Mode
Median
(IQR)
Mean
(95% CI)
Mode
Year P ϭ 0.245* P ϭ 0.052*
2004 12 (16.9) 1.5 (1.5–1.5) 1.5 (1.4–1.6) 1.5 1.5–2 5.0 (4–6) 5.3 (3.8–6.9) 6.0 3–12
2005 22 (31.0) 1.5 (1.5–1.5) 1.3 (1.2–1.5) 1.5 1–1.5 4.0 (4–4) 3.9 (3.3–4.4) 4.0 3–8
2006 12 (16.9) 1.5 (1–1.5) 1.4 (1.2–1.5) 1.5 1–1.5 3.5 (3–4) 3.5 (3.2–3.8) 3.0 3–4
2007 15 (21.1) 1.5 (1.5–1.5) 1.4 (1.3–1.5) 1.5 1–1.5 4.0 (3–4) 3.9 (3.4–4.5) 4.0 3–6
2008 10 (14.1) 1.5 (1.5–1.5) 1.5 (1.3–1.7) 1.5 1–1.5 4.0 (3–4) 3.6 (3.2–4.0) 4.0 3–4
Site of infection P ϭ 0.952* P ϭ 0.085*
Bone 7 (9.9) 1.5 (1–1.5) 1.4 (1.1–1.6) 1.5 1–1.5 3.0 (3–6) 4.0 (2.7–5.3) 3.0 3–6
Blood 6 (8.5) 1.5 (1.5–1.5) 1.5 (1.5–1.5) 1.5 1.5–1.5 4.0 (3.8–6.5) 4.8 (2.9–6.8) 4.0 3–8
Joint 47 (66.2) 1.5 (1.5–1.5) 1.4 (1.3–1.5) 1.5 1–2 4.0 (3–4) 3.7 (3.5–3.9) 4.0 3–6
CSF 1 (1.4) 1.5 (1.5–1.5) 1.5 (NA) 1.5 1.5–1.5 4.0 (4–4) 4.0 (NA) 4.0 4–4
Pleural fluid 6 (8.5) 1.5 (1–1.6) 1.4 (1–1.8) 1.5 1–2 5.0 (3.8–7.5) 5.8 (2.4–9.2) 4.0 3–12
Pericardial fluid 2 (2.8) 1.5 (1.5–1.5) 1.5 (1.5–1.5) 1.5 1.5–1.5 3.0 (3–3) 3.0 (3–3) 3.0 3–3
Visceral abscess 1 (1.4) 1.5 (1.5–1.5) 1.5 (NA) 1.5 1.5–1.5 4.0 (4–4) 4.0 (NA) 4.0 4–4
Deep tissue abscess 1 (1.4) 1.5 (1.5–1.5) 1.5 (NA) 1.5 1.5–1.5 6.0 (6–6) 6.0 (NA) 6.0 6–6
Total 71 (100) 1.5 (1.5–1.5) 1.4 (1.4–1.5) 1.5 1–2 4.0 (3–4) 4.0 (3.7–4.4) 4.0 3–12
IQR indicates Inter-Quartile Range; 95% CI, 95% Confidence Interval.
*Kruskal-Wallis H method.
The Pediatric Infectious Disease Journal • Volume 29, Number 4, April 2010 Vancomycin in CA-MRSA
© 2010 Lippincott Williams & Wilkins www.pidj.com | 369
applied breakpoints to predict clinical outcomes or detect resistant strains.
Clin Infect Dis. 2006;42:S13–S24.
3. Hiramatsu K, Hanaki H, Ino T, et al. Methicillin-resistant Staphylococcus
aureus clinical strain with reduced vancomycin susceptibility. J Antimicrob
Chemother. 1997;40:135–136.
4. Sakoulas G, Moise-Broder PA, Schentag J, et al. Relationship of MIC and
bactericidal activity to efficacy of vancomycin for treatment of methicillin-
resistant Staphylococcus aureus bacteremia. J Clin Microbiol. 2004;42:
2398–2402.
5. Lodise TP, Graves J, Evans A, et al. Relationship between vancomycin
MIC and failure among patients with methicillin-resistant Staphylococcus
aureus bacteremia treated with vancomycin. Antimicrob Agents Chemother.
2008;52:3315–3320.
6. Wang G, Hindler JF, Ward KW, et al. Increased vancomycin MICs for
Staphylococcus aureus clinical isolates from a university hospital during a
5-year period. J Clin Microbiol. 2006;44:3883–3886.
7. Steinkraus G, White R, Friedrich L. Vancomycin MIC creep in non-
vancomycin-intermediate Staphylococcus aureus (VISA), vancomycin-sus-
ceptible clinical methicillin-resistant S. aureus (MRSA) blood isolates from
2001–05. J Antimicrob Chemother. 2007;60:788–794.
8. Alo´s JI, García-Can˜as A, García-Hierro P, et al. Vancomycin MICs did not
creep in Staphylococcus aureus isolates from 2002 to 2006 in a setting with
low vancomycin usage. J Antimicrob Chemother. 2008;62:773–775.
9. CDC. Community-Associated MRSA Information for Clinicians. Available at:
http://www.cdc.gov/ncidod/dhqp/ar_mrsa_ca_clinicians.html#. Accessed
2005.
10. Oliveira DC, de Lencastre H. Multiplex PCR strategy for rapid identifica-
tion of structural types and variants of the mec element in methicillin-
resistant Staphylococcus aureus. Antimicrob Agents Chemother. 2002;46:
2155–2161.
11. McDougal LK, Steward CD, Killgore GE, et al. Pulsed-field gel electro-
phoresis typing of oxacillin-resistant Staphylococcus aureus isolates from
the United States: establishing a national database. J Clin Microbiol.
2003;41:5113–5120.
12. Kollef MH. Limitations of vancomycin in the management of resistant
staphylococcal infections. Clin Infect Dis. 2007;45:S191–S195.
13. Wootton M, MacGowan AP, Walsh TR, et al. A multicenter study evalu-
ating the current strategies for isolating Staphylococcus aureus strains with
reduced susceptibility to glycopeptides. J Clin Microbiol. 2007;45:329–
332.
14. Tenover FC, Lancaster MV, Hill BC, et al. Characterization of Staphylo-
cocci with reduced susceptibilities to vancomycin and other glycopeptides.
J Clin Microbiol. 1998;36:1020–1027.
15. Hsu DI, Hidayat LK, Quist R, et al. Comparison of method-specific
vancomycin minimum inhibitory concentration values and their predictabil-
ity for treatment outcome of meticillin-resistant Staphylococcus aureus
(MRSA) infections. Int J Antimicrob Agents. 2008;32:378–385.
16. Sader HS, Rhomberg PR, Jones RN. Nine-hospital study comparing broth
microdilution and Etest method results for vancomycin and daptomycin
against methicillin-resistant Staphylococcus aureus. Antimicrob Agents
Chemother. 2009;53:3162–3165.
SURVEILLANCE OF TRANSMITTED RESISTANCE TO
ANTIRETROVIRAL DRUG CLASSES AMONG
YOUNG CHILDREN IN THE WESTERN CAPE
PROVINCE OF SOUTH AFRICA
Gert U. van Zyl, MD,* Mark F. Cotton, MD, PhD,†
Mathilda Claassen, BSc(Hons),* Charmaine Abrahams, RN,*
and Wolfgang Preiser, MD, PhD*
Abstract: There are limited data on transmitted antiretroviral resistance in
young children who require antiretroviral therapy. We adapted the World
Health Organization surveillance strategy, testing antiretroviral naive in-
fants (Ͻ18 months) in the Western Cape Province of South Africa, and
detecting only 3 non-nucleoside reverse transcriptase inhibitors (NNRTI)
and no NRTI or protease inhibitor surveillance mutations in 49 patients.
The estimated NRTI and protease inhibitor transmitted antiretroviral resis-
tance prevalence is low (Ͻ5%), predicting good therapeutic response in
Western Cape infants.
Key Words: transmitted antiretroviral drug resistance, surveillance,
children, South Africa
Accepted for publication October 7, 2009.
From the *Division of Medical Virology, Stellenbosch University, Tygerberg,
South Africa; and †Department of Paediatrics and Child Health, Children’s
Infectious Diseases Clinical Research Unit, Tygerberg Children’s Hospital,
Stellenbosch University, Tygerberg, South Africa.
Supported by the South African Department of Health, CCMT program.
Address for correspondence: Gert U. van Zyl, MD, Division of Medical
Virology, Stellenbosch University, Tygerberg Campus, P.O. Box
19063, Tygerberg 7505, South Africa. E-mail: guvz@sun.ac.za.
DOI: 10.1097/INF.0b013e3181c4dada
Transmitted antiretroviral drug resistance (TDR) refers to the
situation when patients are newly infected with antiretroviral
resistant HIV strains. In industrialized countries, such as Europe
and North America, with about 15 years history of antiretroviral
therapy (ART), 5% to 25% of newly HIV-infected individuals are
infected with a strain with some degree of antiretroviral drug
resistance.1,2
Likewise in developing countries with high levels of
antiretroviral exposure, such as Brazil and Argentina, TDR prev-
alence of respectively 4% and 7.7% was found.3,4
Transmitted
drug resistance testing should ideally be done during the early
stages of infection before resistant viruses can revert to wild-type.
Since the presence of TDR may compromise the success of ART
and therapy roll-out programs, surveillance for prevalence of TDR
in populations, where there is increasing ART-usage, is necessary.
The World Health Organization (WHO) proposed surveil-
lance guidelines using binomial sequential sampling for TDR
(threshold surveillance). At most 47 recently infected patients are
sequentially tested, allowing prevalence to be classified as either
Ͻ5%, between 5% and 15%, or Ͼ15%.5
To gain uniformity and to
exclude polymorphic mutations, the list of surveillance drug resis-
tance mutations (SDRM) has recently been updated.6
Since ART is rapidly being scaled-up in the Western Cape
Province of South Africa, surveillance is needed to detect any
increase in TDR. The WHO surveillance strategy targets recently
infected adults, but adult surveillance may not accurately predict
TDR prevalence in infants, especially where antiretroviral drugs
are used for prevention of HIV mother-to-child transmission
(PMTCT). The timing of infection is also easier to ascertain in
infants than in adults. Transmitted drug resistance data for infants
are limited, and for developing countries the data come from
PMTCT cohort studies, where high rates of nevirapine (NVP)
resistance in infants have been detected.7,8
There are very few
infant TDR data from a typical population of children needing
ART. In industrialized countries, the TDR prevalence in infants
may be high as demonstrated in the United States by Persaud et al
who found 5 of 21 (23.8%) infants to have transmitted resistance.9
Recent evidence supports early ART of infants,10
shortly after
transmission when TDR may be more significant. Monitoring in
young children could provide valuable information for the South
African ART roll-out program and enable the selection of optimal
regimens.
MATERIALS AND METHODS
The study formed part of a South African Department of
Health funded antiretroviral resistance study that was approved by
the Stellenbosch University Committee for Human Research. We
adapted the WHO TDR surveillance method to test children, using
age, less than 18 months, as indicative of early infection (for adults
the cut-off is 3-years after diagnosis, whereas no standard for
children has been formulated), applying the same binomial sam-
pling method as is recommended for adults. This method is based
on lot quality assurance methods. The method does not attempt to
van Zyl et al The Pediatric Infectious Disease Journal • Volume 29, Number 4, April 2010
© 2010 Lippincott Williams & Wilkins370 | www.pidj.com
estimate the exact prevalence but to reliably categorize it: to
classify prevalence as either Ͻ5%, between 5% and 15%, or
Ͼ15% a sequential sample of at most 47 is needed.5
Genotypic
antiretroviral drug resistance testing does not form part of routine
management, but patients who were consecutively referred from
the Cape Town Metropolitan region were enrolled for baseline
genotypic antiretroviral drug resistance testing before initiation of
ART from March 2007 to September 2009. About 49 children, from
1 to 17 (median, 3.7) months-of-age, were included, of whom 35 had
documented evidence of being exposed to the Western Cape PMTCT-
regimen, 6 had no record and 8 did not receive PMTCT. The Western
Cape regimen consists of azidothymidine (AZT) from 28 weeks
gestation to the mother with additional NVP intrapartum. The baby
receives NVP within 72 hours of birth and 7 days of AZT (or 28 days
if mothers had less than 4 weeks of AZT). Since there was limited
patient information available, we could not access how many patients
were fully compliant with the regimen.
Antiretroviral resistance testing was done using an accred-
ited in-house genotypic sequencing assay. Sequences were inter-
preted using the updated WHO Surveillance drug resistance mu-
tation list.6
RESULTS
Testing yielded 48 reverse transcription and 49 protease
sequences. Of these, none had any nucleoside reverse transcriptase
inhibitor (NRTI)- or protease inhibitor (PI)- and 3 had non-
nucleoside reverse transcriptase inhibitor (NNRTI) SDRM. These
3 patients had received NVP as part of PMTCT. Using the WHO
binomial testing model, this survey predicts a low (Ͻ5%) preva-
lence of TDR to NRTIs and PIs and, since 3 of the first 47 patients
tested had NNRTI resistance, the prevalence of NNRTI resistance
can be classified as intermediate: 5% to 15%.
DISCUSSION
We found a low prevalence (Ͻ5%) of resistance to NRTIs
and PIs in antiretroviral naive children whereas 3 out of 48
patients, all of whom had received NVP as part of PMTCT, had
NNRTI SDRM. In view of the high NVP exposure through
PMTCT regimens, South African children less than 3-years-of-age
receive a regimen consisting of NRTIs and a PI. Therefore, we
were primarily interested in detecting any transmitted NRTI and PI
resistance, while we expected substantial NNRTI resistance.
Polymerase chain reaction followed by bulk sequencing is
the current standard for TDR surveillance. However, allele-spe-
cific assays were shown to detect a higher prevalence of NNRTI
mutations in NVP PMTC exposed patients in some studies,11
but
not in others.12
Nevertheless, we may have underestimated NNRTI
resistance since most NNRTI resistance in these children would be
PMTCT-induced, rather than transmitted and competing popula-
tions of wild-type virus may more rapidly displace drug-induced
mutants, than in the case of transmission of a single resistant strain,
where there is lack of competition with wild-type. Bulk sequencing
may also underestimate the prevalence of certain transmitted
mutations such as M184V due to its effect on viral fitness13
which,
although not detected, may result in early virological failure after
commencement of therapy.14
The use of these new allele-specific
assays has, as yet, not been fully validated in TDR surveillance but
we plan to employ them in future studies.
The rapid scale-up of ART in South Africa warrants sur-
veillance of patient groups in which one can expect to see an
increase in the prevalence of transmitted resistance. In the Western
Cape Province, especially in urban areas, ART coverage is already
high. Using projections from the Actuarial Society of South
Africa15
and provincial data (personal communication), the esti-
mated ART coverage in April 2009 was 79% for adults and 89%
for children; thus, PMTCT coverage is almost universal.16
Some
TDR surveillance data for adults exist for sub-Saharan Africa, but
worldwide there are few data for children. The choice of ART
regimens recommended for children should be carefully consid-
ered, especially since therapy needs to be initiated early, and
therapy options should be retained to ensure life-long treatment.
Based on these data one can expect a good response to the current
first-line regimen used in South African children less than 3-years-
of-age, which includes NRTIs and a boosted PI. Further TDR
surveillance in children, especially in areas such as the Western
Cape with high ART and PMTCT coverage, should be a priority and
such surveillance should be repeated regularly to detect any increase
in prevalence that may compromise antiretroviral regimens.
REFERENCES
1. Pillay D. Current patterns in the epidemiology of primary HIV drug
resistance in North America and Europe. Antivir Ther. 2004;9:695–702.
2. Chaix ML, Descamps D, Wirden M, et al. Stable frequency of HIV-1
transmitted drug resistance in patients at the time of primary infection over
1996–2006 in France. AIDS. 2009;23:717–724.
3. Petroni A, Deluchi G, Pryluka D, et al. Update on primary HIV-1 resistance
in Argentina: emergence of mutations conferring high-level resistance to
nonnucleoside reverse transcriptase inhibitors in drug-naive patients.
J Acquir Immune Defic Syndr. 2006;42:506–510.
4. Rodrigues R, Scherer LC, Oliveira CM, et al. Low prevalence of primary
antiretroviral resistance mutations and predominance of HIV-1 clade C at
polymerase gene in newly diagnosed individuals from south Brazil. Virus
Res. 2006;116:201–207.
5. Myatt M, Bennett DE. A novel sequential sampling technique for the
surveillance of transmitted HIV drug resistance by cross-sectional survey
for use in low resource settings. Antivir Ther. 2008;13(suppl 2):37–48.
6. Bennett DE, Camacho RJ, Otelea D, et al. Drug resistance mutations for
surveillance of transmitted HIV-1 drug-resistance: 2009 update. PLoS ONE.
2009;4:e4724.
7. Church JD, Mwatha A, Bagenda D, et al. In utero HIV infection is
associated with an increased risk of nevirapine resistance in Ugandan
infants who were exposed to perinatal single dose nevirapine. AIDS Res
Hum Retroviruses. 2009;25:673–677.
8. Arrive E, Newell ML, Ekouevi DK, et al. Prevalence of resistance to
nevirapine in mothers and children after single-dose exposure to prevent
vertical transmission of HIV-1: a meta-analysis. Int J Epidemiol. 2007;36:
1009–1021.
9. Persaud D, Palumbo P, Ziemniak C, et al. Early archiving and predomi-
nance of nonnucleoside reverse transcriptase inhibitor-resistant HIV-1
among recently infected infants born in the United States. J Infect Dis.
2007;195:1402–1410.
10. Violari A, Cotton MF, Gibb DM, et al. Early antiretroviral therapy and
mortality among HIV-infected infants. N Engl J Med. 2008;359:2233–
2244.
11. Hauser A, Mugenyi K, Kabasinguzi R, et al. Detection and quantification of
minor human immunodeficiency virus type 1 variants harboring K103N and
Y181C resistance mutations in subtype A and D isolates by allele-specific
real-time PCR. Antimicrob Agents Chemother. 2009;53:2965–2973.
12. Church JD, Huang W, Parkin N, et al. Comparison of laboratory methods
for analysis of non-nucleoside reverse transcriptase inhibitor resistance in
Ugandan infants. AIDS Res Hum Retroviruses. 2009;25:657–663.
13. Toni TA, Asahchop EL, Moisi D, et al. Detection of human immunodefi-
ciency virus (HIV) type 1 M184V and K103N minority variants in patients
with primary HIV infection. Antimicrob Agents Chemother. 2009;53:1670–
1672.
14. Metzner KJ, Giulieri SG, Knoepfel SA, et al. Minority quasispecies of
drug-resistant HIV-1 that lead to early therapy failure in treatment-naive
and -adherent patients. Clin Infect Dis. 2009;48:239–247.
15. Dorrington R. Western Cape HIV ASSA projection output. 2005. Available
at: http://www.capegateway.gov.za/eng/pubs/reports_research/W/142134.
Accessed June 23, 2009.
16. Eley B. Addressing the paediatric HIV epidemic: a perspective from the
Western Cape Region of South Africa. Trans R Soc Trop Med Hyg.
2006;100:19–23.
The Pediatric Infectious Disease Journal • Volume 29, Number 4, April 2010 Antiretroviral Resistance
© 2010 Lippincott Williams & Wilkins www.pidj.com | 371
MULTIMETHOD ADHERENCE ASSESSMENT IN
CHILDREN WITH PERINATALLY ACQUIRED HIV-1
THE INFLUENCE OF OFF-SCHEDULE DOSING IN
PREDICTING BIOLOGICAL MARKERS
Patricia A. Garvie, PhD,*† Megan L. Wilkins, PhD,*
Elizabeth D. Kolivas, BA,* and J. Christopher Young, MA*
Abstract: To improve upon adherence assessment in children with HIV,
multimethod adherence strategies (pill count, missed doses, off-schedule
dosing) were conducted concurrent with viral load and CD4% biomarker
assays. Off-schedule dosing predicted both health status markers, while the
more common strategies did not. Findings support inclusion of off-
schedule dosing concurrent with collection of biomarkers to assess adher-
ence in children with HIV.
Key Words: adherence assessment, off-schedule dosing, pediatric HIV,
youth, ARV
Accepted for publication October 16, 2009.
From the *Department of Behavioral Medicine, St. Jude Children’s Research
Hospital, Memphis, TN; and †Department of Pediatrics, University of
Tennessee Health Science Center, Memphis, TN.
Supported by the American Lebanese Syrian Associated Charities.
The funding source had no role or input in the design or conduct of the
study; collection, management, analysis, or interpretation of the data; or
preparation, review, or approval of the manuscript. The authors have no
conflicts of interest or financial disclosures to make.
Address for correspondence: Patricia A. Garvie, PhD, St. Jude Children’s
Research Hospital, 262 Danny Thomas Place, MS 740, Memphis, TN
38105. E-mail: patti.garvie@stjude.org.
DOI: 10.1097/INF.0b013e3181c67686
Medication adherence and accurate adherence assessment in
children with HIV are vital to effective treatment. Nonad-
herence to antiretroviral (ARV) medications allows viral replica-
tion and mutation that can lead to treatment resistance and more
complicated medication regimens.1
No single best adherence as-
sessment strategy exists for children with HIV. Utilizing multi-
method assessment strategies may better capture adherence behav-
iors and address limitations associated with any single measure.
While pill counts yield significant associations with viral
load (VL),2– 6
clinical utility is limited by significant staff time
demands, cost constraints, and potential social desirability (eg,
“pill dumping”).7
Retrospective recall is the most commonly used
adherence assessment strategy because of ease of administration,
cost effectiveness, and clinical utility.7
Recall methods typically
rely on caregiver report of how many doses were missed within a
specified period. Methodologic limitations, including socially de-
sirable responding, difficulty recalling everyday events, and lack
of continuous assessment may account for inconsistent findings
with VL2,3
and may result in adherence overestimations than object-
ive methods.7
Recent pediatric studies failed to find a relationship
between caregivers’ 3-day recall of missed doses and child VL2
while
others reported significant findings with VL.3
Inconsistent reports
necessitate further investigation into the accuracy and efficacy of
adherence recall methods for children with HIV.
Dose timing is an essential aspect of adherence due to risk
of developing medication resistance associated with temporal
dosing inconsistency.1
To better evaluate relationships among
adherence with VL and CD4 biomarkers, off-schedule dosing
should be assessed. True adherence may be overestimated when
doses are not missed, but still not taken as prescribed.4,8
This study
contributes to better understanding the impact of off-schedule
dosing on child health outcomes.
Treatment efficacy and disease progression are monitored
routinely via CD4 and VL biomarker assays. Within the pediatric
HIV adherence literature, investigations frequently only reported
VL.2,4,6,8,9
Given the contribution of each biomarker to under-
standing disease progression and treatment response, concurrent
CD4 and VL monitoring is warranted. Reported relationships
among CD4 and adherence in children with HIV have been
mixed,3,5,10
and comparison of findings is complicated by whether
CD4 count, CD4%, or both were monitored.
Biomarkers typically have not been monitored concurrently
with adherence, often collected within 90 days of adherence assess-
ment.2,6
Studies utilizing concurrent assessment reliably detect sig-
nificant VL-adherence relationships.3,4,9,10
Concurrent CD4-adher-
ence assessments are limited and findings are mixed.3,5,10
To improve on prior methodology, the present study col-
lected VL and CD4% biomarkers concurrent with multimethod
adherence assessment strategies. Off-schedule dosing was mea-
sured to investigate the role of inconsistent interval dosing on child
VL and CD4%. Hypotheses: (1) pharmacy pill count would predict
both child VL and CD4%; and (2) caregiver report of 3-day missed
and 3-day off-schedule dosing would predict both child increased
VL and decreased CD4%.
METHOD
Participants
Sixty caregivers of children with perinatally acquired HIV-1
presenting for routine multidisciplinary pediatric HIV care in the
Mid-Southern United States were recruited consecutively. Child
demographics: Mean (M) age 8.0 years (SD ϭ 4.26); 53% female;
85% African American, 13% Caucasian; 92% were on a twice
daily, 3-drug (75%) or 4-drug regimen (17%). Caregiver demo-
graphics: Mean age 39.7 years (SD ϭ 11.6); 93% women; 85%
African American, 15% Caucasian; 66.7% biologic parent, 25%
other relative, 8% adoptive parent; 55% HIV-positive; 57% un-
employed.
Data Collection
This single-site prospective cross-sectional study was insti-
tutional review board-approved. Caregivers provided written con-
sent, and completed a study-specific semistructured interview to
obtain demographic information and caregiver report of child
medication adherence via 3-day retrospective recall of number of
child ARV doses missed, and doses taken, but off-schedule (not as
prescribed). Additionally, ARV adherence was assessed by phar-
macy pill count (percentage of medication returned/total medica-
tion dispensed). Child CD4 and VL assays were drawn per routine
clinical care on the date of caregiver participation, and pharmacy
pill count was obtained.
One critical aspect of the 3-day recall methodology imple-
mented includes calculations of off-schedule dosing in relation to
reported missed doses. Participants were asked at what time(s) the
child was required to take ARV medications and which medica-
tions were prescribed for each dose time, allowing for the assess-
ment of medications prescribed once-daily within a twice-daily
regimen. Respondents were asked “how many doses of each ARV
medication were missed yesterday morning? And, evening?”
“How about the day before that?” “And, the day before that?”
Similarly, to assess off-schedule dosing, caregivers were asked,
“Over the past 3 days, how many doses of each ARV medication
was not taken when it was supposed to be?” beginning with
yesterday morning, etc. Caregivers estimated by how much time each
off-schedule dose was taken early or late. Doses taken within 1 hour
of the expected dose time were considered adherent. Off-schedule
Garvie et al The Pediatric Infectious Disease Journal • Volume 29, Number 4, April 2010
© 2010 Lippincott Williams & Wilkins372 | www.pidj.com
calculations took into account doses missed, determining the propor-
tion of doses actually taken, but not as prescribed.
Statistical Analyses
Analyses were conducted using SPSS 15.0. Due to signifi-
cant skewness, variables were dichotomized based on clinical
criteria. Child CD4% was recoded by Center for Disease Control
clinical classification of immunosuppression (Ͻ25% vs. Ն25%).
VL was dichotomized as undetectable/detectable (Ͻ400 copies/mL
vs. Ն400 copies/mL). Caregiver report of missed doses and off-
schedule dosing were recoded as nonadherent/adherent (missed vs.
none; off-schedule vs. none). Pharmacy pill counts were dichoto-
mized (Ͻ93% vs. Ն93%) corresponding with missing Ͼ2 days’
doses within 30 days. Phi coefficient analyses examined relationships
among the 3 adherence assessment strategies. Predictive validity of
each assessment strategy on child CD4% and VL was analyzed via
logistic regression.
RESULTS
Adherence by pharmacy pill count was M ϭ 91.41% (SD ϭ
9.71), and Ͼ95% for 40% of the sample. Further, 83% of care-
givers reported no missed doses for their child over the 3-day
recall period; 77% reported no off-schedule doses during the same
3-day period. Caregivers reported ϳ5.7% of doses were missed
(Median ͓Mdn͔ ϭ 0, SD ϭ 17.49) and 12% taken off-schedule
(Mdn ϭ 0, SD ϭ 26.87); thus, ϳ18% (Mdn ϭ 0, SD ϭ 29.95) of
all prescribed doses were either missed or taken off-schedule per
3-day recall.
Dichotomously coded adherence variables were evaluated for
multicollinearity. Results (Table 1) revealed a significant relationship
between adherence assessed by pill count and 3-day recall of doses
missed (␾ ϭ Ϫ0.29, P ϭ 0.02). Neither pharmacy pill count
(␾ ϭ Ϫ0.05, P ϭ 0.69) nor 3-day recall of doses missed significantly
related to doses taken off-schedule (␾ ϭ 0.18, P ϭ 0.17).
Univariate logistic regression analyses (Table 2) revealed
caregiver 3-day recall of off-schedule doses significantly predicted
child CD4% suppression (Wald ␹2
ϭ 4.44, P ϭ 0.04, OR ϭ 4.18;
CI0.95 ϭ 1.11–15.79), but caregiver report of missed doses (Wald
␹2
ϭ 0.48, P ϭ 0.49, OR ϭ 1.71; CI0.95 ϭ 0.38–7.84) and
pharmacy pill count (Wald ␹2
ϭ 0.40, P ϭ 0.53, OR ϭ 1.53;
CI0.95 ϭ 0.41–5.68) did not. Caregiver report of doses taken
off-schedule (Table 3) significantly predicted child detectable VL
(Wald ␹2
ϭ 3.64, P ϭ 0.06, OR ϭ 3.38; CI0.95 ϭ 0.97–11.78), but
doses missed (Wald ␹2
ϭ 0.66, P ϭ 0.42, OR ϭ 0.55; CI0.95 ϭ
0.13–2.36) and pharmacy pill count (Wald ␹2
ϭ 1.67, P ϭ 0.20,
OR ϭ 0.50; CI0.95 ϭ 0.17–1.43) did not.
DISCUSSION
Validating ARV adherence assessment remains of para-
mount importance, both in pediatric HIV clinical care and clinical
investigation. Nonetheless, a gold standard to assess adherence
remains elusive. Study findings emphasize the importance of
including off-schedule dosing assessment when evaluating adher-
ence. Results also support inclusion of both CD4% and VL
biomarkers given independent relationships to self-reported adher-
ence. Collecting both indices, rather than VL alone, increased the
likelihood of identifying adherence difficulties in children with
perinatally acquired HIV and the impact of suboptimal adherence
on both immune composition and viral control.
The most commonly used assessment strategies, pharmacy
pill count and caregiver recall of missed doses, failed to predict
child VL or CD4% suppression, despite relatively high adherence
rates. Inclusion of off-schedule dosing provided a more refined
analysis of overall adherence behaviors. Participants who other-
wise appeared adherent by pill count and/or doses missed ac-
knowledged difficulty administering medications as prescribed, an
extremely important health consideration given risk to develop
medication resistance because of temporally inconsistent ARV
dosing. Thus, off-schedule dosing assessment may represent a
more externally valid and sensitive measure of adherence behav-
ior, providing clinical insight beyond other methods.
Study findings are tempered by limitations inherent to a
relatively small 1-time cross-sectional single-site sample, and
utilization of self-report measures and pill counts, which are
vulnerable to social desirability demands. Dichotomization of data
due to skewness also may limit findings.
Limited methodologic and analytical descriptions in prior
studies compounded by contradictory results make interpretation,
comparison across studies, and replication difficult. Study findings
demonstrate concurrent assessment of biomarkers and off-sched-
ule dosing more accurately illulminate the influence of nonadher-
ence behaviors in children with HIV. Routinely employing these
methods may allow earlier detection and intervention to improve
dose-timing consistency and prevent viral replication and devel-
opment of medication resistance. Methodologic detail regarding
how adherence is assessed and analyzed should be included in
future reports to encourage replication and permit comparison
across studies. Replication with a larger multisite cohort across
treatment settings to clarify further the contribution of off-schedule
dosing, concurrent collection of biologic assays, and adherence
assessment is warranted.
ACKNOWLEDGMENTS
The authors thank the families living with HIV who partic-
ipated and whose contributions provided invaluable information
TABLE 1. Phi Coefficient Correlations Between
Multiple Measures of Adherence
Pill
Count
Recall
Missed
Recall
Off-Schedule
Pharmacy pill count — Ϫ0.29* Ϫ0.05
Recall missed — 0.18
Recall off-schedule —
*P ϭ 0.02.
TABLE 2. Prediction of CD4 Suppression (CD4% Ͻ25)
Wald OR CI0.95
Total recall adherence 5.43* 4.67 1.28–17.28
Recall off-schedule 4.44†
4.18 1.11–15.80
Recall missed doses 0.48 1.71 0.38–7.84
Pharmacy pill count 0.40 1.53 0.41–5.68
*P ϭ 0.02.
†
P ϭ 0.03.
TABLE 3. Prediction of Detectable Viral Load (Ͼ400)
Wald OR CI0.95
Total recall adherence 0.85 1.67 0.56–4.93
Recall off-schedule 3.64* 3.38 0.97–11.78
Recall missed doses 0.66 0.55 0.13–2.36
Pharmacy pill count 1.67 0.50 0.17–1.43
*P ϭ 0.06.
The Pediatric Infectious Disease Journal • Volume 29, Number 4, April 2010 Off-Schedule Dosing in HIV
© 2010 Lippincott Williams & Wilkins www.pidj.com | 373
about their experiences with medication adherence for their chil-
dren; graduate research assistants who contributed toward data
collection and entry, Will Dalton, III, PhD, Rebecca West De-
deaux, MS, Ericka Midgett, MS, Christy Jayne Curtis, PhD, and
Clinical Research Associates, Jo Lawford, PhD, and Megan Ba-
net, MA, who in addition monitored data collection, developed the
database, and managed the data.
REFERENCES
1. Liu H, Miller LG, Hays RD, et al. Repeated measures longitudinal analyses
of HIV virologic response as a function of the percent adherence, dose
timing, genotypic sensitivity and other factors. J Acquir Immune Defic
Syndr. 2006;41:315–322.
2. Farley J, Hines S, Musk A, et al. Assessment of adherence to antiviral
therapy in HIV-infected children using the medication event monitoring
system, pharmacy refill, provider assessment, caregiver self-report, and
appointment keeping. J Acquir Immune Defic Syndr. 2003;33:211–218.
3. Van Dyke RB, Lee S, Johnson GM, et al. Reported adherence as a determinant
of response to highly active antiretroviral therapy in children who have human
immunodeficiency virus infection. Pediatrics. 2002;109:e61.
4. Wiener L, Riekert K, Ryder C, et al. Assessing medication adherence in
adolescents with HIV when electronic monitoring is not feasible. AIDS
Patient Care STDS. 2004;18:527–538.
5. Watson DC, Farley JJ. Efficacy of and adherence to highly active antiret-
roviral therapy in children infected with human immunodeficiency virus
type 1. Pediatr Infect Dis J. 1999;18:682–689.
6. Marhefka SL, Farley JJ, Rodrigue JR, et al. Clinical assessment of medi-
cation adherence among HIV-infected children: examination of the treat-
ment interview protocol (TIP). AIDS Care. 2004;16:323–338.
7. Kerr T, Walsh J, Lloyd-Smith E, et al. Measuring adherence to highly active
antiretroviral therapy: implications for research and practice. Curr HIV/
AIDS Rep. 2005;2:200–205.
8. Marhefka SL, Tepper VJ, Farley JJ, et al. Brief report: assessing adherence
to pediatric antiretroviral regimens using the 24-hour recall interview.
J Pediatr Psychol. 2006;31:989–994.
9. Naar-King S, Frey M, Harris M, et al. Measuring adherence to treatment of
paediatric HIV/AIDS. AIDS Care. 2005;17:345–349.
10. Martin S, Elliot-DeSorbo DK, Wolters PL, et al. Patient, caregiver, and
regimen characteristics associated with adherence to highly active antiret-
roviral therapy among HIV-infected children and adolescents. Pediatr
Infect Dis J. 2007;6:61–67.
POPULATION BASED EXTERNAL VALIDATION OF
A EUROPEAN PREDICTIVE MODEL FOR
RESPIRATORY SYNCYTIAL VIRUS
HOSPITALIZATION OF PREMATURE INFANTS
BORN 33 TO 35 WEEKS OF GESTATIONAL AGE
Lone G. Stensballe, MD, PhD,* John R. Fullarton, PhD,†
Xavier Carbonell-Estrany, MD,‡ and Eric A. F. Simo˜es, MD§
Abstract: Prospectively collected population-based data on 2529 Danish
infants born at 33 to 35 weeks of gestation were used to validate an
European predictive model of respiratory syncytial virus (RSV) hospital-
ization. The model was found to be robust with a diagnostic accuracy of
65.9% to distinguish between RSV-hospitalized versus non-RSV-hospital-
ized Danish infants born at 33 to 35 weeks of gestation.
Accepted for publication October 27, 2009.
From the *Bandim Health Project, Statens Serum Institut, Copenhagen,
Denmark; †Strategen Limited, Basingstoke, Hampshire, United Kingdom;
‡Neonatology Service, Hospital Clinic, Institut Clinic de Ginecologia Obstetri-
cia I Neonatologia, Agrupacio´ Sanitaria Hospital Clínic-Hospital SJ Deu,
Universitat de Barcelona, Barcelona, Spain; and §Department of Pediatrics,
Section of Infectious Diseases, The University of Colorado School of Medicine
and The Children’s Hospital, Denver, CO.
Supported by Abbott Laboratories for work on various projects (to J.R.F.).
Also, by the Abbott Laboratories (to L.G.S., E.S., and X.C.E.).
The data management for the establishment of the Danish dataset was funded
un-restricted by Abbott Laboratories, Denmark.
Address for correspondence: Lone G. Stensballe, MD, PhD, Bandim
Health Project, Statens Serum Institut, Copenhagen, Denmark. E-mail:
lgn@ssi.dk.
DOI: 10.1097/INF.0b013e3181c810da
Premature infants are at increased risk of hospitalization, with
severe respiratory syncytial virus (RSV) airway infection.1
Passive immunoprophylaxis with a humanized monoclonal anti-
body, palivizumab, has been shown to reduce the risk of RSV
hospitalization in preterm infants.2
However, passive immunopro-
phylaxis for all infants born 33 to 35 weeks of gestation (wGA) is
not considered cost-effective in most European countries.3
Thus,
there is a need, in an evidence-based manner, to identify infants
born 33 to 35 wGA with the greatest likelihood of RSV hospital-
ization in whom to target immunoprophylaxis. This approach has
recently been modeled by Simoes et al4,5
who used data on infants
born 33 to 35 wGA from Spain and Germany to define a European
RSV hospitalization predictive model.
However the rates of RSV hospitalization in Northern
Europe are lower than the rates in Spain, prompting us to examine
the usefulness of this model in a Scandinavian population. We
used population-based data prospectively collected on 2529 infants
born 33 to 35 wGA in Denmark to present an external statistical
test of the robustness of the European RSV predictive model.
METHODS
In the publication by Simoes et al,5
7 variables describing
the most important risk factors for RSV hospitalization in prema-
ture infants 33 to 35 wGA in Spain were identified. These variables
were “birth within 10 weeks of the start of the season,” “birth
weight,” “breast-feeding Յ2 months,” “number of siblings Ն2
years of age,” “number of family members with atopy,” “male
sex,” and “number of family members with wheeze.” In the
original study, information on these 7 factors examined by dis-
criminant function analysis resulted in a diagnostic accuracy of
71% when trying to identify premature infants hospitalized with
RSV. Discriminant function analysis optimizes the variables which
discriminate between 2 or more naturally occurring groups, here
RSV-hospitalized versus non-RSV-hospitalized premature infants
33 to 35 wGA.
Using prospectively collected population based data on
93,620 births during 1997 to 2003 from the Danish National Birth
Cohort (DNBC) (www.BSMB.dk),6
2529 infants born 33 to 35
wGA and followed until the age of 18 months after birth were
identified and data on the 7 variables described above were
withdrawn in August 2008. For 3 of the 7 variables, the DNBC
data did not exactly represent the Spanish data. In the Spanish data,
information on siblings was defined to be number of siblings Ն2
years of age, but in the DNBC data number of siblings represented
the total number of siblings below 12 years of age excluding any
twin from multiple births. In the Spanish data, information on
close relatives with wheeze or atopy included information on
siblings and grandparents; but in the DNBC data close relatives
with atopy was calculated with no data on grandparents available,
and close relatives with wheeze was calculated with no data on
grandparents and siblings available. Furthermore, other variables
containing information on other established RSV hospitalization
risk factors and information on mortality were withdrawn from
DNBC. The additional risk factors included data on parental
smoking during and after pregnancy, parental educational level,
pets in the home, day care attendance, and chronic lung disease.
The information on RSV season also included in the modeling was
based on the Danish RSV season, November to April.
Stensballe et al The Pediatric Infectious Disease Journal • Volume 29, Number 4, April 2010
© 2010 Lippincott Williams & Wilkins374 | www.pidj.com
This Danish dataset was used to externally validate the
robustness of the European Predictive Model. Information on the
7 variables in the Danish data was used to generate a discriminant
function in the Danish dataset itself, resulting in a percentage value
of true classification (here, of predicted RSV hospitalization) and
receiver-operating-characteristic (ROC) plots of the sensitivity by
(1–specificity) with areas closest to 1 predicting best predictive
accuracy. Premature 33 to 35 wGA case infants who experienced
RSV hospitalization were compared with premature 33 to 35 wGA
case infants without RSV hospitalization. The analysis was carried
out on all data with automatic substitution of neutral values for
missing data, and secondarily, with exclusion of missing values.
The neutral values were calculated from the mean values in the 2
outcome groups (hospitalized and nonhospitalized) and set so as to
provide no bias in the discriminate functions derived from the data
so modified. There were complete information on date of birth,
sex, siblings, and on if any family member among parents or
siblings had any atopic disease. For information on if any family
member had wheeze, 32 individuals (1.3%) had missing informa-
tion. For birth weight, 46 individuals (1.8%) had missing infor-
mation. For breast-feeding, 993 individuals (39.3%) had missing
information. The model was sought to be improved by serially
removing variables from the model, by inclusion on information
on the other established risk factors, and by substituting categorical
(Yes/No) variables for atopy and wheeze. Finally, the unadjusted
coefficients generated from the Spanish study were applied to the
Danish data. All analyses were carried out using SPSS 15 for
Windows.
RESULTS
A total of 2614 infants included in DNBC were born 33
to 35 wGA (gestational days 231 to 251). Of them, 37 stillborn
infants were excluded. Forty-six infants who died during fol-
low-up were excluded from the analyses, one had chronic lung
disease and none of these infants experienced RSV hospitaliza-
tion. 2 infants without RSV hospitalization had chronic lung
disease and were excluded from the analyses. Of the 2529
infants born 33 to 35 wGA left for follow-up, 139 (5.5%)
experienced an RSV hospitalization.
When the Danish data were used to validate the 7-variable
European Predictive Model and the analysis was carried out on all
data with automatic substitution of neutral values for missing data,
the resulting diagnostic accuracy was 65.9%, with an area under
the ROC curve of 0.625 (0.578–0.673) (Figure 1). The negative
predictive value at the point of maximum discrimination for the
Danish data was 0.86. If the missing data was excluded from the
analyses, the resulting diagnostic accuracy was 63.3%, with an
area under the ROC curve of 0.598 (0.524–0.671). The exclusion
of missing data reduced the number of RSV cases to 66 and
controls to 991.
When variables were serially removed from the model,
improvement was achieved when atopy was eliminated, giving
68.1% correct classification and AUC 0.634 (0.586–0.681). Op-
timization was attempted by substituting categorical (Yes/No)
variables for atopy and wheeze and by using all the variables in the
data set, but with no improvement. Since the variable “birth within
10 weeks of the start of the season” had the greatest positive
impact on the fit of the predictive model, further optimization was
achieved by stratifying the data by season, leading to improvement
of the diagnostic accuracy in some but not all seasons (data not
shown, available on request).
When the discriminant function analysis was based on the
unadjusted coefficients from the FLIP dataset with information on
Spanish infants 33 to 35 wGA, the diagnostic accuracy was 62%
and the area under the ROC curve was 0.598 (0.553–0.644).
DISCUSSION
The present population-based cohort study externally vali-
dated the recently published European RSV hospitalization pre-
dictive study to test the robustness of that model when used in
other European infant populations. The model included informa-
tion on globally established risk factors for RSV hospitalization:
time of birth, birth weight, male sex, breast-feeding, siblings, and
family disposition to atopy and wheeze.1,7,8
Using data on Danish
premature infants born week 33 to 35 of gestation, we found a
diagnostic accuracy of nearly 66% of the model.
A diagnostic accuracy of about 66% might not appear high.
However, in the study by Simoes et al5
where the original model
tested in the present study was generated it was found that using,
for example, the Spanish Guidelines to identify premature children
at increased risk of RSV hospitalization was not better than
chance. Denmark has no specific guidelines; the Danish Pediatric
Society recommends individual judgment when the use of RSV
prophylaxis is considered.
Our study was limited by several factors. Despite the large
overall sample size, the total number of 139 RSV hospitalized
infants born 33 to 35 wGA set statistical limitations. The data set
were not precisely alike the data collected for the FLIP study and
some of the variables had considerable missing values. We tested
the diagnostic accuracy in the subset of the DNBC dataset without
any missing information and found it to be essentially the same.
FIGURE 1. ROC curve: Receiver-operating-characteristic
(ROC) plot (sensitivity by (1–specificity)) for the Danish 7
variable model with automatic substitution of neutral val-
ues for missing data.
Notes: Data from the Danish National Birth Cohort
(DNBC) (www.BSMB.dk) August 2008. The 7 variables
were “birth within 10 weeks of the start of the season,”
“birth weight,” “breast-feeding Յ2 months,” “number of
siblings Ն2 years of age,” “number of family members
with atopy,” “male sex,” and “number of family members
with wheeze.” ROC plot areas closest to 1 predict best pre-
dictive accuracy.
The Pediatric Infectious Disease Journal • Volume 29, Number 4, April 2010 RSV Hospitalization Predictive Model
© 2010 Lippincott Williams & Wilkins www.pidj.com | 375
However, the European RSV hospitalization predictive
model proved robust to external validation and the diagnostic
accuracy remained satisfying. Recently, such a RSV risk-scoring
tool based on information on the same 7 RSV risk factors was
evaluated in Canadian infants 33 to 35 wGA and was found to be
practical and effective in reducing RSV hospitalization in infants
who are most at risk, while avoiding prophylaxis in the 82% of the
GA cohort who were considered low risk for RSV infection.9
In
countries like Denmark without RSV prophylaxis guidelines for
premature infants and where the use of RSV prophylaxis is based
solely on individual judgment, a risk-scoring model might improve
the use and efficacy of RSV prophylaxis.
CONCLUSION AND PERSPECTIVE
This external validation of the European RSV predictive model
confirmed the robustness of the model. Based on the model, computer
software could be developed and offered to European neonatal de-
partments to optimize the cost-effectiveness of the use of passive
prophylaxis against RSV in premature infants born 33 to 35 wGA.
REFERENCES
1. Law BJ, Langley JM, Allen U, et al. The Pediatric Investigators Collab-
orative Network on Infections in Canada study of predictors of hospital-
ization for respiratory syncytial virus infection for infants born at 33
through 35 completed weeks of gestation. Pediatr Infect Dis J. 2004;23:
806–814.
2. Connor EM; The IMpact-RSV Study Group. Palivizumab, a humanized
respiratory syncytial virus monoclonal antibody, reduces hospitalization
from respiratory syncytial virus infection in high-risk infants ͓see com-
ments͔. Pediatrics. 1998;102:531–537.
3. Wang D, Cummins C, Bayliss S, et al. Immunoprophylaxis against respira-
tory syncytial virus (RSV) with palivizumab in children: a systematic review
and economic evaluation. Health Technol Assess. 2008;12:iii, ix–x, 1–86.
4. Figueras-Aloy J, Carbonell-Estrany X, Quero J. Case-control study of the
risk factors linked to respiratory syncytial virus infection requiring hospital-
ization in premature infants born at a gestational age of 33–35 weeks in
Spain. Pediatr Infect Dis J. 2004;23:815–820.
5. Simoes EA, Carbonell-Estrany X, Fullarton JR, et al. A predictive model for
respiratory syncytial virus (RSV) hospitalization of premature infants born at
33–35 weeks of gestational age, based on data from the Spanish FLIP Study.
Respir Res. 2008;9:78.
6. Olsen J, Melbye M, Olsen SF, et al. The Danish National Birth Cohort—
its background, structure and aim. Scand J Public Health. 2001;29:300–
307.
7. Stensballe LG, Kristensen K, Simoes EA, et al. Atopic disposition, wheez-
ing, and subsequent respiratory syncytial virus hospitalization in Danish
children younger than 18 months: a nested case-control study. Pediatrics.
2006;118:e1360–e1368.
8. Carbonell-Estrany X, Figueras-Aloy J, Law BJ. Identifying risk factors for
severe respiratory syncytial virus among infants born after 33 through 35
completed weeks of gestation: different methodologies yield consistent
findings. Pediatr Infect Dis J. 2004;23:S193–S201.
9. Paes B, Steele S, Janes M, et al. Risk-scoring tool for respiratory syncytial
virus prophylaxis in premature infants born at 33–35 completed weeks’
gestational age in Canada. Curr Med Res Opin. 2009;25:1585–1591.
ANTIRETROVIRAL-RELATED HEMATOLOGIC
SHORT-TERM TOXICITY IN HEALTHY INFANTS
IMPLICATIONS OF THE NEW NEONATAL 4-WEEK
ZIDOVUDINE REGIMEN
Rebeca Lahoz, MD,* Antoni Noguera, MD, PhD,*
Nu´ria Rovira, MD,* Albert Catala`, MD,* Emília Sa´nchez, MD, PhD,†
Rafael Jime´nez, MD, PhD,* and Cla`udia Fortuny, MD, PhD*
Abstract: Recent updates of the guidelines on the prevention of human
immunodeficiency virus mother-to-child transmission have shortened the
neonatal zidovudine prophylactic regimens from 6 to 4 weeks. We present
a prospective observational study in a large cohort of mother-infant pairs
and report that the 4-week regimen allows an earlier recovery of the anemia
in these otherwise healthy infants.
Key Words: hematologic toxicity, human immunodeficiency virus,
neonatal prophylaxis, pediatrics, zidovudine
Accepted for publication October 27, 2009.
From the Departments of *Pediatrics, and †Hematology, Pediatric Infectious
Diseases Unit, Hospital Sant Joan de De´u-Universitat de Barcelona, Barce-
lona, Spain; and ‡Catalan Agency for Health Technology Assessment and
Research, Barcelona, Spain.
Address for correspondence: Antoni Noguera, MD, PhD, Infectious Diseases
Unit, Pediatrics Department, Hospital Sant Joan de De´u, Passeig Sant Joan
de De´u 2, 08950 Esplugues, Barcelona, Spain. E-mail: ton@hsjdbcn.org.
Supplemental digital content is available for this article. Direct URL
citations appear in the printed text and are provided in the HTML and
PDF versions of this article on the journal’s Web site (www.pidj.com).
DOI: 10.1097/INF.0b013e3181c81fd4
Mother-to-child transmission (MTCT) of human immuno-
deficiency virus (HIV) in developed countries has de-
creased to Ͻ2% after the implementation of prophylactic mea-
sures, such as the use of antiretrovirals (ARV), elective
cesarean section, and refraining from breast-feeding.1–3
Expo-
sure of these otherwise healthy infants to one or more drugs of
unknown toxicity is of concern. To date, most of the reported
hematologic and mitochondrial adverse effects, of which
zidovudine (ZDV)-related reversible anemia is the most com-
mon, have shown mild clinical significance.4 – 8
After the PACTG 076 study,9
the 6-week neonatal oral
ZDV chemoprophylaxis regimen became standard care. Since
2005, HIV-exposed neonates in the United Kingdom have been
treated for 4 weeks,3
in accordance with postexposure prophylaxis
(PEP) guidelines in other situations.10
We investigated whether the
new 4-week neonatal ZDV regimen has led to a decrease in
hematologic toxicity in a large cohort of HIV-uninfected infants.
MATERIALS AND METHODS
A single-center prospective observational study was con-
ducted in a cohort of mother-infant pairs, followed up prospec-
tively from January 2000 in a tertiary-care pediatric hospital in
Barcelona (Spain). Informed consent was obtained from all women
at enrollment and the study protocol was approved by the local
Ethics Committee. As per protocol, demographic, clinical, and
laboratory data are routinely collected on all patients, and a
complete clinical examination and blood tests were performed at
every visit (at 2, 3, and 6 weeks, and at 3, 6, and 12 months of age).
Laboratory tests included a full blood picture and a viral load assay
(proviral HIV-DNA, Amplicor HIV until year 2003, and HIV-
RNA quantification, CA HIV Monitor, thereafter; Roche, Basel,
Switzerland).
HIV-exposed uninfected infants were eligible if they had
been exposed to ARV during gestation and had received ZDV
monotherapy during the neonatal period. According to current
guidelines,1
an infant was defined as HIV-uninfected if 2 or more
viral load tests were negative, with one test at age 1 month or older
and one test at age 4 months or older. The following exclusion
criteria were used: hepatitis C virus (HCV) infection, gestational
age at birth less than 36 weeks, and the presence of any other
medical condition capable of causing hematologic disorders.
Patients were initially defined according to the length of their
neonatal ZDV treatment period, a 6-week regimen or a 4-week
regimen, according to current guidelines at the time of birth. A
univariate assessment of differences in toxicity between the 2 groups
Lahoz et al The Pediatric Infectious Disease Journal • Volume 29, Number 4, April 2010
© 2010 Lippincott Williams & Wilkins376 | www.pidj.com
was conducted using the ␹2
test for categorical variables and the t test
for continuous variables. Multivariate regression analyses controlling
for several factors known to be associated with hematologic variables
(maternal age, ethnicity, drug use, CD4 cell count and plasma viral
load, type and length of ARV regimens during pregnancy, and the
infant’s sex, gestational age, and weight at birth) were used to assess
the association between the different ARV treatment regimens and the
outcome variables. All tests were 2-tailed, and a P value Ͻ0.05 was
considered significant. Statistical analysis was performed with the
SPSS 12.0 Program.
RESULTS
As of June 2008, 221 infants had been enrolled in the
cohort. Among these, 50 patients were excluded because of:
neonatal ARV prophylaxis other than ZDV monotherapy (n ϭ 13),
HIV infection (n ϭ 5, all of them diagnosed during the first week
of life), hepatitis C virus infection (n ϭ 11), gestational age at birth
less than 36 weeks (n ϭ 10), and other medical conditions (n ϭ
11). The final study cohort consisted of 171 patients (80 women,
46.8%). Overall, 138 patients (80.7%) received a 6-week neonatal
regimen of oral ZDV, while 33 (19.3%) received the new 4-week
regimen. Most of the children in the latter group were born from
2005 onwards. All children were exclusively bottle-fed and none
received prophylactic trimethoprim-sulfamethoxazole.
Data regarding gestation, birth, and neonatal clinical vari-
ables are summarized in the Table, Supplemental Digital Content
1, http://links.lww.com/INF/A334. At delivery, mothers in the
6-week ZDV group were significantly younger (P ϭ 0.022), and
had been treated more often with stavudine (34% vs. 12%, P ϭ
0.015) and nelfinavir (36% vs. 12%, P ϭ 0.008) and less often with
emtricitabine (0% vs. 12%, P ϭ 0.001), abacavir (4% vs. 15%, P ϭ
0.039), and tenofovir (1% vs. 12%, P ϭ 0.014) as part of their highly
active antiretroviral therapy (HAART) regimens.
Lower mean hemoglobin values (12.1 vs. 13.1 g/dL; P ϭ
0.006) and a higher rate on all Division of Acquired Immunode-
ficiency Syndrome toxicity grades11
in hemoglobin concentrations
(76% vs. 48%; P ϭ 0.005) at the age of 2 to 3 weeks were
observed in infants whose mothers had received ZDV as part of
their HAART regimens during pregnancy. These findings persisted
in multivariate analyses (odds ratio: 4.28 for any toxicity in
hemoglobin values when ZDV was included in maternal therapy;
95% confidence interval ͓CI͔: 1.01–18.05; P ϭ 0.048). No other
differences in baseline characteristics or associations between
those and hematologic findings were observed (data not shown).
Overall, no statistically significant differences were ob-
served in hemoglobin, mean corpuscular volume (MCV), neutro-
phil, lymphocyte, and platelet counts (Figs. 1A–E) between the 2
groups, except for MCV values at 6 weeks and 3 months of age,
which were lower in the 4-week ZDV group (P Ͻ 0.0001 and P ϭ
0.002, respectively; Fig. 1B). In both groups, mean MCV was
higher than reference values up to the age of 6 weeks and later
became normal. Changes over time in significant abnormalities
6
7
8
9
10
11
12
13
14
15
3 w 6 w 3 m 6 m 12 m
50
60
70
80
90
100
110
120
3w 6w 3m 6m 12m
p <.0001
p =.002
0
1000
2000
3000
4000
5000
6000
7000
3w 6w 3m 6m 12m
2000
3000
4000
5000
6000
7000
8000
9000
10000
11000
12000
3w 6w 3m 6m 12m
0
100000
200000
300000
400000
500000
600000
700000
3w 6w 3m 6m 12m
hemoglobin (g/dl) mean corpuscular volume (fl)
neutrophils per mm3 lymphocytes per mm3
platelets per mm 3
A B
C D
E
FIGURE 1. A to E, Changes over time of the different hematologic parameters according to the length of the neonatal
zidovudine regimen, 6 weeks (solid line) or 4 weeks (dotted line).
The Pediatric Infectious Disease Journal • Volume 29, Number 4, April 2010 Neonatal Zidovudine Toxicity
© 2010 Lippincott Williams & Wilkins www.pidj.com | 377
3335 Ext Val p374
3335 Ext Val p374
3335 Ext Val p374
3335 Ext Val p374
3335 Ext Val p374

More Related Content

What's hot

Effectiveness of the Influenza vaccine . Dr. Sharda Jain , Lifecare Cent...
Effectiveness of the Influenza vaccine . Dr. Sharda Jain , Lifecare Cent...Effectiveness of the Influenza vaccine . Dr. Sharda Jain , Lifecare Cent...
Effectiveness of the Influenza vaccine . Dr. Sharda Jain , Lifecare Cent...Lifecare Centre
 
SNAPSHOT ON INFLUENZA VACCINE ,Dr. Sharda Jain Dr. Jyoti Agarwal Dr. Jyoti ...
SNAPSHOT ON INFLUENZA VACCINE ,Dr. Sharda Jain  Dr. Jyoti Agarwal  Dr. Jyoti ...SNAPSHOT ON INFLUENZA VACCINE ,Dr. Sharda Jain  Dr. Jyoti Agarwal  Dr. Jyoti ...
SNAPSHOT ON INFLUENZA VACCINE ,Dr. Sharda Jain Dr. Jyoti Agarwal Dr. Jyoti ...Lifecare Centre
 
H1 n1 influenza a disease information for health professionals lindsey_nejm 2009
H1 n1 influenza a disease information for health professionals lindsey_nejm 2009H1 n1 influenza a disease information for health professionals lindsey_nejm 2009
H1 n1 influenza a disease information for health professionals lindsey_nejm 2009Ruth Vargas Gonzales
 
Seasonal Influenza Immunization Pilot Project in Prince Edward Island, Canada
Seasonal Influenza Immunization Pilot Project in Prince Edward Island, CanadaSeasonal Influenza Immunization Pilot Project in Prince Edward Island, Canada
Seasonal Influenza Immunization Pilot Project in Prince Edward Island, CanadaGlobal Risk Forum GRFDavos
 
Is Tamiflu safe during pregnancy?
Is Tamiflu safe during pregnancy?Is Tamiflu safe during pregnancy?
Is Tamiflu safe during pregnancy?Ashraf ElAdawy
 
Adult Vaccine 2013 final
 Adult Vaccine 2013 final Adult Vaccine 2013 final
Adult Vaccine 2013 finalahmed saad
 
Influenza - History, Vaccination, and Public Health
Influenza - History, Vaccination, and Public HealthInfluenza - History, Vaccination, and Public Health
Influenza - History, Vaccination, and Public HealthLouise O' Flynn
 
CNS Iinfection dengue, Teaching Slides, Dr M D Mohire, Kolhapur, Maharashtra,...
CNS Iinfection dengue, Teaching Slides, Dr M D Mohire, Kolhapur, Maharashtra,...CNS Iinfection dengue, Teaching Slides, Dr M D Mohire, Kolhapur, Maharashtra,...
CNS Iinfection dengue, Teaching Slides, Dr M D Mohire, Kolhapur, Maharashtra,...Mahavir Mohire
 
Influenza vaccine in CKD
Influenza vaccine in CKDInfluenza vaccine in CKD
Influenza vaccine in CKDAshraf ElAdawy
 
Trivalent Inactivated Seasonal Influenza Vaccine 2019
Trivalent Inactivated Seasonal Influenza Vaccine 2019Trivalent Inactivated Seasonal Influenza Vaccine 2019
Trivalent Inactivated Seasonal Influenza Vaccine 2019Ashraf ElAdawy
 
Adult Vaccination in an ageing society: Immune response
Adult Vaccination in an ageing society: Immune responseAdult Vaccination in an ageing society: Immune response
Adult Vaccination in an ageing society: Immune responseILC- UK
 
Vaccination in adults - Slideset by Professor Paolo Bonanni
Vaccination in adults - Slideset by Professor Paolo BonanniVaccination in adults - Slideset by Professor Paolo Bonanni
Vaccination in adults - Slideset by Professor Paolo BonanniWAidid
 
At the four front of flu vaccination - Quadrivalent Flu Vaccination in India ...
At the four front of flu vaccination - Quadrivalent Flu Vaccination in India ...At the four front of flu vaccination - Quadrivalent Flu Vaccination in India ...
At the four front of flu vaccination - Quadrivalent Flu Vaccination in India ...Gaurav Gupta
 
INFLUENZA VACCINE UPDATE 2020 BY DR SHAILESH MEHTA
INFLUENZA VACCINE UPDATE 2020 BY DR SHAILESH MEHTAINFLUENZA VACCINE UPDATE 2020 BY DR SHAILESH MEHTA
INFLUENZA VACCINE UPDATE 2020 BY DR SHAILESH MEHTADR SHAILESH MEHTA
 
Vall d'hebron 2015
Vall d'hebron 2015Vall d'hebron 2015
Vall d'hebron 2015Fran Garcia
 
Inactivated seasonal influenza vaccines
Inactivated seasonal influenza vaccinesInactivated seasonal influenza vaccines
Inactivated seasonal influenza vaccinesAshraf ElAdawy
 

What's hot (19)

Effectiveness of the Influenza vaccine . Dr. Sharda Jain , Lifecare Cent...
Effectiveness of the Influenza vaccine . Dr. Sharda Jain , Lifecare Cent...Effectiveness of the Influenza vaccine . Dr. Sharda Jain , Lifecare Cent...
Effectiveness of the Influenza vaccine . Dr. Sharda Jain , Lifecare Cent...
 
SNAPSHOT ON INFLUENZA VACCINE ,Dr. Sharda Jain Dr. Jyoti Agarwal Dr. Jyoti ...
SNAPSHOT ON INFLUENZA VACCINE ,Dr. Sharda Jain  Dr. Jyoti Agarwal  Dr. Jyoti ...SNAPSHOT ON INFLUENZA VACCINE ,Dr. Sharda Jain  Dr. Jyoti Agarwal  Dr. Jyoti ...
SNAPSHOT ON INFLUENZA VACCINE ,Dr. Sharda Jain Dr. Jyoti Agarwal Dr. Jyoti ...
 
H1 n1 influenza a disease information for health professionals lindsey_nejm 2009
H1 n1 influenza a disease information for health professionals lindsey_nejm 2009H1 n1 influenza a disease information for health professionals lindsey_nejm 2009
H1 n1 influenza a disease information for health professionals lindsey_nejm 2009
 
Seasonal Influenza Immunization Pilot Project in Prince Edward Island, Canada
Seasonal Influenza Immunization Pilot Project in Prince Edward Island, CanadaSeasonal Influenza Immunization Pilot Project in Prince Edward Island, Canada
Seasonal Influenza Immunization Pilot Project in Prince Edward Island, Canada
 
Is Tamiflu safe during pregnancy?
Is Tamiflu safe during pregnancy?Is Tamiflu safe during pregnancy?
Is Tamiflu safe during pregnancy?
 
Adult Vaccine 2013 final
 Adult Vaccine 2013 final Adult Vaccine 2013 final
Adult Vaccine 2013 final
 
Influenza - History, Vaccination, and Public Health
Influenza - History, Vaccination, and Public HealthInfluenza - History, Vaccination, and Public Health
Influenza - History, Vaccination, and Public Health
 
CNS Iinfection dengue, Teaching Slides, Dr M D Mohire, Kolhapur, Maharashtra,...
CNS Iinfection dengue, Teaching Slides, Dr M D Mohire, Kolhapur, Maharashtra,...CNS Iinfection dengue, Teaching Slides, Dr M D Mohire, Kolhapur, Maharashtra,...
CNS Iinfection dengue, Teaching Slides, Dr M D Mohire, Kolhapur, Maharashtra,...
 
Influenza vaccine in CKD
Influenza vaccine in CKDInfluenza vaccine in CKD
Influenza vaccine in CKD
 
Influenza vaccine
Influenza vaccineInfluenza vaccine
Influenza vaccine
 
Trivalent Inactivated Seasonal Influenza Vaccine 2019
Trivalent Inactivated Seasonal Influenza Vaccine 2019Trivalent Inactivated Seasonal Influenza Vaccine 2019
Trivalent Inactivated Seasonal Influenza Vaccine 2019
 
Adult Vaccination in an ageing society: Immune response
Adult Vaccination in an ageing society: Immune responseAdult Vaccination in an ageing society: Immune response
Adult Vaccination in an ageing society: Immune response
 
Vaccination in adults - Slideset by Professor Paolo Bonanni
Vaccination in adults - Slideset by Professor Paolo BonanniVaccination in adults - Slideset by Professor Paolo Bonanni
Vaccination in adults - Slideset by Professor Paolo Bonanni
 
influenza virus
influenza virusinfluenza virus
influenza virus
 
JURNAL ANAK
JURNAL ANAKJURNAL ANAK
JURNAL ANAK
 
At the four front of flu vaccination - Quadrivalent Flu Vaccination in India ...
At the four front of flu vaccination - Quadrivalent Flu Vaccination in India ...At the four front of flu vaccination - Quadrivalent Flu Vaccination in India ...
At the four front of flu vaccination - Quadrivalent Flu Vaccination in India ...
 
INFLUENZA VACCINE UPDATE 2020 BY DR SHAILESH MEHTA
INFLUENZA VACCINE UPDATE 2020 BY DR SHAILESH MEHTAINFLUENZA VACCINE UPDATE 2020 BY DR SHAILESH MEHTA
INFLUENZA VACCINE UPDATE 2020 BY DR SHAILESH MEHTA
 
Vall d'hebron 2015
Vall d'hebron 2015Vall d'hebron 2015
Vall d'hebron 2015
 
Inactivated seasonal influenza vaccines
Inactivated seasonal influenza vaccinesInactivated seasonal influenza vaccines
Inactivated seasonal influenza vaccines
 

Viewers also liked (19)

3335wGA RSV Prediction
3335wGA RSV Prediction3335wGA RSV Prediction
3335wGA RSV Prediction
 
Natural presentations test
Natural presentations testNatural presentations test
Natural presentations test
 
Valeria xd
Valeria xdValeria xd
Valeria xd
 
cv
cv cv
cv
 
Tarea quimica agric
Tarea quimica agricTarea quimica agric
Tarea quimica agric
 
Work11
Work11Work11
Work11
 
Dumpster Rental
Dumpster RentalDumpster Rental
Dumpster Rental
 
La celula
La celulaLa celula
La celula
 
RSV Prev CE Analysis
RSV Prev CE AnalysisRSV Prev CE Analysis
RSV Prev CE Analysis
 
社員満足度を上げたい経営者の皆様へ。
社員満足度を上げたい経営者の皆様へ。社員満足度を上げたい経営者の皆様へ。
社員満足度を上げたい経営者の皆様へ。
 
UConn HSRAP 2012 - PP Oral Presentation
UConn HSRAP 2012 - PP Oral PresentationUConn HSRAP 2012 - PP Oral Presentation
UConn HSRAP 2012 - PP Oral Presentation
 
CV_JSLagman
CV_JSLagmanCV_JSLagman
CV_JSLagman
 
ค ม_อ
ค  ม_อค  ม_อ
ค ม_อ
 
HHA_Catalogue_fn_2016
HHA_Catalogue_fn_2016HHA_Catalogue_fn_2016
HHA_Catalogue_fn_2016
 
MegaCorp Overview
MegaCorp OverviewMegaCorp Overview
MegaCorp Overview
 
Role of technology
Role of technologyRole of technology
Role of technology
 
5 INDIAN BRANDS IN THE MARKET
5 INDIAN BRANDS IN THE MARKET 5 INDIAN BRANDS IN THE MARKET
5 INDIAN BRANDS IN THE MARKET
 
ODX Clin Util Pub
ODX Clin Util PubODX Clin Util Pub
ODX Clin Util Pub
 
Lessons in reading the learning landscape
Lessons in reading the learning landscapeLessons in reading the learning landscape
Lessons in reading the learning landscape
 

Similar to 3335 Ext Val p374

2854-Article Text-12962-1-18-20230410.doc
2854-Article Text-12962-1-18-20230410.doc2854-Article Text-12962-1-18-20230410.doc
2854-Article Text-12962-1-18-20230410.docRizalMarubobSilalahi
 
2854-Article Text-12482-1-18-20230117 (3).doc
2854-Article Text-12482-1-18-20230117 (3).doc2854-Article Text-12482-1-18-20230117 (3).doc
2854-Article Text-12482-1-18-20230117 (3).docRizalMarubobSilalahi
 
Covid 19 aka mers cov2 update and perinatal covid
Covid 19 aka mers cov2 update and perinatal covidCovid 19 aka mers cov2 update and perinatal covid
Covid 19 aka mers cov2 update and perinatal covidSri ChowdarRy
 
Sars cov 2 em criancas
Sars cov 2 em criancasSars cov 2 em criancas
Sars cov 2 em criancasgisa_legal
 
Covid 19 in children consensus statement
Covid 19 in children consensus statementCovid 19 in children consensus statement
Covid 19 in children consensus statementgisa_legal
 
Clinico-aetiological study of Pneumonia in two months to five years children
Clinico-aetiological study of Pneumonia in two months to five years children Clinico-aetiological study of Pneumonia in two months to five years children
Clinico-aetiological study of Pneumonia in two months to five years children sumit nayek
 
Clinical chacateristics of novel coronavirua in newborns, infants, and children
Clinical chacateristics of novel coronavirua in newborns, infants, and childrenClinical chacateristics of novel coronavirua in newborns, infants, and children
Clinical chacateristics of novel coronavirua in newborns, infants, and childrengisa_legal
 
A Serological Survey of Human Parainfluenza Viruses (HPIVs) among Children in...
A Serological Survey of Human Parainfluenza Viruses (HPIVs) among Children in...A Serological Survey of Human Parainfluenza Viruses (HPIVs) among Children in...
A Serological Survey of Human Parainfluenza Viruses (HPIVs) among Children in...iosrjce
 
Transmision vertical covid Dr. Freddy Flores Malpartida
Transmision vertical covid Dr. Freddy Flores MalpartidaTransmision vertical covid Dr. Freddy Flores Malpartida
Transmision vertical covid Dr. Freddy Flores MalpartidaFreddy Flores Malpartida
 
Swineflu Update, An Indian Prespective
Swineflu  Update, An Indian PrespectiveSwineflu  Update, An Indian Prespective
Swineflu Update, An Indian Prespectivechandra talur
 
Vino final powerpoint
Vino final powerpointVino final powerpoint
Vino final powerpointViroNovative
 
The study of congenital cytomegalovirus, Rubella and Herpes Simplex Virus-2 i...
The study of congenital cytomegalovirus, Rubella and Herpes Simplex Virus-2 i...The study of congenital cytomegalovirus, Rubella and Herpes Simplex Virus-2 i...
The study of congenital cytomegalovirus, Rubella and Herpes Simplex Virus-2 i...Apollo Hospitals
 
Pediatric community acquired pneumonia
Pediatric community acquired pneumoniaPediatric community acquired pneumonia
Pediatric community acquired pneumoniaSamiaa Sadek
 
CLINICAL FEATURES, DIFFERENCES IN COVID FIRST, SECOND, THIRD WAVES- A DATA BA...
CLINICAL FEATURES, DIFFERENCES IN COVID FIRST, SECOND, THIRD WAVES- A DATA BA...CLINICAL FEATURES, DIFFERENCES IN COVID FIRST, SECOND, THIRD WAVES- A DATA BA...
CLINICAL FEATURES, DIFFERENCES IN COVID FIRST, SECOND, THIRD WAVES- A DATA BA...DrHeena tiwari
 

Similar to 3335 Ext Val p374 (20)

Corona Virus Update
Corona Virus UpdateCorona Virus Update
Corona Virus Update
 
Rsv ( dr okasha)
Rsv ( dr okasha)Rsv ( dr okasha)
Rsv ( dr okasha)
 
2854-Article Text-12962-1-18-20230410.doc
2854-Article Text-12962-1-18-20230410.doc2854-Article Text-12962-1-18-20230410.doc
2854-Article Text-12962-1-18-20230410.doc
 
ANAK WHEEZING.pdf
ANAK WHEEZING.pdfANAK WHEEZING.pdf
ANAK WHEEZING.pdf
 
Human metapneumovirus
Human  metapneumovirusHuman  metapneumovirus
Human metapneumovirus
 
2854-Article Text-12482-1-18-20230117 (3).doc
2854-Article Text-12482-1-18-20230117 (3).doc2854-Article Text-12482-1-18-20230117 (3).doc
2854-Article Text-12482-1-18-20230117 (3).doc
 
Covid 19 aka mers cov2 update and perinatal covid
Covid 19 aka mers cov2 update and perinatal covidCovid 19 aka mers cov2 update and perinatal covid
Covid 19 aka mers cov2 update and perinatal covid
 
Atb y resistencia en neumonias virales
Atb y resistencia en neumonias viralesAtb y resistencia en neumonias virales
Atb y resistencia en neumonias virales
 
Sars cov 2 em criancas
Sars cov 2 em criancasSars cov 2 em criancas
Sars cov 2 em criancas
 
Covid 19 in children consensus statement
Covid 19 in children consensus statementCovid 19 in children consensus statement
Covid 19 in children consensus statement
 
Clinico-aetiological study of Pneumonia in two months to five years children
Clinico-aetiological study of Pneumonia in two months to five years children Clinico-aetiological study of Pneumonia in two months to five years children
Clinico-aetiological study of Pneumonia in two months to five years children
 
Clinical chacateristics of novel coronavirua in newborns, infants, and children
Clinical chacateristics of novel coronavirua in newborns, infants, and childrenClinical chacateristics of novel coronavirua in newborns, infants, and children
Clinical chacateristics of novel coronavirua in newborns, infants, and children
 
A Serological Survey of Human Parainfluenza Viruses (HPIVs) among Children in...
A Serological Survey of Human Parainfluenza Viruses (HPIVs) among Children in...A Serological Survey of Human Parainfluenza Viruses (HPIVs) among Children in...
A Serological Survey of Human Parainfluenza Viruses (HPIVs) among Children in...
 
Transmision vertical covid Dr. Freddy Flores Malpartida
Transmision vertical covid Dr. Freddy Flores MalpartidaTransmision vertical covid Dr. Freddy Flores Malpartida
Transmision vertical covid Dr. Freddy Flores Malpartida
 
Swineflu Update, An Indian Prespective
Swineflu  Update, An Indian PrespectiveSwineflu  Update, An Indian Prespective
Swineflu Update, An Indian Prespective
 
Vino final powerpoint
Vino final powerpointVino final powerpoint
Vino final powerpoint
 
The study of congenital cytomegalovirus, Rubella and Herpes Simplex Virus-2 i...
The study of congenital cytomegalovirus, Rubella and Herpes Simplex Virus-2 i...The study of congenital cytomegalovirus, Rubella and Herpes Simplex Virus-2 i...
The study of congenital cytomegalovirus, Rubella and Herpes Simplex Virus-2 i...
 
Early Onset Neonatal Sepsis
Early Onset Neonatal SepsisEarly Onset Neonatal Sepsis
Early Onset Neonatal Sepsis
 
Pediatric community acquired pneumonia
Pediatric community acquired pneumoniaPediatric community acquired pneumonia
Pediatric community acquired pneumonia
 
CLINICAL FEATURES, DIFFERENCES IN COVID FIRST, SECOND, THIRD WAVES- A DATA BA...
CLINICAL FEATURES, DIFFERENCES IN COVID FIRST, SECOND, THIRD WAVES- A DATA BA...CLINICAL FEATURES, DIFFERENCES IN COVID FIRST, SECOND, THIRD WAVES- A DATA BA...
CLINICAL FEATURES, DIFFERENCES IN COVID FIRST, SECOND, THIRD WAVES- A DATA BA...
 

3335 Ext Val p374

  • 1. BRIEF REPORTS HUMAN RHINOVIRUS CAUSES SEVERE INFECTION IN PRETERM INFANTS Rene´e O. van Piggelen, MD,* Anton M. van Loon, PhD,† Tanette G. Krediet, MD, PhD,* and Malgorzata A. Verboon-Maciolek, MD, PhD* Abstract: Data of 11 infants (median gestational age and birth weight 30 weeks and 1520 g, respectively) with severe human rhinovirus infection (HRV) are described. Nine of 11 (82%) were preterm infants and 7 of these 9 (78%) became infected during their stay in the neonatal intensive care unit. All infants presented with respiratory distress and all needed respi- ratory support for a median of 6 days. Radiologic findings included perihilar streakiness, atelectasis, focal consolidation, and hyperinflation. The diagnosis of HRV infection was made by real-time polymerase chain reaction in nasopharyngeal aspirate. All infants recovered from their HRV infection. HRV can cause severe disease in preterm infants requiring respiratory support. Key Words: human rhinovirus, neonatal infection, preterm infant Accepted for publication October 20, 2009. From the Departments of *Neonatology, and †Virology, University Med- ical Center, Utrecht, The Netherlands. Address for correspondence: Malgorzata A. Verboon-Maciolek, MD, PhD, Department of Neonatology, University Medical Center, Lundlaan 6, 3584 EA Utrecht, KE 04.123.1, The Netherlands. E-mail: m.verboon- maciolek@umcutrecht.nl. Copyright © 2010 by Lippincott Williams & Wilkins DOI: 10.1097/INF.0b013e3181c6e60f Human rhinoviruses (HRV) are a major cause of common cold in adults and children.1 Usually HRV infections run a mild course, but it has recently been shown that HRV can be associated with severe lower respiratory tract infection in children.2 There are no published data available on HRV infections in preterm infants. We retrospectively analyzed the data of all neonates with con- firmed HRV infection admitted to our neonatal intensive care unit (NICU) from 2003 until 2008. MATERIALS AND METHODS We included all infants with a confirmed diagnosis of HRV infection and admitted from 2003, when the HRV real-time poly- merase chain reaction (PCR) was introduced in our hospital, until 2008. We analyzed the clinical, virologic, radiologic and labora- tory data of these infants. The diagnosis of HRV infection was made on the basis of a positive real-time PCR for HRV in a nasopharyngeal aspirate. Samples of all infants were also tested by real-time PCR for the following viral and bacterial pathogens: respiratory syncytial virus (RSV), human metapneumovirus, para- influenzaviruses 1 to 4, influenzaviruses A and B, human corona- viruses (HCoV: 229E, OC43, and NL-63), adenoviruses, Myco- plasma pneumoniae, Chlamydia pneumoniae, and since 2006 bocavirus. All PCRs were real-time assays based on TaqMan probes. The target for the HRV PCR was the 5Ј noncoding region of the genome. The amount of virus in each sample was recorded semi-quantitatively based on the cycle threshold (Ct) value of the sample in the PCR. The Ct value indicates the number of cycles needed in PCR before a sample becomes positive, and is therefore directly related to the amount of viral genome in the sample. Thus, a low Ct value corresponds to a high viral load, and a high Ct value to a low viral load. HRV was recorded as the dominating virus in a sample when the Ct value was at least 4 cycles lower than the Ct value for any other virus. Ct values above 45 were considered to be negative. Molecular typing of HRV was not performed. RESULTS During the study period viral infection was suspected in 62 infants admitted to our NICU. Depending on the clinical presen- tation (sepsis, meningitis, or pneumonia) we looked for viral agents of infection in different clinical samples. In patients with pneumonia we performed a PCR on respiratory viruses in naso- pharyngeal aspirate as described in the methods section. In 8 of 62 infants, we could not identify any virus. In 22 (41%) of 54 infants with a proven viral infection, we identified 24 respiratory viruses. The most frequently detected viruses were HRV (n ϭ 11) and RSV (n ϭ 8). The remaining respiratory viruses were HCoV (n ϭ 2), influenza virus (n ϭ 1), adenovirus (n ϭ 1), and parainfluenza virus (n ϭ 1). In 1 infant, 3 different respiratory viruses (HRV, RSV, and HCoV) were found. The characteristics of 11 infants with HRV infection are shown in Table 1. Nine of 11 infants (82%) were born prematurely with a median gestational age of 30 weeks (range: 26–32 weeks). The other 2 infants were born at term (39 and 41 weeks, respec- tively). One underwent surgical correction because of a diaphrag- matic hernia, whereas the other was admitted from home at 5 days of age. The median age at onset of symptoms was 49 days (range: 5–94 days). In 7 of 11 infants HRV infection was acquired during their hospital stay. The main presenting symptoms were respiratory distress (9/11), apnea (7/11), rhinorrhea (6/11), and hypothermia (5/11). All infants required respiratory support for a median of 6 days (range: 3–11 days), in 9 infants mechanical ventilation was nec- essary. The C-reactive protein was slightly elevated at onset of symptoms with a median value of 15 mg/L, and the white blood cell count was consistently normal. The Ct value of HRV was low in all infants with a median of 21 (range: 18.4–28.8) at onset of symptoms, indicating the presence of high viral loads of HRV in the respiratory tract. In 2 infants (patient 9 and 11), the Ct value increased from 24.6 to 29.4 and from 18.4 to 35.6, respectively, in samples taken 7 days later. Chest radiographs revealed perihilar streakiness (10/11), atelectasis (9/11), focal consolidation (6/11), and hyperinflation (6/11). Most infants had 2 or more of the above mentioned radiologic findings. One patient (patient 4) had a coinfection with 2 other viral pathogens, HCoV and RSV, but the viral loads of RSV (Ct: 35.1) and HCoV (Ct: 31.2) were consid- erably lower than that of HRV (Ct: 26.5). We did not find any nosocomial spread of HRV among our infants. Our patients were not clustered in time, but represented separate events. All infants recovered from the episode of HRV infection, but 4 patients (1 term and 3 preterm) subsequently developed recurrent lower re- spiratory tract infections. DISCUSSION Our study shows that HRV can cause severe pulmonary disease among infants admitted to a NICU. HRV is generally known as the causative agent of the common cold. The association of HRV with asthma exacerbations, wheezing, and lower respira- tory tract infections has been well recognized.2– 4 Recently, HRV also appeared to be an important reason for hospitalization in young children.5–7 However, HRV can also be detected in asymp- tomatic children.8 It is suggested that the identification of HRV in asymptomatic infants represents low-level infection without clin- ical symptoms, or is a first sign of developing illness.5 Data on HRV infections in very young infants are limited. In our previous retrospective analysis (1992–2003) of viral infections in our NICU, we found that HRV contributed to 2% of all proven viral infections among admitted infants.9 This percentage recently in- creased to 20% (unpublished data), which can be explained by the The Pediatric Infectious Disease Journal • Volume 29, Number 4, April 2010364 | www.pidj.com
  • 2. introduction of real-time PCR for the identification of viruses in infants with severe respiratory disease. The clinical presentation of HRV infection in infants de- scribed in our study did not differ from that of RSV infection.10,11 All infants developed rhinorrhea, respiratory distress, apnea, and hypothermia, and required respiratory support for 3 to 11 days. It was not possible to differentiate between RSV and HRV infection based on radiologic findings. The presence of atelectasis which changed position daily and the huge production of sputum were common findings. We recorded relatively low Ct values corre- sponding to relatively high viral loads in the respiratory samples of our patients. In one infant (patient 4), who was infected with 3 different respiratory viruses, HSV was considered the major caus- ative agent because of its lowest Ct value. In 2 infants the Ct value performed again after 7 days was increased significantly, which was associated with clinical recovery. All infants recovered, but 4 developed recurrent respiratory tract infections which could not be explained solely by prematurity. In conclusion, HRV can cause severe pulmonary disease in preterm infants, requiring respiratory support. REFERENCES 1. Brownlee JW, Turner RB. New developments in the epidemiology and clinical spectrum of rhinovirus infections. Curr Opin Pediatr. 2008;20: 67–71. 2. Louie JK, Roy-Burman A, Guardia-Labar L, et al. Rhinovirus associated with severe lower respiratory tract infections in children. Pediatr Infect Dis J. 2009;28:337–339. 3. Tan WC. Viruses in asthma exacerbations. Curr Opin Pulm Med. 2005;11: 21–26. 4. Kusel MM, de Klerk NH, Holt PG, et al. Role of respiratory viruses in acute upper and lower respiratory tract illness in the first year of life: a birth cohort study. Pediatr Infect Dis J. 2006;25:680–686. 5. Jartti T, Lee WM, Pappas T, et al. Serial viral infections in infants with recurrent respiratory illnesses. Eur Respir J. 2008;32:314–320. 6. Miller EK, Lu X, Erdman DD, et al. Rhinovirus-associated hospitalizations in young children. J Infect Dis. 2007;195:773–781. 7. Piotrowska Z, Vazquez M, Shapiro ED, et al. Rhinoviruses are a major cause of wheezing and hospitalization in children less than 2 years of age. Pediatr Infect Dis J. 2009;28:25–29. 8. Wright PF, Deatly AM, Karron RA, et al. Comparison of results of detection of rhinovirus by PCR and viral culture in human nasal wash specimens from subjects with and without clinical symptoms of respiratory illness. J Clin Microbiol. 2007;45:2126–2129. 9. Verboon-Maciolek MA, Krediet TG, Gerards LJ, et al. Clinical and epide- miologic characteristics of viral infections in a neonatal intensive care unit during a 12-year period. Pediatr Infect Dis J. 2005;24:901–904. 10. Prodhan P, Westra SJ, Lin J, et al. Chest radiological patterns predict the duration of mechanical ventilation in children with RSV infection. Pediatr Radiol. 2009;39:117–123. 11. Forster J, Schumacher RF. The clinical picture presented by premature neonates infected with respiratory syncytial virus. Eur J Pediatr. 1995;154: 901–905. TABLE 1. Clinical, Laboratory, Virologic and Radiologic Data of 11 Infants With HRV Infection Patient/Birth/Sex GA (wk) BW (g) Onset (d) Clinical Signs CRP at Onset (max) (mg/L) WBC Count at Onset ϫ109 /L Ct Value Respiratory Support (d) Chest Radiograph 1/October 2003/M 29 1495 34 Apneas, rhinorrhea, respiratory distress 9 (48) 7.0 28.3 4 Atelectasis, perihilar streakiness focal consolidation 2/February 2005/F 32 1900 18 Respiratory distress 17 (37) 16.7 23.4 6 Atelectasis, perihilar streakiness, hyperinflation 3/November 2005/M 30 1520 75 Hypothermia, rhinorrhea, respiratory distress 79 (81) 8.9 22.9 6 Atelectasis, perihilar streakiness, hyperinflation, focal consolidation 4/November 2005/F 32 2095 28 Hypothermia, apneas, respiratory distress 15 (109) 16.7 26.5 6 Atelectasis, perihilar streakiness, hyperinflation 5/May 2006/M* 32 1700 49 Respiratory distress 17 (17) 18 23.9 11 Atelectasis, perihilar streakiness, hyperinflation, focal consolidation 6/April 2006/F 28 895 90 Hypothermia, apneas 27 (27) 4.5 28.8 5 Atelectasis, perihilar streakiness 7/October 2006/M 29 970 94 Apneas, rhinorrhea, respiratory distress 2 (6) 9.5 27.1 7 Atelectasis, perihilar streakiness, hyperinflation, focal consolidation 8/November 2006/M 41 3050 5 Hypothermia, respiratory distress 16 (21) 10.6 19.5 3 Atelectasis, perihilar streakiness 9/April 2007/F 30 1150 45 Hypothermia, apneas, rhinorrhea 6 (6) 11.0 24.6 7 Perihilar streakiness 10/September 2007/M† 39 3480 50 Apneas, rhinorrhea, respiratory distress 2 (2) 7.7 20.5 11 Atelectasis, hyperinflation focal consolidation 11/December 2007/F‡ 26 890 68 Apneas, rhinorrhea, respiratory distress 2 (2) 10.1 18.4 8 Perihilar streakiness, focal consolidation *Patient 5: VACTERL anomaly. † Patient 10: congenital diaphragmatic hernia. ‡ Patient 11: chronic lung disease. The Pediatric Infectious Disease Journal • Volume 29, Number 4, April 2010 Human Rhinovirus Infection in Preterm Infants © 2010 Lippincott Williams & Wilkins www.pidj.com | 365
  • 3. CLINICAL PERFORMANCE OF A RAPID INFLUENZA TEST AND COMPARISON OF NASAL VERSUS THROAT SWABS TO DETECT 2009 PANDEMIC INFLUENZA A (H1N1) INFECTION IN THAI CHILDREN Piyarat Suntarattiwong, MD,* Richard G. Jarman, PhD,† Jens Levy, PhD,‡ Henry C. Baggett, MD, MPH,§ Robert V. Gibbons, MD, MPH,† Tawee Chotpitayasunondh, MD, DTM&H,* and James M. Simmerman, PhD, RN‡ Abstract: We identified febrile pediatric outpatients seeking care for influenza like illness in Bangkok. Two nasal and 1 throat swab were tested using the QuickVue AϩB rapid influenza kit and reverse transcription-polymerase chain reaction. Among 142 pandemic influenza A (H1N1)-positive patients, the QuickVue test identified 89 positive tests for a sensitivity of 62.7% (95% confidence interval ͓CI͔: 54.7–70.6). Specificity was 99.2% (95% CI: 98– 100). In the 0 to 2 years age group, sensitivity was 76.7% (95% CI: 61.5–91.8). Throat and nasal swabs are equally useful diagnostic specimens for reverse transcription-polymerase chain reaction diagnosis. Key Words: influenza, rapid diagnostic tests, pandemic, Thailand Accepted for publication October 20, 2009. From the *Queen Sirikit National Institute of Child Health Department of Medical Service, Ministry of Public Health, Bangkok, Thailand; †US Armed Forces Research Institute of Medical Sciences, Bangkok, Thailand; ‡Influenza Division, International Emerging Infections Program, Thailand MOPH-US CDC Collaboration, Nonthaburi, Thailand; and §International Emerging Infections Program, Thailand MOPH-US CDC Collaboration, Nonthaburi, Thailand. The opinions or assertions contained herein are the private views of the authors and are not to be construed as official, or as reflecting the views of the US Centers for Disease Control and Prevention, the Department of the Army or the Department of Defense. Address for correspondence: James M. Simmerman, PhD, RN, International Emerging Infections Program, Thailand MOPH-US CDC Collaboration, Box 68 CDC, APO AP 96546, Nonthaburi, Thailand. E-mail: msimmerman@cdc.gov. DOI: 10.1097/INF.0b013e3181c6f05c Anovel quadruple reassortant influenza A/H1N1 virus emerged in North America in early 2009 and rapidly spread to hundreds of countries around the world causing the World Health Organi- zation to declare a pandemic on June 11.1 Following sporadic infections in returning Thai travelers in May and June, community transmission was established and 14,976 cases and 119 deaths due to laboratory-confirmed 2009 pandemic influenza A (H1N1) virus infection were reported in Thailand by August 22, 2009.2 Rapid laboratory diagnosis of influenza can improve clinical care, facil- itate outbreak investigations, and support infection control mea- sures. Highly sensitive real-time reverse transcription-polymerase chain reaction (RTPCR) assays are the preferred diagnostic method but are complex and costly, often not available in devel- oping countries, and results are seldom available in time to influence treatment decisions. In contrast, commercially available rapid influenza diagnostic tests (RIDTs) are simple, produce re- sults in a few minutes, and are widely used to detect influenza infections in outpatient settings. Broadly, RIDTs have been found to have high specificity (76%–100%) but low to moderate sensi- tivity (10%–100%) to detect seasonal influenza viruses.3 We investigated the sensitivity and specificity of the Quick- Vue AϩB rapid influenza test to detect 2009 pandemic influenza A (H1N1) virus infection compared with real time RTPCR in febrile pediatric outpatients in Bangkok, Thailand. We also studied whether nasal or throat swabs produce superior specimens to detect the 2009 pandemic virus by RTPCR. MATERIALS AND METHODS The study was approved by the Ethical Review Committee of the Queen Sirikit National Institute of Child Health. During July 2009 and August 2009, we prospectively identified and obtained written consent from the guardians of pediatric patients who sought outpatient care for influenza-like illness (ILI). For children less than 2 years of age, ILI was defined as fever Ն38°C and one or more of the following symptoms: nasal discharge/congestion, cough, conjunctivitis, respiratory distress, sore throat, new seizure. For children Ն2 years of age ILI was defined as fever Ն38°C and cough or sore throat. Eligible patients were 1 month to 15 years of age. Rapid test results were immediately provided to the attending physician to support treatment decisions. RTPCR was used as the standard to calculate the performance of the rapid test. We ex- cluded subjects who tested positive by RTPCR for seasonal influ- enza strains from the analysis. We derived 95% confidence limits for sensitivity and specificity using the Wald-normal-approxima- tion using R version 2.8.1. We used the simple kappa coefficient to test for agreement between throat and nasal swabs by RTPCR. Specimens (2 nasal and 1 throat) were collected from each child by hospital nurses experienced in collecting respiratory swab specimens. The foam-tipped nasal swab provided by the manufac- turer was immediately tested according to manufacturer instruc- tions using the QuickVue Influenza AϩB rapid diagnostic kit (Quidel Co., San Diego, CA). The remaining Dacron-tipped nasal and throat swabs were immediately placed in separate M4RT viral transport media (Remel, Lenexa, KS), and sent the same day on wet ice to the Armed Forces Institute of Medical Sciences. These specimens were aliquoted within 24 hours and then stored at Ϫ70°C until processed for RTPCR. Viral ribonucleic acid was extracted from 140 ␮L of inoculated viral transport media using the QIAamp viral ribonucleic acid mini kit method (Qiagen, Los Angeles, CA) according to the manufacturer instructions. All respiratory samples were first tested with universal influenza A and universal influenza B primers and probes. Samples that were positive for universal influenza A were tested with 2009 pandemic influenza A (H1N1) primers and probe sequences. If negative for the pandemic strain, seasonal H1 and H3 specific probes and primer sequences were used. Probes and primers were developed by the US Centers for Disease Control and Prevention, Atlanta, GA. RESULTS Respiratory swab specimens were collected from 426 chil- dren of whom 418 had RTPCR results. Subjects ranged in age from 6 months to 14 years including 233 (56%) participants less than 3 years (Table 1). All subjects agreed to participate. No participants received antiviral medication prior to being tested. About 71% of participants were tested within the first 2 days following symptom onset (range: 0–8 days, median ϭ 2). Among 181 (43%) subjects whose nasal swab was RTPCR-positive for influenza, 142 (78%) were positive for the 2009 pandemic influ- enza A (H1N1) virus and 39 were positive for seasonal influenza viruses (30 type A/H3, 4 type A/H1, and 5 type B). Among the 142 pandemic influenza A (H1N1) RTPCR posi- tive patients, the QuickVue rapid test identified 89 positive tests for a sensitivity of 62.7% (95% confidence interval ͓CI͔: 54.7–70.6). Spec- ificity was 99.2% (95% CI: 98–100). In the 0 to 2 years age group, sensitivity was 76.7% (95% CI: 61.5–91.8). Two false-positives occurred in patients 0 to 2 years of age. The sensitivity of the rapid test was greatest in children less than 3 years of age. In this sample with a pandemic influenza A (H1N1) prevalence of 34%, the rapid test’s Suntarattiwong et al The Pediatric Infectious Disease Journal • Volume 29, Number 4, April 2010 © 2010 Lippincott Williams & Wilkins366 | www.pidj.com
  • 4. overall positive predictive value was 97.8% and negative predictive value was 81.6%. The sensitivity of the QuickVue test for seasonal influenza viruses was 27/39 or 69.2% (95% CI: 54.7–83.7). RTPCR results obtained from nasal and throat swabs were similar. A total of 142 of 418 (33.97%) nasal swabs were RTPCR positive for 2009 pandemic influenza A (H1N1) virus, while 140 (33.49%) throat swabs were RTPCR positive. The kappa value for agreement between the throat and nasal swab specimens for 2009 pandemic influenza A (H1N1) virus was 0.932 (95% CI: 0.89–0.97). When seasonal influ- enza viruses were included the kappa value was 0.939 (95% CI: 0.91–0.97). DISCUSSION We demonstrated that the QuickVue test had a sensitivity of 62.7% to detect 2009 pandemic influenza A (H1N1) viruses com- pared with RTPCR in febrile pediatric outpatients in Thailand. We used the World Health Organization case definition for ILI. Use of a broader case definition might have influenced the positive and nega- tive predictive values of the rapid test. In contrast to human infections with avian influenza A (H5N1) where throat and lower respiratory tract specimens have been found to be superior to nasal swabs,4 we observed no significant difference between throat and nasal swabs to identify 2009 pandemic influenza A(H1N1) by RTPCR. The performance of RIDTs may vary by virus subtype3 and has been poor when tested with nonhuman influenza viruses.5 While the 2009 pandemic influenza A (H1N1) virus is from a swine lineage, the QuickVue test demonstrated moderate sensitiv- ity similar to the performance of the same test with seasonal influenza viruses in pediatric age groups.6 However, recent small studies have reported lower sensitivity of RIDTs with the 2009 pandemic influenza A (H1N1) virus. Faix et al7 reported that the QuickVue Influenza AϩB test identified 20 of 39 patients who were 2009 pandemic influenza A (H1N1) positive by RTPCR for a sensitivity of 51% (95% CI: 35–67). Vasoo et al8 compared the performance of 3 RIDTs using 60 specimens from children and young adults that were tested positive by Luminex xTAG RVP and reported sensitivity of the QuickVue AϩB test was 53.3% (95% CI: 40.9–65.4). Drexler et al9 reported that compared with RT- PCR, the BinaxNOW Influenza A and B Rapid test had a sensi- tivity of 11.1% (95% CI: 6.7–17.7) in 144 pandemic influenza A(H1N1) positive patients with a median age of 18 years. Several factors may have contributed to the greater sensi- tivity we observed. First, our study population included only children and 71% were tested within 72 hours of symptom onset. Because children shed higher quantities of virus and for longer duration than adults,10 this may explain the higher sensitivity we observed compared with other studies where adult specimens were tested and the time from symptom onset to specimen collection was longer or unknown.7 Previous studies tested specimens that had been shipped, frozen, and thawed prior to testing which may have reduced the performance of the test. In our study, specimen collection was standardized and rapid testing was completed on fresh specimens within minutes of receipt. Seasonal and pandemic viruses continually undergo anti- genic drift which makes regular reassessment of the sensitivity of RIDTs essential. RIDT performance can vary by brand and by virus subtype. Adherence to package insert instructions and careful attention to clinical specimen quality is essential to optimize the performance of all RIDTs. For clinical decision-making, all results from RIDTs must be interpreted in the context of patient’s risk for serious complications, the severity of illness, and circulating in- fluenza strain information. REFERENCES 1. Dawood FS, Jain S, Finelli L, et al. Emergence of a novel swine-origin influenza A (H1N1) virus in humans. N Engl J Med. 2009;360:2605–2615. 2. BOE. Pandemic A (H1N1) update. Thailand Bureau of Epidemiology. 2009. Cited September 3, 2009. Available at: http://203.157.15.4/Flu/ situation/y52/flu_200908310921.pdf. 3. Hurt AC, Alexander R, Hibbert J, et al. Performance of six influenza rapid tests in detecting human influenza in clinical specimens. J Clin Virol. 2007;39:132–135. 4. Abdel-Ghafar AN, Chotpitayasunondh T, Gao Z, et al. Update on avian influenza A (H5N1) virus infection in humans. N Engl J Med. 2008;358: 261–273. 5. Fedorko DP, Nelson NA, McAuliffe J, et al. Performance of rapid tests for detection of avian influenza A virus types H5N1 and H9N2. J Clin Microbiol. 2006;44:1596–1597. 6. Cheng CK, Cowling BJ, Chan KH, et al. Factors affecting QuickVue Influenza AϩB rapid test performance in the community setting. Diagn Microbiol Infect Dis. 2009;65:35–41. 7. Faix DJ, Sherman SS, Waterman SH. Rapid-test sensitivity for novel swine- origin influenza A (H1N1) virus in humans. N Engl J Med. 2009;361:728–729. 8. Vasoo S, Stevens J, Singh K. Rapid antigen tests for diagnosis of pandemic (Swine) influenza A/H1N1. Clin Infect Dis. 2009;49:1090–1093. 9. Drexler JF, Helmer A, Kirberg H, et al. Poor clinical sensitivity of rapid antigen test for influenza A pandemic (H1N1) 2009 virus. Emerg Infect Dis. 2009;15:1662–1664. 10. Steininger C, Kundli M, Aberle SW, et al. Effectiveness of reverse tran- scription-PCR, virus isolation, and enzyme-linked immunosorbent assay for diagnosis of influenza A virus infection in different age groups. J Clin Microbiol. 2002;40:2051–2056. TABLE 1. Sensitivity and Specificity of the QuickVue AϩB Rapid Test Compared to RTPCR Test Age Category* All 0–2 (n ϭ 150) 3–6 (n ϭ 128) 7–14 (n ϭ 100) PCRϩ 30 55 57 142 QVϩ 23 29 37 89 QVϪ 7 26 20 53 Sensitivity (95% CI) 76.7 (61.5–91.8) 52.7 (39.5–65.9) 64.9 (52.5–77.3) 62.7 (54.7–70.6) PCRϪ 120 73 43 237 QVϩ 2 0 0 2 QVϪ 118 73 43 235 Specificity (95% CI) 98.3 (96.0–100) 100 100 99.2 (98.0–100) *Age missing for one child in PCRϪ group. The Pediatric Infectious Disease Journal • Volume 29, Number 4, April 2010 Rapid Influenza Test © 2010 Lippincott Williams & Wilkins www.pidj.com | 367
  • 5. SHOULD HIGHER VANCOMYCIN TROUGH LEVELS BE TARGETED FOR INVASIVE COMMUNITY-ACQUIRED METHICILLIN-RESISTANT STAPHYLOCOCCUS AUREUS INFECTIONS IN CHILDREN? Natalia Jimenez-Truque, MQC, MSCI, Isaac Thomsen, MD, Elizabeth Saye, BS, and C. Buddy Creech, MD, MPH Abstract: Methicillin-resistant Staphylococcus aureus isolates with van- comycin minimal inhibitory concentrations (MICs) Ն1.5 ␮g/mL have been associated with poorer clinical outcomes and treatment failures in adults. We evaluated vancomycin MICs in 71 invasive pediatric community- acquired MRSA isolates from 2004 to 2008, using the E-test micromethod and the E-test macro-method. The modal MIC by micromethod was 1.5 ␮g/mL, and median vancomycin MICs did not increase over time. Key Words: MRSA, vancomycin, methicillin resistance, Staphylococcus aureus, pediatric, invasive Accepted for publication October 8, 2009. From the Department of Pediatric Infectious Diseases, Vanderbilt Univer- sity Medical Center, Nashville, TN. Supported, in part, by Vanderbilt CTSA grant 1 UL1 RR024975 from NCRR/NIH and Fogarty International Center grant 1 R25 TW007697. Address for correspondence: C. Buddy Creech, MD, MPH, 1161 21st Ave South, CCC-5311 Medical Center North, Nashville, TN 37232. E-mail: buddy.creech@vanderbilt.edu. DOI: 10.1097/INF.0b013e3181c52a04 Since the emergence of methicillin-resistant S. aureus (MRSA), vancomycin has been a key antimicrobial agent for the treat- ment of MRSA infections.1,2 Concerns surrounding the long-term use of vancomycin as a primary therapy were confirmed when the first vancomycin–intermediate S. aureus (VISA) isolate was diag- nosed in Japan in 1996.3 Recently, it was shown in adult patients that strains with minimal inhibitory concentrations (MICs) Ն1.5 ␮g/mL, though not above the susceptibility breakpoint of 2 ␮g/ mL, were associated with clinical failure.4,5 This increase in vancomycin MICs over time is defined as MIC creep.6 – 8 Because of MIC creep, tissue penetration of vancomycin, and other factors, the vancomycin MIC breakpoints were lowered in 2006. According to these breakpoints, an isolate with an MIC of Յ2 ␮g/mL is considered susceptible to vancomycin, an isolate with intermediate resistance has an MIC of 4 to 8 ␮g/mL, and an isolate with an MIC Ն16 ␮g/mL is resistant. Some bacterial colonies within the staphylococcal population, on exposure to vancomycin, develop an intermediately resistant phenotype known as heterogeneous-vancomycin intermediate S. aureus (hVISA), a phenotype that may be responsible for treatment failures despite overall vancomycin susceptibility.2,6 Most data regarding MIC creep has been collected from adult isolates. It is unclear whether this phenomenon occurs in MRSA isolates from pediatric patients, specifically those classified as community-associated MRSA (CA-MRSA). CA-MRSA iso- lates would be expected to have lower vancomycin MICs when compared with hospital-associated MRSA isolates due to the lack of selective vancomycin pressure in the community. We hypoth- esized that vancomycin MICs have not changed significantly over time in the pediatric population, because risk factors such as frequent vancomycin exposure and foreign bodies such as cathe- ters or prosthetic joints are not likely to be present in children with CA-MRSA disease. To evaluate this, we studied the vancomycin MICs for pediatric CA-MRSA isolates from 2004 to 2008 based on site of infection. MATERIALS AND METHODS S. aureus Clinical Isolates. Since 2004, all pediatric CA-MRSA isolates at Vanderbilt Children’s Hospital have been archived. Each isolate represents a unique pediatric patient. Isolates are considered to be CA-MRSA based on application of Centers for Disease Control-criteria.9 For this study, we analyzed vancomycin MICs for 71 previously characterized invasive pediatric CA- MRSA isolates collected from 2004 to 2008 that were viable in culture and in which site of infection and date were known. These 71 invasive CA-MRSA isolates were randomly selected from a de-identified pediatric clinical isolate database of 1376 unique isolates, using a random number generator. In 706 isolates, unam- biguous notation of site of infection was available; from these, 80 were from patients with invasive MRSA disease, and 71 were viable in culture and had molecular features characteristic of CA-MRSA. Isolates were initially classified as MRSA by the clinical laboratory of Vanderbilt Children’s Hospital and subsequently confirmed by our laboratory based on growth on mannitol salt agar plates containing oxacillin and a positive latex agglutination test for clumping factor (Staphaurex, Remel). DNA was extracted and purified and was used as template for polymerase chain reaction (PCR) detection of nuc and mecA genes and for staphylococcal cassette chromosome mec (SCCmec) typing, as described else- where.10 Genotyping of isolates was performed by pulse-field gel electrophoresis and/or repetitive element sequence based PCR.11 E-Test Micro- and Macro-Methods. S. aureus strain ATCC 29213 was used as the reference strain for both E-test methods (AB- Biodisk, Solna, Sweden), which were performed according to the manufacturer’s guidelines. For the micromethod, a 0.5 McFarland standard was prepared in sterile saline, inoculated onto Mueller- Hinton agar, and incubated for 24 hours at 35°C. For the macro- method, a 2 McFarland standard was inoculated onto brain-heart infusion agar and incubated for 48 hours at 35°C. Testing of the clinical isolates was done in a single laboratory, and the results were recorded by a single observer. S. aureus isolates with van- comycin MICs by micromethod of Յ2 ␮g/mL were considered susceptible (VSSA) based on Clinical and Laboratory Standards Institute guidelines. Intermediate susceptibility to vancomycin (VISA) was defined by MICs of 4 to 8 ␮g/mL, and vancomycin resistance (VRSA) by MICs of Ն16 ␮g/mL. Analysis of MICs over time and by site of infection was performed using the Kruskal-Wallis H method. A P value of 0.05 was considered statistically significant. All analyses were per- formed with SPSS Version 16.0. RESULTS To confirm that each of the 71 isolates clinically determined to be community-associated were also genotypically consistent with CA-MRSA, we performed SCCmec typing and genotyping by pulsed-field gel electrophoresis or rep-PCR. All of the isolates had SCCmec IV cassette and belonged to USA300, the current epi- demic clone in the United States. Of the 71 invasive isolates, 47 (66.2%) were from joint infections (Table 1). Overall, the modal MIC by micromethod was 1.5 ␮g/mL. Fifty-six isolates had an MIC Ն1.5 ␮g/mL. Three isolates had an MIC of 2 ␮g/mL, but are considered susceptible by Clinical and Laboratory Standards Institute breakpoints. Only 15 iso- lates had an MIC Ͻ1.5 ␮g/mL. Median and mean vancomycin MICs did not increase over time (P ϭ 0.245, Inter-Quartile Range [IQR] 1.5–1.5 ␮g/mL). Similarly, MIC values were not significantly different across different infection sites (P ϭ 0.952, IQR ϭ 1.5–1.5 ␮g/mL). Jimenez-Truque et al The Pediatric Infectious Disease Journal • Volume 29, Number 4, April 2010 © 2010 Lippincott Williams & Wilkins368 | www.pidj.com
  • 6. By the macro-method, 2 isolates (1 from 2005, 1 from 2004) had vancomycin concentrations of 8 and 12 ␮g/ml, respectively. These isolates were susceptible by the micromethod, a character- istic consistent with hVISA. By the macromethod, changes in vancomycin concentrations over time in both the mean and the median were not different (P ϭ 0.052, IQR ϭ 3 to 4 ␮g/mL), nor were the differences by infection sites (P ϭ 0.085, IQR ϭ 3–4 ␮g/mL). DISCUSSION The modal vancomycin MIC of 1.5 ␮g/mL in our isolates is higher than the previously reported modal MIC of 1.0 ␮g/mL for S. aureus.2 This has clinical importance if treatment with vanco- mycin is considered, since MRSA isolates with vancomycin MICs Ն1.5 ␮g/mL have been associated with poorer clinical outcomes and vancomycin treatment failures in adults, despite the fact that they are lower than the vancomycin susceptibility breakpoint.4,5 Though vancomycin is the mainstay of treatment for most children with invasive CA-MRSA infections, the pharmacologic properties of the drug, such as poor penetration into lung and bone12 and potential for nephrotoxicity,12 are challenging. For this reason, many choose clindamycin for first-line therapy for uncom- plicated osteoarticular disease, given the likelihood of susceptibil- ity and excellent bioavailability. However, for bacteremia or com- plicated osteoarticular disease, vancomycin is still recommended by most, and clinicians typically use plasma trough values to evaluate safety and therapeutic window. At our institution, target trough values are set between 5 and 12 ␮g/mL; however, in recent years, many clinicians have pushed the troughs to 10 to 15 ␮g/mL, particularly for osteoarticular disease or pulmonary disease where vancomycin concentrations are only 10% to 15% of plasma.12 In this study, we demonstrated that 56 of 71 isolates had MIC values Ն1.5 ␮g/mL. For patients with bone or joint infections caused by strains with vancomycin MICs of 1.5 ␮g/mL, troughs of no less than 10 ␮g/mL are likely needed for the drug to be fully effective. We did not see a creep in MICs of vancomycin during the period studied. These findings agree with some authors who have reported steady vancomycin MICs over time,2,8 but disagree with others, who have reported the existence of a vancomycin “MIC creep.”6,7 Most of this work has been done in hospital-associated MRSA; therefore, the same selective pressures generating MIC creep are likely not present in this cohort of patients with CA- MRSA. Additionally, by the macromethod, 2 isolates with vanco- mycin concentrations of 8 and 12 ␮g/mL, respectively, are con- sidered to be hVISA. Currently, the E-test macromethod is considered the most sensitive screening method for detecting hVISA.13 Although they represent a low percentage, they might be clinically significant, especially since there are no previous studies that address hVISA in a pediatric population. The 2 hVISA isolates were from years 2004 to 2005, implying that this is not a growing phenomenon in this collection of isolates. One limitation of this study is that the sample size depended on all the available and viable pediatric invasive CA-MRSA isolates at our institution. However, there were no systematic biases towards CA-MRSA isolates with higher vancomycin MICs because until 2009 very few CA-MRSA had formal MIC testing. Another limitation is that we were unable to assess the association between vancomycin MIC and clinical outcomes, since clinical information was unavailable for the patients—a prospective study would be the most definitive way to determine this relation. Last, since many clinical laboratories use the E-test because of its cost-effectiveness, we chose to use this method for MIC determi- nation. While this method can overestimate the MIC when com- pared with broth microdilution,14 the MIC by E-test may be more reliable in predicting vancomycin treatment outcomes.15,16 Clinicians should recognize that MRSA isolates, including those that are epidemiologically and genotypically CA-MRSA, may have higher vancomycin MICs than expected, and that this might complicate response to treatment. We recommend that all pediatric patients treated with vancomycin for invasive CA- MRSA disease, particularly those with osteoarticular disease or pneumonia, have formal MIC testing of their staphylococcal isolate (micromethod) to guide serum vancomycin target trough concentrations. REFERENCES 1. Smith TL, Pearson ML, Wilcox KR, et al. Emergence of vancomycin resistance in Staphylococcus aureus. N Engl J Med. 1999;340:493–501. 2. Jones RN. Microbiological features of vancomycin in the 21st century: minimum inhibitory concentration creep, bactericidal/static activity, and TABLE 1. Median, Mean, Mode, and Range for Vancomycin MICs According to Year and Site of Infection by E-Test Micro- and Macro-Methods N (%) Micro-Method (␮g/mL) Range Macro-Method (␮g/mL) RangeMedian (IQR) Mean (95% CI) Mode Median (IQR) Mean (95% CI) Mode Year P ϭ 0.245* P ϭ 0.052* 2004 12 (16.9) 1.5 (1.5–1.5) 1.5 (1.4–1.6) 1.5 1.5–2 5.0 (4–6) 5.3 (3.8–6.9) 6.0 3–12 2005 22 (31.0) 1.5 (1.5–1.5) 1.3 (1.2–1.5) 1.5 1–1.5 4.0 (4–4) 3.9 (3.3–4.4) 4.0 3–8 2006 12 (16.9) 1.5 (1–1.5) 1.4 (1.2–1.5) 1.5 1–1.5 3.5 (3–4) 3.5 (3.2–3.8) 3.0 3–4 2007 15 (21.1) 1.5 (1.5–1.5) 1.4 (1.3–1.5) 1.5 1–1.5 4.0 (3–4) 3.9 (3.4–4.5) 4.0 3–6 2008 10 (14.1) 1.5 (1.5–1.5) 1.5 (1.3–1.7) 1.5 1–1.5 4.0 (3–4) 3.6 (3.2–4.0) 4.0 3–4 Site of infection P ϭ 0.952* P ϭ 0.085* Bone 7 (9.9) 1.5 (1–1.5) 1.4 (1.1–1.6) 1.5 1–1.5 3.0 (3–6) 4.0 (2.7–5.3) 3.0 3–6 Blood 6 (8.5) 1.5 (1.5–1.5) 1.5 (1.5–1.5) 1.5 1.5–1.5 4.0 (3.8–6.5) 4.8 (2.9–6.8) 4.0 3–8 Joint 47 (66.2) 1.5 (1.5–1.5) 1.4 (1.3–1.5) 1.5 1–2 4.0 (3–4) 3.7 (3.5–3.9) 4.0 3–6 CSF 1 (1.4) 1.5 (1.5–1.5) 1.5 (NA) 1.5 1.5–1.5 4.0 (4–4) 4.0 (NA) 4.0 4–4 Pleural fluid 6 (8.5) 1.5 (1–1.6) 1.4 (1–1.8) 1.5 1–2 5.0 (3.8–7.5) 5.8 (2.4–9.2) 4.0 3–12 Pericardial fluid 2 (2.8) 1.5 (1.5–1.5) 1.5 (1.5–1.5) 1.5 1.5–1.5 3.0 (3–3) 3.0 (3–3) 3.0 3–3 Visceral abscess 1 (1.4) 1.5 (1.5–1.5) 1.5 (NA) 1.5 1.5–1.5 4.0 (4–4) 4.0 (NA) 4.0 4–4 Deep tissue abscess 1 (1.4) 1.5 (1.5–1.5) 1.5 (NA) 1.5 1.5–1.5 6.0 (6–6) 6.0 (NA) 6.0 6–6 Total 71 (100) 1.5 (1.5–1.5) 1.4 (1.4–1.5) 1.5 1–2 4.0 (3–4) 4.0 (3.7–4.4) 4.0 3–12 IQR indicates Inter-Quartile Range; 95% CI, 95% Confidence Interval. *Kruskal-Wallis H method. The Pediatric Infectious Disease Journal • Volume 29, Number 4, April 2010 Vancomycin in CA-MRSA © 2010 Lippincott Williams & Wilkins www.pidj.com | 369
  • 7. applied breakpoints to predict clinical outcomes or detect resistant strains. Clin Infect Dis. 2006;42:S13–S24. 3. Hiramatsu K, Hanaki H, Ino T, et al. Methicillin-resistant Staphylococcus aureus clinical strain with reduced vancomycin susceptibility. J Antimicrob Chemother. 1997;40:135–136. 4. Sakoulas G, Moise-Broder PA, Schentag J, et al. Relationship of MIC and bactericidal activity to efficacy of vancomycin for treatment of methicillin- resistant Staphylococcus aureus bacteremia. J Clin Microbiol. 2004;42: 2398–2402. 5. Lodise TP, Graves J, Evans A, et al. Relationship between vancomycin MIC and failure among patients with methicillin-resistant Staphylococcus aureus bacteremia treated with vancomycin. Antimicrob Agents Chemother. 2008;52:3315–3320. 6. Wang G, Hindler JF, Ward KW, et al. Increased vancomycin MICs for Staphylococcus aureus clinical isolates from a university hospital during a 5-year period. J Clin Microbiol. 2006;44:3883–3886. 7. Steinkraus G, White R, Friedrich L. Vancomycin MIC creep in non- vancomycin-intermediate Staphylococcus aureus (VISA), vancomycin-sus- ceptible clinical methicillin-resistant S. aureus (MRSA) blood isolates from 2001–05. J Antimicrob Chemother. 2007;60:788–794. 8. Alo´s JI, García-Can˜as A, García-Hierro P, et al. Vancomycin MICs did not creep in Staphylococcus aureus isolates from 2002 to 2006 in a setting with low vancomycin usage. J Antimicrob Chemother. 2008;62:773–775. 9. CDC. Community-Associated MRSA Information for Clinicians. Available at: http://www.cdc.gov/ncidod/dhqp/ar_mrsa_ca_clinicians.html#. Accessed 2005. 10. Oliveira DC, de Lencastre H. Multiplex PCR strategy for rapid identifica- tion of structural types and variants of the mec element in methicillin- resistant Staphylococcus aureus. Antimicrob Agents Chemother. 2002;46: 2155–2161. 11. McDougal LK, Steward CD, Killgore GE, et al. Pulsed-field gel electro- phoresis typing of oxacillin-resistant Staphylococcus aureus isolates from the United States: establishing a national database. J Clin Microbiol. 2003;41:5113–5120. 12. Kollef MH. Limitations of vancomycin in the management of resistant staphylococcal infections. Clin Infect Dis. 2007;45:S191–S195. 13. Wootton M, MacGowan AP, Walsh TR, et al. A multicenter study evalu- ating the current strategies for isolating Staphylococcus aureus strains with reduced susceptibility to glycopeptides. J Clin Microbiol. 2007;45:329– 332. 14. Tenover FC, Lancaster MV, Hill BC, et al. Characterization of Staphylo- cocci with reduced susceptibilities to vancomycin and other glycopeptides. J Clin Microbiol. 1998;36:1020–1027. 15. Hsu DI, Hidayat LK, Quist R, et al. Comparison of method-specific vancomycin minimum inhibitory concentration values and their predictabil- ity for treatment outcome of meticillin-resistant Staphylococcus aureus (MRSA) infections. Int J Antimicrob Agents. 2008;32:378–385. 16. Sader HS, Rhomberg PR, Jones RN. Nine-hospital study comparing broth microdilution and Etest method results for vancomycin and daptomycin against methicillin-resistant Staphylococcus aureus. Antimicrob Agents Chemother. 2009;53:3162–3165. SURVEILLANCE OF TRANSMITTED RESISTANCE TO ANTIRETROVIRAL DRUG CLASSES AMONG YOUNG CHILDREN IN THE WESTERN CAPE PROVINCE OF SOUTH AFRICA Gert U. van Zyl, MD,* Mark F. Cotton, MD, PhD,† Mathilda Claassen, BSc(Hons),* Charmaine Abrahams, RN,* and Wolfgang Preiser, MD, PhD* Abstract: There are limited data on transmitted antiretroviral resistance in young children who require antiretroviral therapy. We adapted the World Health Organization surveillance strategy, testing antiretroviral naive in- fants (Ͻ18 months) in the Western Cape Province of South Africa, and detecting only 3 non-nucleoside reverse transcriptase inhibitors (NNRTI) and no NRTI or protease inhibitor surveillance mutations in 49 patients. The estimated NRTI and protease inhibitor transmitted antiretroviral resis- tance prevalence is low (Ͻ5%), predicting good therapeutic response in Western Cape infants. Key Words: transmitted antiretroviral drug resistance, surveillance, children, South Africa Accepted for publication October 7, 2009. From the *Division of Medical Virology, Stellenbosch University, Tygerberg, South Africa; and †Department of Paediatrics and Child Health, Children’s Infectious Diseases Clinical Research Unit, Tygerberg Children’s Hospital, Stellenbosch University, Tygerberg, South Africa. Supported by the South African Department of Health, CCMT program. Address for correspondence: Gert U. van Zyl, MD, Division of Medical Virology, Stellenbosch University, Tygerberg Campus, P.O. Box 19063, Tygerberg 7505, South Africa. E-mail: guvz@sun.ac.za. DOI: 10.1097/INF.0b013e3181c4dada Transmitted antiretroviral drug resistance (TDR) refers to the situation when patients are newly infected with antiretroviral resistant HIV strains. In industrialized countries, such as Europe and North America, with about 15 years history of antiretroviral therapy (ART), 5% to 25% of newly HIV-infected individuals are infected with a strain with some degree of antiretroviral drug resistance.1,2 Likewise in developing countries with high levels of antiretroviral exposure, such as Brazil and Argentina, TDR prev- alence of respectively 4% and 7.7% was found.3,4 Transmitted drug resistance testing should ideally be done during the early stages of infection before resistant viruses can revert to wild-type. Since the presence of TDR may compromise the success of ART and therapy roll-out programs, surveillance for prevalence of TDR in populations, where there is increasing ART-usage, is necessary. The World Health Organization (WHO) proposed surveil- lance guidelines using binomial sequential sampling for TDR (threshold surveillance). At most 47 recently infected patients are sequentially tested, allowing prevalence to be classified as either Ͻ5%, between 5% and 15%, or Ͼ15%.5 To gain uniformity and to exclude polymorphic mutations, the list of surveillance drug resis- tance mutations (SDRM) has recently been updated.6 Since ART is rapidly being scaled-up in the Western Cape Province of South Africa, surveillance is needed to detect any increase in TDR. The WHO surveillance strategy targets recently infected adults, but adult surveillance may not accurately predict TDR prevalence in infants, especially where antiretroviral drugs are used for prevention of HIV mother-to-child transmission (PMTCT). The timing of infection is also easier to ascertain in infants than in adults. Transmitted drug resistance data for infants are limited, and for developing countries the data come from PMTCT cohort studies, where high rates of nevirapine (NVP) resistance in infants have been detected.7,8 There are very few infant TDR data from a typical population of children needing ART. In industrialized countries, the TDR prevalence in infants may be high as demonstrated in the United States by Persaud et al who found 5 of 21 (23.8%) infants to have transmitted resistance.9 Recent evidence supports early ART of infants,10 shortly after transmission when TDR may be more significant. Monitoring in young children could provide valuable information for the South African ART roll-out program and enable the selection of optimal regimens. MATERIALS AND METHODS The study formed part of a South African Department of Health funded antiretroviral resistance study that was approved by the Stellenbosch University Committee for Human Research. We adapted the WHO TDR surveillance method to test children, using age, less than 18 months, as indicative of early infection (for adults the cut-off is 3-years after diagnosis, whereas no standard for children has been formulated), applying the same binomial sam- pling method as is recommended for adults. This method is based on lot quality assurance methods. The method does not attempt to van Zyl et al The Pediatric Infectious Disease Journal • Volume 29, Number 4, April 2010 © 2010 Lippincott Williams & Wilkins370 | www.pidj.com
  • 8. estimate the exact prevalence but to reliably categorize it: to classify prevalence as either Ͻ5%, between 5% and 15%, or Ͼ15% a sequential sample of at most 47 is needed.5 Genotypic antiretroviral drug resistance testing does not form part of routine management, but patients who were consecutively referred from the Cape Town Metropolitan region were enrolled for baseline genotypic antiretroviral drug resistance testing before initiation of ART from March 2007 to September 2009. About 49 children, from 1 to 17 (median, 3.7) months-of-age, were included, of whom 35 had documented evidence of being exposed to the Western Cape PMTCT- regimen, 6 had no record and 8 did not receive PMTCT. The Western Cape regimen consists of azidothymidine (AZT) from 28 weeks gestation to the mother with additional NVP intrapartum. The baby receives NVP within 72 hours of birth and 7 days of AZT (or 28 days if mothers had less than 4 weeks of AZT). Since there was limited patient information available, we could not access how many patients were fully compliant with the regimen. Antiretroviral resistance testing was done using an accred- ited in-house genotypic sequencing assay. Sequences were inter- preted using the updated WHO Surveillance drug resistance mu- tation list.6 RESULTS Testing yielded 48 reverse transcription and 49 protease sequences. Of these, none had any nucleoside reverse transcriptase inhibitor (NRTI)- or protease inhibitor (PI)- and 3 had non- nucleoside reverse transcriptase inhibitor (NNRTI) SDRM. These 3 patients had received NVP as part of PMTCT. Using the WHO binomial testing model, this survey predicts a low (Ͻ5%) preva- lence of TDR to NRTIs and PIs and, since 3 of the first 47 patients tested had NNRTI resistance, the prevalence of NNRTI resistance can be classified as intermediate: 5% to 15%. DISCUSSION We found a low prevalence (Ͻ5%) of resistance to NRTIs and PIs in antiretroviral naive children whereas 3 out of 48 patients, all of whom had received NVP as part of PMTCT, had NNRTI SDRM. In view of the high NVP exposure through PMTCT regimens, South African children less than 3-years-of-age receive a regimen consisting of NRTIs and a PI. Therefore, we were primarily interested in detecting any transmitted NRTI and PI resistance, while we expected substantial NNRTI resistance. Polymerase chain reaction followed by bulk sequencing is the current standard for TDR surveillance. However, allele-spe- cific assays were shown to detect a higher prevalence of NNRTI mutations in NVP PMTC exposed patients in some studies,11 but not in others.12 Nevertheless, we may have underestimated NNRTI resistance since most NNRTI resistance in these children would be PMTCT-induced, rather than transmitted and competing popula- tions of wild-type virus may more rapidly displace drug-induced mutants, than in the case of transmission of a single resistant strain, where there is lack of competition with wild-type. Bulk sequencing may also underestimate the prevalence of certain transmitted mutations such as M184V due to its effect on viral fitness13 which, although not detected, may result in early virological failure after commencement of therapy.14 The use of these new allele-specific assays has, as yet, not been fully validated in TDR surveillance but we plan to employ them in future studies. The rapid scale-up of ART in South Africa warrants sur- veillance of patient groups in which one can expect to see an increase in the prevalence of transmitted resistance. In the Western Cape Province, especially in urban areas, ART coverage is already high. Using projections from the Actuarial Society of South Africa15 and provincial data (personal communication), the esti- mated ART coverage in April 2009 was 79% for adults and 89% for children; thus, PMTCT coverage is almost universal.16 Some TDR surveillance data for adults exist for sub-Saharan Africa, but worldwide there are few data for children. The choice of ART regimens recommended for children should be carefully consid- ered, especially since therapy needs to be initiated early, and therapy options should be retained to ensure life-long treatment. Based on these data one can expect a good response to the current first-line regimen used in South African children less than 3-years- of-age, which includes NRTIs and a boosted PI. Further TDR surveillance in children, especially in areas such as the Western Cape with high ART and PMTCT coverage, should be a priority and such surveillance should be repeated regularly to detect any increase in prevalence that may compromise antiretroviral regimens. REFERENCES 1. Pillay D. Current patterns in the epidemiology of primary HIV drug resistance in North America and Europe. Antivir Ther. 2004;9:695–702. 2. Chaix ML, Descamps D, Wirden M, et al. Stable frequency of HIV-1 transmitted drug resistance in patients at the time of primary infection over 1996–2006 in France. AIDS. 2009;23:717–724. 3. Petroni A, Deluchi G, Pryluka D, et al. Update on primary HIV-1 resistance in Argentina: emergence of mutations conferring high-level resistance to nonnucleoside reverse transcriptase inhibitors in drug-naive patients. J Acquir Immune Defic Syndr. 2006;42:506–510. 4. Rodrigues R, Scherer LC, Oliveira CM, et al. Low prevalence of primary antiretroviral resistance mutations and predominance of HIV-1 clade C at polymerase gene in newly diagnosed individuals from south Brazil. Virus Res. 2006;116:201–207. 5. Myatt M, Bennett DE. A novel sequential sampling technique for the surveillance of transmitted HIV drug resistance by cross-sectional survey for use in low resource settings. Antivir Ther. 2008;13(suppl 2):37–48. 6. Bennett DE, Camacho RJ, Otelea D, et al. Drug resistance mutations for surveillance of transmitted HIV-1 drug-resistance: 2009 update. PLoS ONE. 2009;4:e4724. 7. Church JD, Mwatha A, Bagenda D, et al. In utero HIV infection is associated with an increased risk of nevirapine resistance in Ugandan infants who were exposed to perinatal single dose nevirapine. AIDS Res Hum Retroviruses. 2009;25:673–677. 8. Arrive E, Newell ML, Ekouevi DK, et al. Prevalence of resistance to nevirapine in mothers and children after single-dose exposure to prevent vertical transmission of HIV-1: a meta-analysis. Int J Epidemiol. 2007;36: 1009–1021. 9. Persaud D, Palumbo P, Ziemniak C, et al. Early archiving and predomi- nance of nonnucleoside reverse transcriptase inhibitor-resistant HIV-1 among recently infected infants born in the United States. J Infect Dis. 2007;195:1402–1410. 10. Violari A, Cotton MF, Gibb DM, et al. Early antiretroviral therapy and mortality among HIV-infected infants. N Engl J Med. 2008;359:2233– 2244. 11. Hauser A, Mugenyi K, Kabasinguzi R, et al. Detection and quantification of minor human immunodeficiency virus type 1 variants harboring K103N and Y181C resistance mutations in subtype A and D isolates by allele-specific real-time PCR. Antimicrob Agents Chemother. 2009;53:2965–2973. 12. Church JD, Huang W, Parkin N, et al. Comparison of laboratory methods for analysis of non-nucleoside reverse transcriptase inhibitor resistance in Ugandan infants. AIDS Res Hum Retroviruses. 2009;25:657–663. 13. Toni TA, Asahchop EL, Moisi D, et al. Detection of human immunodefi- ciency virus (HIV) type 1 M184V and K103N minority variants in patients with primary HIV infection. Antimicrob Agents Chemother. 2009;53:1670– 1672. 14. Metzner KJ, Giulieri SG, Knoepfel SA, et al. Minority quasispecies of drug-resistant HIV-1 that lead to early therapy failure in treatment-naive and -adherent patients. Clin Infect Dis. 2009;48:239–247. 15. Dorrington R. Western Cape HIV ASSA projection output. 2005. Available at: http://www.capegateway.gov.za/eng/pubs/reports_research/W/142134. Accessed June 23, 2009. 16. Eley B. Addressing the paediatric HIV epidemic: a perspective from the Western Cape Region of South Africa. Trans R Soc Trop Med Hyg. 2006;100:19–23. The Pediatric Infectious Disease Journal • Volume 29, Number 4, April 2010 Antiretroviral Resistance © 2010 Lippincott Williams & Wilkins www.pidj.com | 371
  • 9. MULTIMETHOD ADHERENCE ASSESSMENT IN CHILDREN WITH PERINATALLY ACQUIRED HIV-1 THE INFLUENCE OF OFF-SCHEDULE DOSING IN PREDICTING BIOLOGICAL MARKERS Patricia A. Garvie, PhD,*† Megan L. Wilkins, PhD,* Elizabeth D. Kolivas, BA,* and J. Christopher Young, MA* Abstract: To improve upon adherence assessment in children with HIV, multimethod adherence strategies (pill count, missed doses, off-schedule dosing) were conducted concurrent with viral load and CD4% biomarker assays. Off-schedule dosing predicted both health status markers, while the more common strategies did not. Findings support inclusion of off- schedule dosing concurrent with collection of biomarkers to assess adher- ence in children with HIV. Key Words: adherence assessment, off-schedule dosing, pediatric HIV, youth, ARV Accepted for publication October 16, 2009. From the *Department of Behavioral Medicine, St. Jude Children’s Research Hospital, Memphis, TN; and †Department of Pediatrics, University of Tennessee Health Science Center, Memphis, TN. Supported by the American Lebanese Syrian Associated Charities. The funding source had no role or input in the design or conduct of the study; collection, management, analysis, or interpretation of the data; or preparation, review, or approval of the manuscript. The authors have no conflicts of interest or financial disclosures to make. Address for correspondence: Patricia A. Garvie, PhD, St. Jude Children’s Research Hospital, 262 Danny Thomas Place, MS 740, Memphis, TN 38105. E-mail: patti.garvie@stjude.org. DOI: 10.1097/INF.0b013e3181c67686 Medication adherence and accurate adherence assessment in children with HIV are vital to effective treatment. Nonad- herence to antiretroviral (ARV) medications allows viral replica- tion and mutation that can lead to treatment resistance and more complicated medication regimens.1 No single best adherence as- sessment strategy exists for children with HIV. Utilizing multi- method assessment strategies may better capture adherence behav- iors and address limitations associated with any single measure. While pill counts yield significant associations with viral load (VL),2– 6 clinical utility is limited by significant staff time demands, cost constraints, and potential social desirability (eg, “pill dumping”).7 Retrospective recall is the most commonly used adherence assessment strategy because of ease of administration, cost effectiveness, and clinical utility.7 Recall methods typically rely on caregiver report of how many doses were missed within a specified period. Methodologic limitations, including socially de- sirable responding, difficulty recalling everyday events, and lack of continuous assessment may account for inconsistent findings with VL2,3 and may result in adherence overestimations than object- ive methods.7 Recent pediatric studies failed to find a relationship between caregivers’ 3-day recall of missed doses and child VL2 while others reported significant findings with VL.3 Inconsistent reports necessitate further investigation into the accuracy and efficacy of adherence recall methods for children with HIV. Dose timing is an essential aspect of adherence due to risk of developing medication resistance associated with temporal dosing inconsistency.1 To better evaluate relationships among adherence with VL and CD4 biomarkers, off-schedule dosing should be assessed. True adherence may be overestimated when doses are not missed, but still not taken as prescribed.4,8 This study contributes to better understanding the impact of off-schedule dosing on child health outcomes. Treatment efficacy and disease progression are monitored routinely via CD4 and VL biomarker assays. Within the pediatric HIV adherence literature, investigations frequently only reported VL.2,4,6,8,9 Given the contribution of each biomarker to under- standing disease progression and treatment response, concurrent CD4 and VL monitoring is warranted. Reported relationships among CD4 and adherence in children with HIV have been mixed,3,5,10 and comparison of findings is complicated by whether CD4 count, CD4%, or both were monitored. Biomarkers typically have not been monitored concurrently with adherence, often collected within 90 days of adherence assess- ment.2,6 Studies utilizing concurrent assessment reliably detect sig- nificant VL-adherence relationships.3,4,9,10 Concurrent CD4-adher- ence assessments are limited and findings are mixed.3,5,10 To improve on prior methodology, the present study col- lected VL and CD4% biomarkers concurrent with multimethod adherence assessment strategies. Off-schedule dosing was mea- sured to investigate the role of inconsistent interval dosing on child VL and CD4%. Hypotheses: (1) pharmacy pill count would predict both child VL and CD4%; and (2) caregiver report of 3-day missed and 3-day off-schedule dosing would predict both child increased VL and decreased CD4%. METHOD Participants Sixty caregivers of children with perinatally acquired HIV-1 presenting for routine multidisciplinary pediatric HIV care in the Mid-Southern United States were recruited consecutively. Child demographics: Mean (M) age 8.0 years (SD ϭ 4.26); 53% female; 85% African American, 13% Caucasian; 92% were on a twice daily, 3-drug (75%) or 4-drug regimen (17%). Caregiver demo- graphics: Mean age 39.7 years (SD ϭ 11.6); 93% women; 85% African American, 15% Caucasian; 66.7% biologic parent, 25% other relative, 8% adoptive parent; 55% HIV-positive; 57% un- employed. Data Collection This single-site prospective cross-sectional study was insti- tutional review board-approved. Caregivers provided written con- sent, and completed a study-specific semistructured interview to obtain demographic information and caregiver report of child medication adherence via 3-day retrospective recall of number of child ARV doses missed, and doses taken, but off-schedule (not as prescribed). Additionally, ARV adherence was assessed by phar- macy pill count (percentage of medication returned/total medica- tion dispensed). Child CD4 and VL assays were drawn per routine clinical care on the date of caregiver participation, and pharmacy pill count was obtained. One critical aspect of the 3-day recall methodology imple- mented includes calculations of off-schedule dosing in relation to reported missed doses. Participants were asked at what time(s) the child was required to take ARV medications and which medica- tions were prescribed for each dose time, allowing for the assess- ment of medications prescribed once-daily within a twice-daily regimen. Respondents were asked “how many doses of each ARV medication were missed yesterday morning? And, evening?” “How about the day before that?” “And, the day before that?” Similarly, to assess off-schedule dosing, caregivers were asked, “Over the past 3 days, how many doses of each ARV medication was not taken when it was supposed to be?” beginning with yesterday morning, etc. Caregivers estimated by how much time each off-schedule dose was taken early or late. Doses taken within 1 hour of the expected dose time were considered adherent. Off-schedule Garvie et al The Pediatric Infectious Disease Journal • Volume 29, Number 4, April 2010 © 2010 Lippincott Williams & Wilkins372 | www.pidj.com
  • 10. calculations took into account doses missed, determining the propor- tion of doses actually taken, but not as prescribed. Statistical Analyses Analyses were conducted using SPSS 15.0. Due to signifi- cant skewness, variables were dichotomized based on clinical criteria. Child CD4% was recoded by Center for Disease Control clinical classification of immunosuppression (Ͻ25% vs. Ն25%). VL was dichotomized as undetectable/detectable (Ͻ400 copies/mL vs. Ն400 copies/mL). Caregiver report of missed doses and off- schedule dosing were recoded as nonadherent/adherent (missed vs. none; off-schedule vs. none). Pharmacy pill counts were dichoto- mized (Ͻ93% vs. Ն93%) corresponding with missing Ͼ2 days’ doses within 30 days. Phi coefficient analyses examined relationships among the 3 adherence assessment strategies. Predictive validity of each assessment strategy on child CD4% and VL was analyzed via logistic regression. RESULTS Adherence by pharmacy pill count was M ϭ 91.41% (SD ϭ 9.71), and Ͼ95% for 40% of the sample. Further, 83% of care- givers reported no missed doses for their child over the 3-day recall period; 77% reported no off-schedule doses during the same 3-day period. Caregivers reported ϳ5.7% of doses were missed (Median ͓Mdn͔ ϭ 0, SD ϭ 17.49) and 12% taken off-schedule (Mdn ϭ 0, SD ϭ 26.87); thus, ϳ18% (Mdn ϭ 0, SD ϭ 29.95) of all prescribed doses were either missed or taken off-schedule per 3-day recall. Dichotomously coded adherence variables were evaluated for multicollinearity. Results (Table 1) revealed a significant relationship between adherence assessed by pill count and 3-day recall of doses missed (␾ ϭ Ϫ0.29, P ϭ 0.02). Neither pharmacy pill count (␾ ϭ Ϫ0.05, P ϭ 0.69) nor 3-day recall of doses missed significantly related to doses taken off-schedule (␾ ϭ 0.18, P ϭ 0.17). Univariate logistic regression analyses (Table 2) revealed caregiver 3-day recall of off-schedule doses significantly predicted child CD4% suppression (Wald ␹2 ϭ 4.44, P ϭ 0.04, OR ϭ 4.18; CI0.95 ϭ 1.11–15.79), but caregiver report of missed doses (Wald ␹2 ϭ 0.48, P ϭ 0.49, OR ϭ 1.71; CI0.95 ϭ 0.38–7.84) and pharmacy pill count (Wald ␹2 ϭ 0.40, P ϭ 0.53, OR ϭ 1.53; CI0.95 ϭ 0.41–5.68) did not. Caregiver report of doses taken off-schedule (Table 3) significantly predicted child detectable VL (Wald ␹2 ϭ 3.64, P ϭ 0.06, OR ϭ 3.38; CI0.95 ϭ 0.97–11.78), but doses missed (Wald ␹2 ϭ 0.66, P ϭ 0.42, OR ϭ 0.55; CI0.95 ϭ 0.13–2.36) and pharmacy pill count (Wald ␹2 ϭ 1.67, P ϭ 0.20, OR ϭ 0.50; CI0.95 ϭ 0.17–1.43) did not. DISCUSSION Validating ARV adherence assessment remains of para- mount importance, both in pediatric HIV clinical care and clinical investigation. Nonetheless, a gold standard to assess adherence remains elusive. Study findings emphasize the importance of including off-schedule dosing assessment when evaluating adher- ence. Results also support inclusion of both CD4% and VL biomarkers given independent relationships to self-reported adher- ence. Collecting both indices, rather than VL alone, increased the likelihood of identifying adherence difficulties in children with perinatally acquired HIV and the impact of suboptimal adherence on both immune composition and viral control. The most commonly used assessment strategies, pharmacy pill count and caregiver recall of missed doses, failed to predict child VL or CD4% suppression, despite relatively high adherence rates. Inclusion of off-schedule dosing provided a more refined analysis of overall adherence behaviors. Participants who other- wise appeared adherent by pill count and/or doses missed ac- knowledged difficulty administering medications as prescribed, an extremely important health consideration given risk to develop medication resistance because of temporally inconsistent ARV dosing. Thus, off-schedule dosing assessment may represent a more externally valid and sensitive measure of adherence behav- ior, providing clinical insight beyond other methods. Study findings are tempered by limitations inherent to a relatively small 1-time cross-sectional single-site sample, and utilization of self-report measures and pill counts, which are vulnerable to social desirability demands. Dichotomization of data due to skewness also may limit findings. Limited methodologic and analytical descriptions in prior studies compounded by contradictory results make interpretation, comparison across studies, and replication difficult. Study findings demonstrate concurrent assessment of biomarkers and off-sched- ule dosing more accurately illulminate the influence of nonadher- ence behaviors in children with HIV. Routinely employing these methods may allow earlier detection and intervention to improve dose-timing consistency and prevent viral replication and devel- opment of medication resistance. Methodologic detail regarding how adherence is assessed and analyzed should be included in future reports to encourage replication and permit comparison across studies. Replication with a larger multisite cohort across treatment settings to clarify further the contribution of off-schedule dosing, concurrent collection of biologic assays, and adherence assessment is warranted. ACKNOWLEDGMENTS The authors thank the families living with HIV who partic- ipated and whose contributions provided invaluable information TABLE 1. Phi Coefficient Correlations Between Multiple Measures of Adherence Pill Count Recall Missed Recall Off-Schedule Pharmacy pill count — Ϫ0.29* Ϫ0.05 Recall missed — 0.18 Recall off-schedule — *P ϭ 0.02. TABLE 2. Prediction of CD4 Suppression (CD4% Ͻ25) Wald OR CI0.95 Total recall adherence 5.43* 4.67 1.28–17.28 Recall off-schedule 4.44† 4.18 1.11–15.80 Recall missed doses 0.48 1.71 0.38–7.84 Pharmacy pill count 0.40 1.53 0.41–5.68 *P ϭ 0.02. † P ϭ 0.03. TABLE 3. Prediction of Detectable Viral Load (Ͼ400) Wald OR CI0.95 Total recall adherence 0.85 1.67 0.56–4.93 Recall off-schedule 3.64* 3.38 0.97–11.78 Recall missed doses 0.66 0.55 0.13–2.36 Pharmacy pill count 1.67 0.50 0.17–1.43 *P ϭ 0.06. The Pediatric Infectious Disease Journal • Volume 29, Number 4, April 2010 Off-Schedule Dosing in HIV © 2010 Lippincott Williams & Wilkins www.pidj.com | 373
  • 11. about their experiences with medication adherence for their chil- dren; graduate research assistants who contributed toward data collection and entry, Will Dalton, III, PhD, Rebecca West De- deaux, MS, Ericka Midgett, MS, Christy Jayne Curtis, PhD, and Clinical Research Associates, Jo Lawford, PhD, and Megan Ba- net, MA, who in addition monitored data collection, developed the database, and managed the data. REFERENCES 1. Liu H, Miller LG, Hays RD, et al. Repeated measures longitudinal analyses of HIV virologic response as a function of the percent adherence, dose timing, genotypic sensitivity and other factors. J Acquir Immune Defic Syndr. 2006;41:315–322. 2. Farley J, Hines S, Musk A, et al. Assessment of adherence to antiviral therapy in HIV-infected children using the medication event monitoring system, pharmacy refill, provider assessment, caregiver self-report, and appointment keeping. J Acquir Immune Defic Syndr. 2003;33:211–218. 3. Van Dyke RB, Lee S, Johnson GM, et al. Reported adherence as a determinant of response to highly active antiretroviral therapy in children who have human immunodeficiency virus infection. Pediatrics. 2002;109:e61. 4. Wiener L, Riekert K, Ryder C, et al. Assessing medication adherence in adolescents with HIV when electronic monitoring is not feasible. AIDS Patient Care STDS. 2004;18:527–538. 5. Watson DC, Farley JJ. Efficacy of and adherence to highly active antiret- roviral therapy in children infected with human immunodeficiency virus type 1. Pediatr Infect Dis J. 1999;18:682–689. 6. Marhefka SL, Farley JJ, Rodrigue JR, et al. Clinical assessment of medi- cation adherence among HIV-infected children: examination of the treat- ment interview protocol (TIP). AIDS Care. 2004;16:323–338. 7. Kerr T, Walsh J, Lloyd-Smith E, et al. Measuring adherence to highly active antiretroviral therapy: implications for research and practice. Curr HIV/ AIDS Rep. 2005;2:200–205. 8. Marhefka SL, Tepper VJ, Farley JJ, et al. Brief report: assessing adherence to pediatric antiretroviral regimens using the 24-hour recall interview. J Pediatr Psychol. 2006;31:989–994. 9. Naar-King S, Frey M, Harris M, et al. Measuring adherence to treatment of paediatric HIV/AIDS. AIDS Care. 2005;17:345–349. 10. Martin S, Elliot-DeSorbo DK, Wolters PL, et al. Patient, caregiver, and regimen characteristics associated with adherence to highly active antiret- roviral therapy among HIV-infected children and adolescents. Pediatr Infect Dis J. 2007;6:61–67. POPULATION BASED EXTERNAL VALIDATION OF A EUROPEAN PREDICTIVE MODEL FOR RESPIRATORY SYNCYTIAL VIRUS HOSPITALIZATION OF PREMATURE INFANTS BORN 33 TO 35 WEEKS OF GESTATIONAL AGE Lone G. Stensballe, MD, PhD,* John R. Fullarton, PhD,† Xavier Carbonell-Estrany, MD,‡ and Eric A. F. Simo˜es, MD§ Abstract: Prospectively collected population-based data on 2529 Danish infants born at 33 to 35 weeks of gestation were used to validate an European predictive model of respiratory syncytial virus (RSV) hospital- ization. The model was found to be robust with a diagnostic accuracy of 65.9% to distinguish between RSV-hospitalized versus non-RSV-hospital- ized Danish infants born at 33 to 35 weeks of gestation. Accepted for publication October 27, 2009. From the *Bandim Health Project, Statens Serum Institut, Copenhagen, Denmark; †Strategen Limited, Basingstoke, Hampshire, United Kingdom; ‡Neonatology Service, Hospital Clinic, Institut Clinic de Ginecologia Obstetri- cia I Neonatologia, Agrupacio´ Sanitaria Hospital Clínic-Hospital SJ Deu, Universitat de Barcelona, Barcelona, Spain; and §Department of Pediatrics, Section of Infectious Diseases, The University of Colorado School of Medicine and The Children’s Hospital, Denver, CO. Supported by Abbott Laboratories for work on various projects (to J.R.F.). Also, by the Abbott Laboratories (to L.G.S., E.S., and X.C.E.). The data management for the establishment of the Danish dataset was funded un-restricted by Abbott Laboratories, Denmark. Address for correspondence: Lone G. Stensballe, MD, PhD, Bandim Health Project, Statens Serum Institut, Copenhagen, Denmark. E-mail: lgn@ssi.dk. DOI: 10.1097/INF.0b013e3181c810da Premature infants are at increased risk of hospitalization, with severe respiratory syncytial virus (RSV) airway infection.1 Passive immunoprophylaxis with a humanized monoclonal anti- body, palivizumab, has been shown to reduce the risk of RSV hospitalization in preterm infants.2 However, passive immunopro- phylaxis for all infants born 33 to 35 weeks of gestation (wGA) is not considered cost-effective in most European countries.3 Thus, there is a need, in an evidence-based manner, to identify infants born 33 to 35 wGA with the greatest likelihood of RSV hospital- ization in whom to target immunoprophylaxis. This approach has recently been modeled by Simoes et al4,5 who used data on infants born 33 to 35 wGA from Spain and Germany to define a European RSV hospitalization predictive model. However the rates of RSV hospitalization in Northern Europe are lower than the rates in Spain, prompting us to examine the usefulness of this model in a Scandinavian population. We used population-based data prospectively collected on 2529 infants born 33 to 35 wGA in Denmark to present an external statistical test of the robustness of the European RSV predictive model. METHODS In the publication by Simoes et al,5 7 variables describing the most important risk factors for RSV hospitalization in prema- ture infants 33 to 35 wGA in Spain were identified. These variables were “birth within 10 weeks of the start of the season,” “birth weight,” “breast-feeding Յ2 months,” “number of siblings Ն2 years of age,” “number of family members with atopy,” “male sex,” and “number of family members with wheeze.” In the original study, information on these 7 factors examined by dis- criminant function analysis resulted in a diagnostic accuracy of 71% when trying to identify premature infants hospitalized with RSV. Discriminant function analysis optimizes the variables which discriminate between 2 or more naturally occurring groups, here RSV-hospitalized versus non-RSV-hospitalized premature infants 33 to 35 wGA. Using prospectively collected population based data on 93,620 births during 1997 to 2003 from the Danish National Birth Cohort (DNBC) (www.BSMB.dk),6 2529 infants born 33 to 35 wGA and followed until the age of 18 months after birth were identified and data on the 7 variables described above were withdrawn in August 2008. For 3 of the 7 variables, the DNBC data did not exactly represent the Spanish data. In the Spanish data, information on siblings was defined to be number of siblings Ն2 years of age, but in the DNBC data number of siblings represented the total number of siblings below 12 years of age excluding any twin from multiple births. In the Spanish data, information on close relatives with wheeze or atopy included information on siblings and grandparents; but in the DNBC data close relatives with atopy was calculated with no data on grandparents available, and close relatives with wheeze was calculated with no data on grandparents and siblings available. Furthermore, other variables containing information on other established RSV hospitalization risk factors and information on mortality were withdrawn from DNBC. The additional risk factors included data on parental smoking during and after pregnancy, parental educational level, pets in the home, day care attendance, and chronic lung disease. The information on RSV season also included in the modeling was based on the Danish RSV season, November to April. Stensballe et al The Pediatric Infectious Disease Journal • Volume 29, Number 4, April 2010 © 2010 Lippincott Williams & Wilkins374 | www.pidj.com
  • 12. This Danish dataset was used to externally validate the robustness of the European Predictive Model. Information on the 7 variables in the Danish data was used to generate a discriminant function in the Danish dataset itself, resulting in a percentage value of true classification (here, of predicted RSV hospitalization) and receiver-operating-characteristic (ROC) plots of the sensitivity by (1–specificity) with areas closest to 1 predicting best predictive accuracy. Premature 33 to 35 wGA case infants who experienced RSV hospitalization were compared with premature 33 to 35 wGA case infants without RSV hospitalization. The analysis was carried out on all data with automatic substitution of neutral values for missing data, and secondarily, with exclusion of missing values. The neutral values were calculated from the mean values in the 2 outcome groups (hospitalized and nonhospitalized) and set so as to provide no bias in the discriminate functions derived from the data so modified. There were complete information on date of birth, sex, siblings, and on if any family member among parents or siblings had any atopic disease. For information on if any family member had wheeze, 32 individuals (1.3%) had missing informa- tion. For birth weight, 46 individuals (1.8%) had missing infor- mation. For breast-feeding, 993 individuals (39.3%) had missing information. The model was sought to be improved by serially removing variables from the model, by inclusion on information on the other established risk factors, and by substituting categorical (Yes/No) variables for atopy and wheeze. Finally, the unadjusted coefficients generated from the Spanish study were applied to the Danish data. All analyses were carried out using SPSS 15 for Windows. RESULTS A total of 2614 infants included in DNBC were born 33 to 35 wGA (gestational days 231 to 251). Of them, 37 stillborn infants were excluded. Forty-six infants who died during fol- low-up were excluded from the analyses, one had chronic lung disease and none of these infants experienced RSV hospitaliza- tion. 2 infants without RSV hospitalization had chronic lung disease and were excluded from the analyses. Of the 2529 infants born 33 to 35 wGA left for follow-up, 139 (5.5%) experienced an RSV hospitalization. When the Danish data were used to validate the 7-variable European Predictive Model and the analysis was carried out on all data with automatic substitution of neutral values for missing data, the resulting diagnostic accuracy was 65.9%, with an area under the ROC curve of 0.625 (0.578–0.673) (Figure 1). The negative predictive value at the point of maximum discrimination for the Danish data was 0.86. If the missing data was excluded from the analyses, the resulting diagnostic accuracy was 63.3%, with an area under the ROC curve of 0.598 (0.524–0.671). The exclusion of missing data reduced the number of RSV cases to 66 and controls to 991. When variables were serially removed from the model, improvement was achieved when atopy was eliminated, giving 68.1% correct classification and AUC 0.634 (0.586–0.681). Op- timization was attempted by substituting categorical (Yes/No) variables for atopy and wheeze and by using all the variables in the data set, but with no improvement. Since the variable “birth within 10 weeks of the start of the season” had the greatest positive impact on the fit of the predictive model, further optimization was achieved by stratifying the data by season, leading to improvement of the diagnostic accuracy in some but not all seasons (data not shown, available on request). When the discriminant function analysis was based on the unadjusted coefficients from the FLIP dataset with information on Spanish infants 33 to 35 wGA, the diagnostic accuracy was 62% and the area under the ROC curve was 0.598 (0.553–0.644). DISCUSSION The present population-based cohort study externally vali- dated the recently published European RSV hospitalization pre- dictive study to test the robustness of that model when used in other European infant populations. The model included informa- tion on globally established risk factors for RSV hospitalization: time of birth, birth weight, male sex, breast-feeding, siblings, and family disposition to atopy and wheeze.1,7,8 Using data on Danish premature infants born week 33 to 35 of gestation, we found a diagnostic accuracy of nearly 66% of the model. A diagnostic accuracy of about 66% might not appear high. However, in the study by Simoes et al5 where the original model tested in the present study was generated it was found that using, for example, the Spanish Guidelines to identify premature children at increased risk of RSV hospitalization was not better than chance. Denmark has no specific guidelines; the Danish Pediatric Society recommends individual judgment when the use of RSV prophylaxis is considered. Our study was limited by several factors. Despite the large overall sample size, the total number of 139 RSV hospitalized infants born 33 to 35 wGA set statistical limitations. The data set were not precisely alike the data collected for the FLIP study and some of the variables had considerable missing values. We tested the diagnostic accuracy in the subset of the DNBC dataset without any missing information and found it to be essentially the same. FIGURE 1. ROC curve: Receiver-operating-characteristic (ROC) plot (sensitivity by (1–specificity)) for the Danish 7 variable model with automatic substitution of neutral val- ues for missing data. Notes: Data from the Danish National Birth Cohort (DNBC) (www.BSMB.dk) August 2008. The 7 variables were “birth within 10 weeks of the start of the season,” “birth weight,” “breast-feeding Յ2 months,” “number of siblings Ն2 years of age,” “number of family members with atopy,” “male sex,” and “number of family members with wheeze.” ROC plot areas closest to 1 predict best pre- dictive accuracy. The Pediatric Infectious Disease Journal • Volume 29, Number 4, April 2010 RSV Hospitalization Predictive Model © 2010 Lippincott Williams & Wilkins www.pidj.com | 375
  • 13. However, the European RSV hospitalization predictive model proved robust to external validation and the diagnostic accuracy remained satisfying. Recently, such a RSV risk-scoring tool based on information on the same 7 RSV risk factors was evaluated in Canadian infants 33 to 35 wGA and was found to be practical and effective in reducing RSV hospitalization in infants who are most at risk, while avoiding prophylaxis in the 82% of the GA cohort who were considered low risk for RSV infection.9 In countries like Denmark without RSV prophylaxis guidelines for premature infants and where the use of RSV prophylaxis is based solely on individual judgment, a risk-scoring model might improve the use and efficacy of RSV prophylaxis. CONCLUSION AND PERSPECTIVE This external validation of the European RSV predictive model confirmed the robustness of the model. Based on the model, computer software could be developed and offered to European neonatal de- partments to optimize the cost-effectiveness of the use of passive prophylaxis against RSV in premature infants born 33 to 35 wGA. REFERENCES 1. Law BJ, Langley JM, Allen U, et al. The Pediatric Investigators Collab- orative Network on Infections in Canada study of predictors of hospital- ization for respiratory syncytial virus infection for infants born at 33 through 35 completed weeks of gestation. Pediatr Infect Dis J. 2004;23: 806–814. 2. Connor EM; The IMpact-RSV Study Group. Palivizumab, a humanized respiratory syncytial virus monoclonal antibody, reduces hospitalization from respiratory syncytial virus infection in high-risk infants ͓see com- ments͔. Pediatrics. 1998;102:531–537. 3. Wang D, Cummins C, Bayliss S, et al. Immunoprophylaxis against respira- tory syncytial virus (RSV) with palivizumab in children: a systematic review and economic evaluation. Health Technol Assess. 2008;12:iii, ix–x, 1–86. 4. Figueras-Aloy J, Carbonell-Estrany X, Quero J. Case-control study of the risk factors linked to respiratory syncytial virus infection requiring hospital- ization in premature infants born at a gestational age of 33–35 weeks in Spain. Pediatr Infect Dis J. 2004;23:815–820. 5. Simoes EA, Carbonell-Estrany X, Fullarton JR, et al. A predictive model for respiratory syncytial virus (RSV) hospitalization of premature infants born at 33–35 weeks of gestational age, based on data from the Spanish FLIP Study. Respir Res. 2008;9:78. 6. Olsen J, Melbye M, Olsen SF, et al. The Danish National Birth Cohort— its background, structure and aim. Scand J Public Health. 2001;29:300– 307. 7. Stensballe LG, Kristensen K, Simoes EA, et al. Atopic disposition, wheez- ing, and subsequent respiratory syncytial virus hospitalization in Danish children younger than 18 months: a nested case-control study. Pediatrics. 2006;118:e1360–e1368. 8. Carbonell-Estrany X, Figueras-Aloy J, Law BJ. Identifying risk factors for severe respiratory syncytial virus among infants born after 33 through 35 completed weeks of gestation: different methodologies yield consistent findings. Pediatr Infect Dis J. 2004;23:S193–S201. 9. Paes B, Steele S, Janes M, et al. Risk-scoring tool for respiratory syncytial virus prophylaxis in premature infants born at 33–35 completed weeks’ gestational age in Canada. Curr Med Res Opin. 2009;25:1585–1591. ANTIRETROVIRAL-RELATED HEMATOLOGIC SHORT-TERM TOXICITY IN HEALTHY INFANTS IMPLICATIONS OF THE NEW NEONATAL 4-WEEK ZIDOVUDINE REGIMEN Rebeca Lahoz, MD,* Antoni Noguera, MD, PhD,* Nu´ria Rovira, MD,* Albert Catala`, MD,* Emília Sa´nchez, MD, PhD,† Rafael Jime´nez, MD, PhD,* and Cla`udia Fortuny, MD, PhD* Abstract: Recent updates of the guidelines on the prevention of human immunodeficiency virus mother-to-child transmission have shortened the neonatal zidovudine prophylactic regimens from 6 to 4 weeks. We present a prospective observational study in a large cohort of mother-infant pairs and report that the 4-week regimen allows an earlier recovery of the anemia in these otherwise healthy infants. Key Words: hematologic toxicity, human immunodeficiency virus, neonatal prophylaxis, pediatrics, zidovudine Accepted for publication October 27, 2009. From the Departments of *Pediatrics, and †Hematology, Pediatric Infectious Diseases Unit, Hospital Sant Joan de De´u-Universitat de Barcelona, Barce- lona, Spain; and ‡Catalan Agency for Health Technology Assessment and Research, Barcelona, Spain. Address for correspondence: Antoni Noguera, MD, PhD, Infectious Diseases Unit, Pediatrics Department, Hospital Sant Joan de De´u, Passeig Sant Joan de De´u 2, 08950 Esplugues, Barcelona, Spain. E-mail: ton@hsjdbcn.org. Supplemental digital content is available for this article. Direct URL citations appear in the printed text and are provided in the HTML and PDF versions of this article on the journal’s Web site (www.pidj.com). DOI: 10.1097/INF.0b013e3181c81fd4 Mother-to-child transmission (MTCT) of human immuno- deficiency virus (HIV) in developed countries has de- creased to Ͻ2% after the implementation of prophylactic mea- sures, such as the use of antiretrovirals (ARV), elective cesarean section, and refraining from breast-feeding.1–3 Expo- sure of these otherwise healthy infants to one or more drugs of unknown toxicity is of concern. To date, most of the reported hematologic and mitochondrial adverse effects, of which zidovudine (ZDV)-related reversible anemia is the most com- mon, have shown mild clinical significance.4 – 8 After the PACTG 076 study,9 the 6-week neonatal oral ZDV chemoprophylaxis regimen became standard care. Since 2005, HIV-exposed neonates in the United Kingdom have been treated for 4 weeks,3 in accordance with postexposure prophylaxis (PEP) guidelines in other situations.10 We investigated whether the new 4-week neonatal ZDV regimen has led to a decrease in hematologic toxicity in a large cohort of HIV-uninfected infants. MATERIALS AND METHODS A single-center prospective observational study was con- ducted in a cohort of mother-infant pairs, followed up prospec- tively from January 2000 in a tertiary-care pediatric hospital in Barcelona (Spain). Informed consent was obtained from all women at enrollment and the study protocol was approved by the local Ethics Committee. As per protocol, demographic, clinical, and laboratory data are routinely collected on all patients, and a complete clinical examination and blood tests were performed at every visit (at 2, 3, and 6 weeks, and at 3, 6, and 12 months of age). Laboratory tests included a full blood picture and a viral load assay (proviral HIV-DNA, Amplicor HIV until year 2003, and HIV- RNA quantification, CA HIV Monitor, thereafter; Roche, Basel, Switzerland). HIV-exposed uninfected infants were eligible if they had been exposed to ARV during gestation and had received ZDV monotherapy during the neonatal period. According to current guidelines,1 an infant was defined as HIV-uninfected if 2 or more viral load tests were negative, with one test at age 1 month or older and one test at age 4 months or older. The following exclusion criteria were used: hepatitis C virus (HCV) infection, gestational age at birth less than 36 weeks, and the presence of any other medical condition capable of causing hematologic disorders. Patients were initially defined according to the length of their neonatal ZDV treatment period, a 6-week regimen or a 4-week regimen, according to current guidelines at the time of birth. A univariate assessment of differences in toxicity between the 2 groups Lahoz et al The Pediatric Infectious Disease Journal • Volume 29, Number 4, April 2010 © 2010 Lippincott Williams & Wilkins376 | www.pidj.com
  • 14. was conducted using the ␹2 test for categorical variables and the t test for continuous variables. Multivariate regression analyses controlling for several factors known to be associated with hematologic variables (maternal age, ethnicity, drug use, CD4 cell count and plasma viral load, type and length of ARV regimens during pregnancy, and the infant’s sex, gestational age, and weight at birth) were used to assess the association between the different ARV treatment regimens and the outcome variables. All tests were 2-tailed, and a P value Ͻ0.05 was considered significant. Statistical analysis was performed with the SPSS 12.0 Program. RESULTS As of June 2008, 221 infants had been enrolled in the cohort. Among these, 50 patients were excluded because of: neonatal ARV prophylaxis other than ZDV monotherapy (n ϭ 13), HIV infection (n ϭ 5, all of them diagnosed during the first week of life), hepatitis C virus infection (n ϭ 11), gestational age at birth less than 36 weeks (n ϭ 10), and other medical conditions (n ϭ 11). The final study cohort consisted of 171 patients (80 women, 46.8%). Overall, 138 patients (80.7%) received a 6-week neonatal regimen of oral ZDV, while 33 (19.3%) received the new 4-week regimen. Most of the children in the latter group were born from 2005 onwards. All children were exclusively bottle-fed and none received prophylactic trimethoprim-sulfamethoxazole. Data regarding gestation, birth, and neonatal clinical vari- ables are summarized in the Table, Supplemental Digital Content 1, http://links.lww.com/INF/A334. At delivery, mothers in the 6-week ZDV group were significantly younger (P ϭ 0.022), and had been treated more often with stavudine (34% vs. 12%, P ϭ 0.015) and nelfinavir (36% vs. 12%, P ϭ 0.008) and less often with emtricitabine (0% vs. 12%, P ϭ 0.001), abacavir (4% vs. 15%, P ϭ 0.039), and tenofovir (1% vs. 12%, P ϭ 0.014) as part of their highly active antiretroviral therapy (HAART) regimens. Lower mean hemoglobin values (12.1 vs. 13.1 g/dL; P ϭ 0.006) and a higher rate on all Division of Acquired Immunode- ficiency Syndrome toxicity grades11 in hemoglobin concentrations (76% vs. 48%; P ϭ 0.005) at the age of 2 to 3 weeks were observed in infants whose mothers had received ZDV as part of their HAART regimens during pregnancy. These findings persisted in multivariate analyses (odds ratio: 4.28 for any toxicity in hemoglobin values when ZDV was included in maternal therapy; 95% confidence interval ͓CI͔: 1.01–18.05; P ϭ 0.048). No other differences in baseline characteristics or associations between those and hematologic findings were observed (data not shown). Overall, no statistically significant differences were ob- served in hemoglobin, mean corpuscular volume (MCV), neutro- phil, lymphocyte, and platelet counts (Figs. 1A–E) between the 2 groups, except for MCV values at 6 weeks and 3 months of age, which were lower in the 4-week ZDV group (P Ͻ 0.0001 and P ϭ 0.002, respectively; Fig. 1B). In both groups, mean MCV was higher than reference values up to the age of 6 weeks and later became normal. Changes over time in significant abnormalities 6 7 8 9 10 11 12 13 14 15 3 w 6 w 3 m 6 m 12 m 50 60 70 80 90 100 110 120 3w 6w 3m 6m 12m p <.0001 p =.002 0 1000 2000 3000 4000 5000 6000 7000 3w 6w 3m 6m 12m 2000 3000 4000 5000 6000 7000 8000 9000 10000 11000 12000 3w 6w 3m 6m 12m 0 100000 200000 300000 400000 500000 600000 700000 3w 6w 3m 6m 12m hemoglobin (g/dl) mean corpuscular volume (fl) neutrophils per mm3 lymphocytes per mm3 platelets per mm 3 A B C D E FIGURE 1. A to E, Changes over time of the different hematologic parameters according to the length of the neonatal zidovudine regimen, 6 weeks (solid line) or 4 weeks (dotted line). The Pediatric Infectious Disease Journal • Volume 29, Number 4, April 2010 Neonatal Zidovudine Toxicity © 2010 Lippincott Williams & Wilkins www.pidj.com | 377