- The document summarizes the estimates for Rabi oilseed production and availability of vegetable oils in India for the 2013-14 season as arrived at by the 35th All India Rabi Seminar on Oilseeds, Oil Trade and Industry.
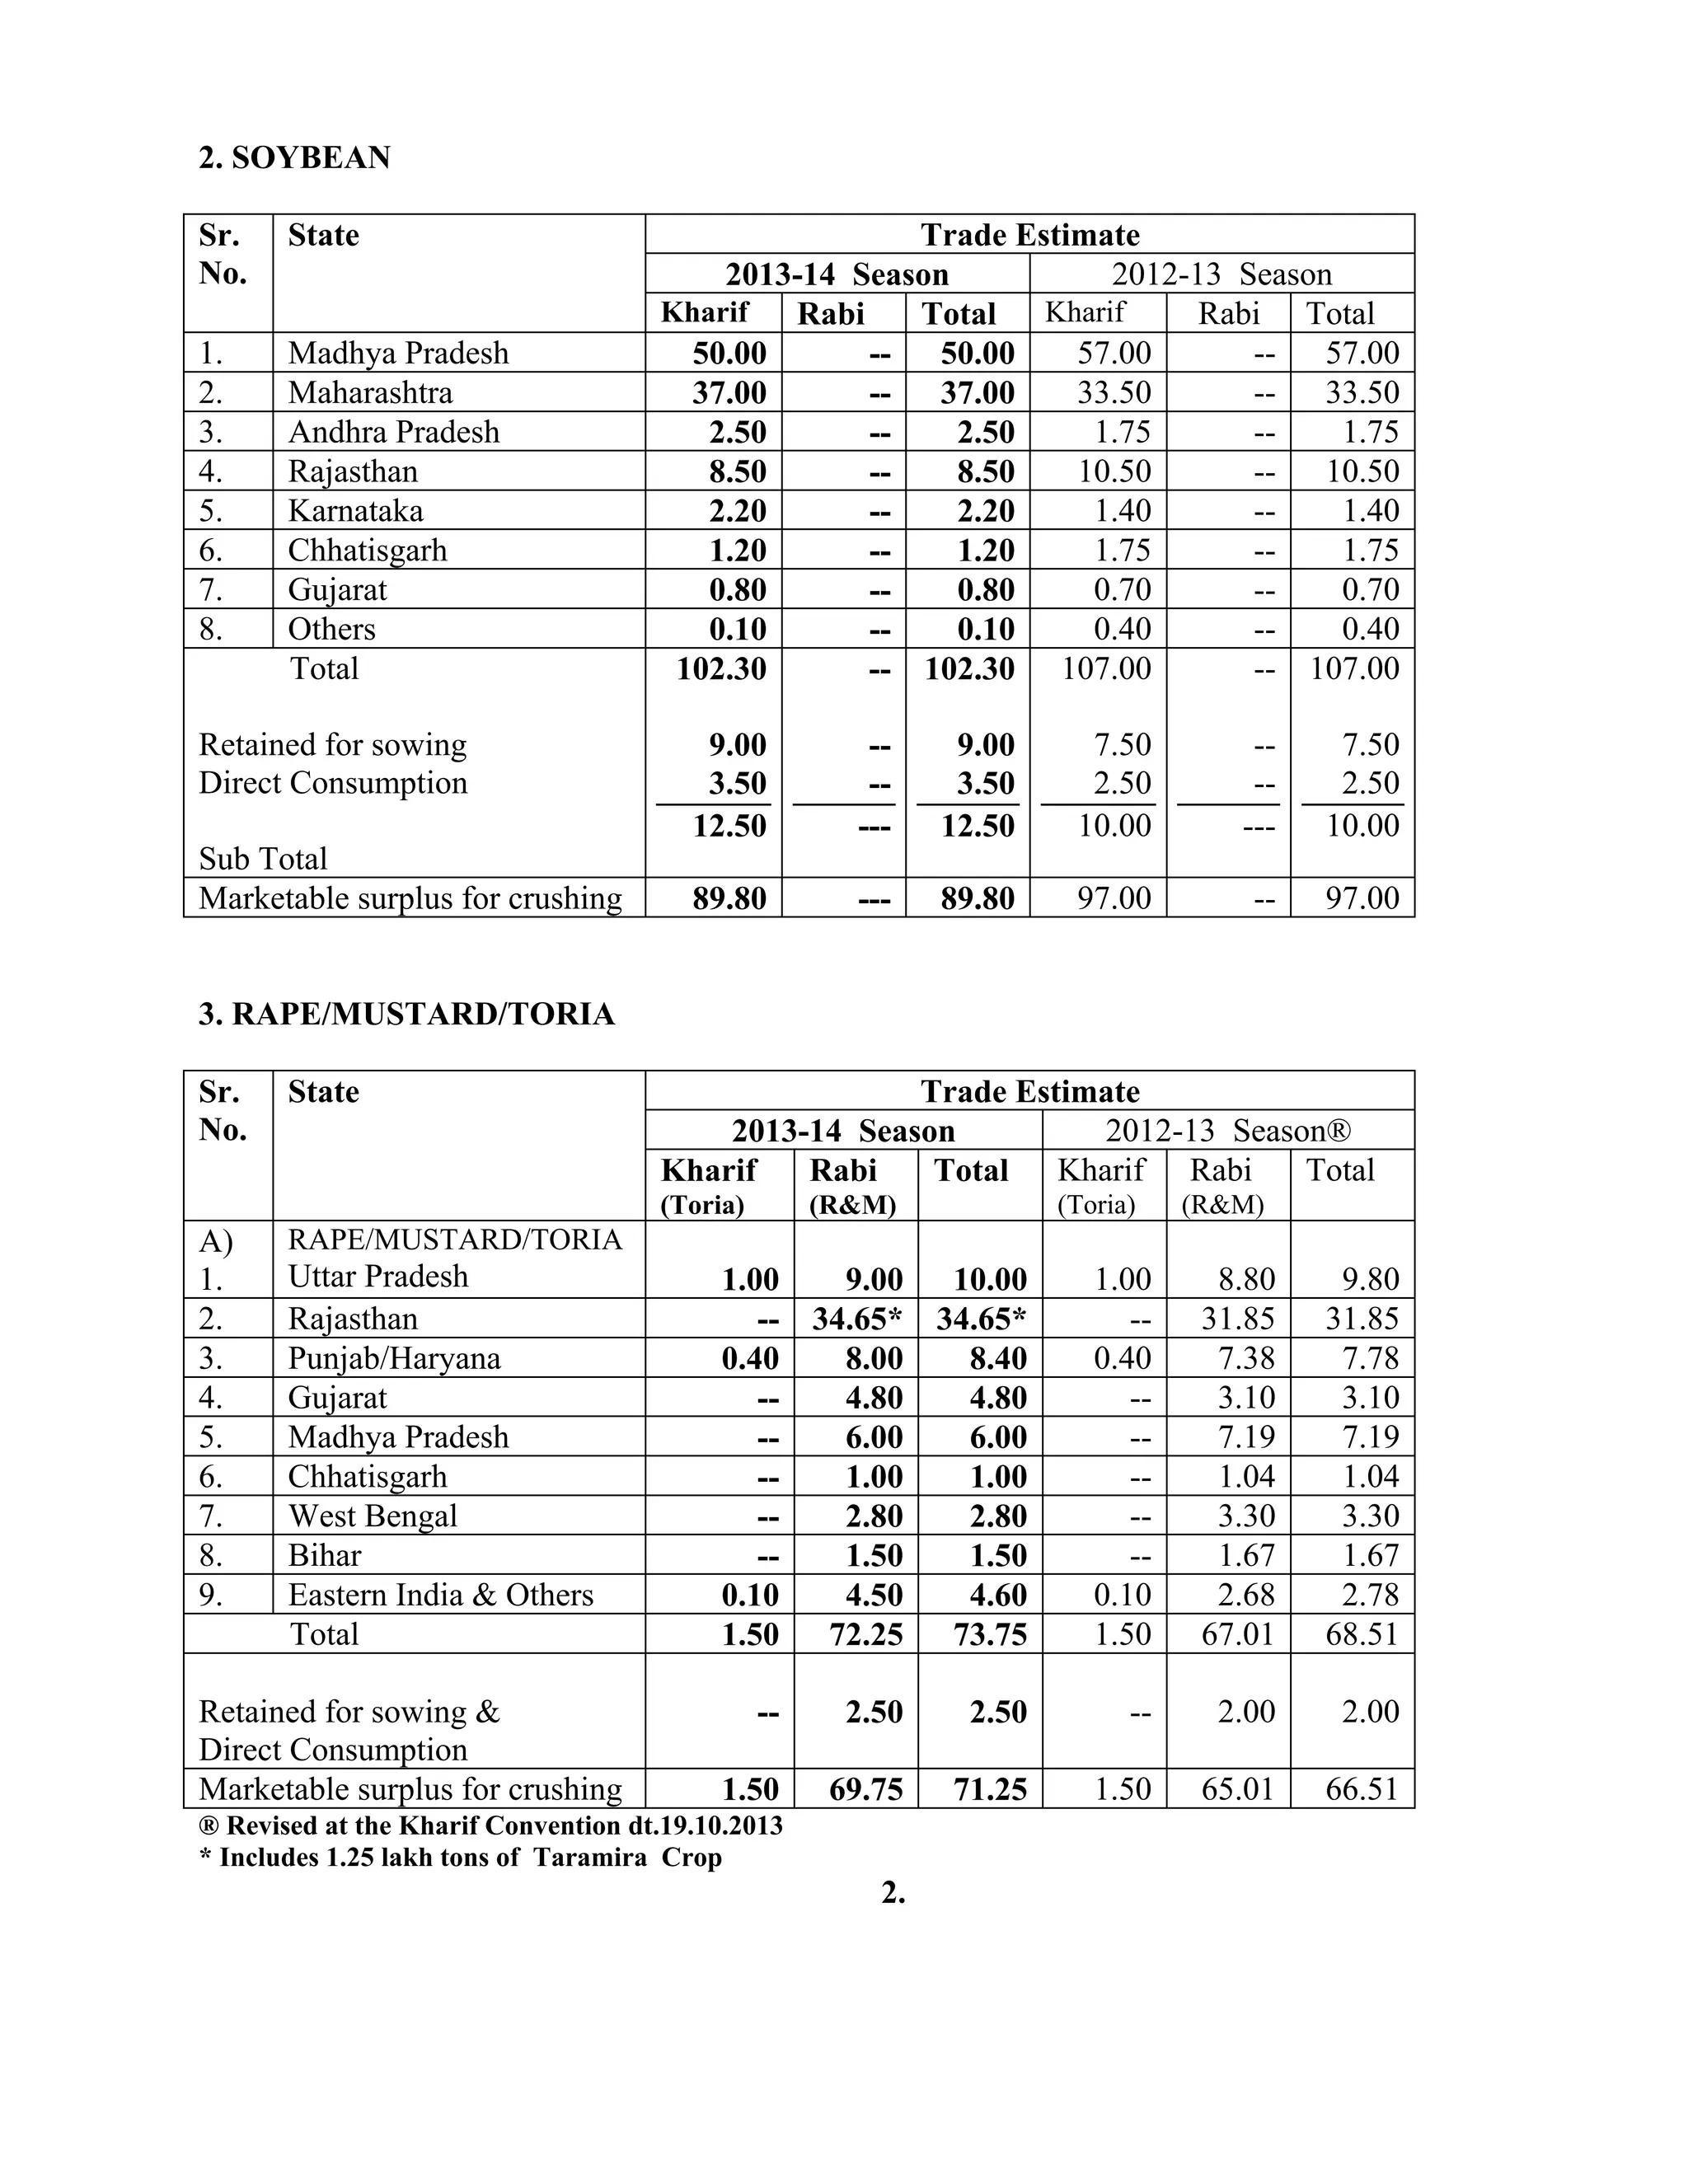
- Total Rabi oilseed production is estimated at 99.1 lakh tonnes, an increase of 5.66 lakh tonnes compared to the previous year. Rapeseed-mustard production saw the largest increase of 5.24 lakh tonnes.
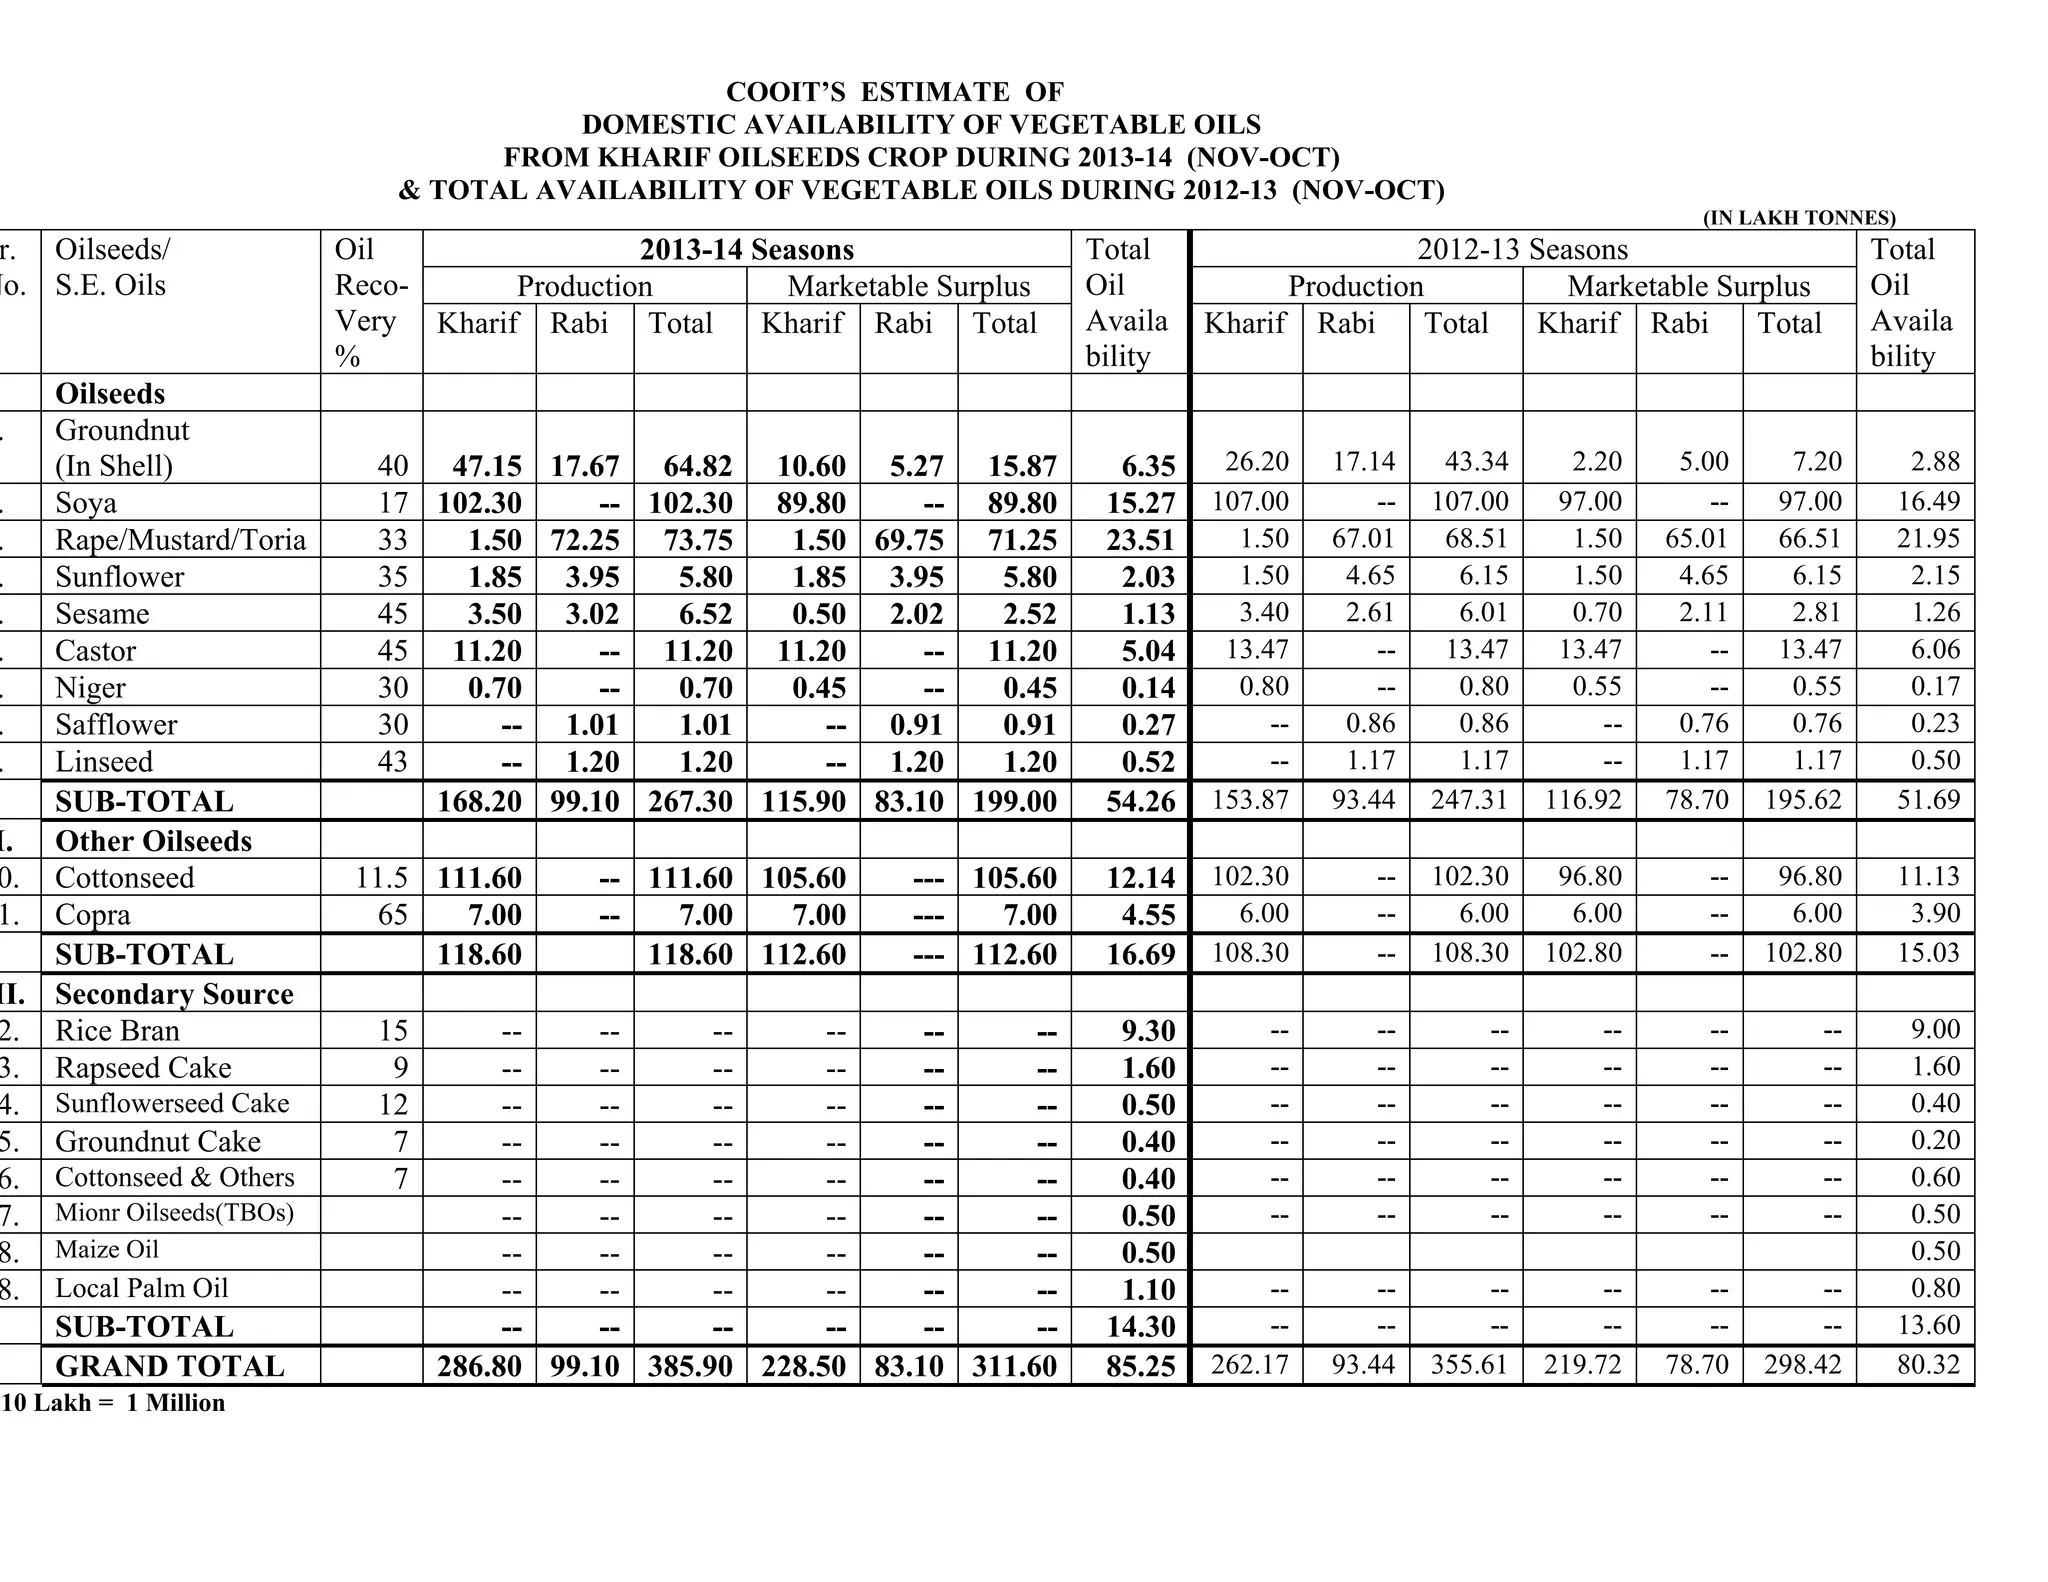
- Total oilseed production for 2013-14 from Kharif and Rabi crops combined is estimated at 267.3 lakh tonnes, an increase of 19.99 lakh tonnes over the