1. 1
Category q-bio.GN - Genomics
Population Fitness and Genetic Load of Single Nucleotide Poly-
morphisms Affecting mRNA splicing
Peter K Rogan1,2*
and Eliseos J Mucaki2
Departments of 1
Biochemistry and 2
Computer Science, University of Western Ontario, London, Canada N6A 5C1.
ABSTRACT
Deleterious genetic variants can be evaluated as quantitative traits
using information theory-based sequence analysis of recognition
sites. To assess the effect of such variants, fitness and genetic load
of SNPs which alter binding site affinity are derived from changes in
individual information and allele frequencies. Human SNPs that
alter mRNA splicing are partitioned according to their genetic load.
SNPs with high genetic loads (>0.5) are common in the genome
and, in many instances, predicted effects are supported by gene
expression studies.
1 INTRODUCTION
The identification of true risk alleles in genome wide association
studies has often been confounded by population structure. Lin-
kage disequilibrium can extend over large genomic distances and
depends on chromosome geneology, making it challenging to pin-
point causative alleles (Kimmel et al. 2008). High density genomic
sequencing accompanied by computational approaches to predict
deleterious variants may potentially overcome the challenges
posed in some GWAS analyses. These methods aim to prioritize
analysis of SNPs to those with functional effects on gene products,
gene structure and/or expression.
The effects of natural sequence variation at nucleic acid binding
sites can be assessed with models based on Shannon information,
since individual information content is related to the affinity of the
binding event (Schneider 1997). Phenotypes can be predicted from
corresponding changes in the individual information contents (Ri,
in bits) of the natural and variant DNA binding sites (Rogan et al.,
1998). In mRNA splicing, mutant sites have lower Ri values than
the corresponding natural sites, with null alleles having values at or
below 1.6 bits (Rogan et al. 2003; Kodolitsch et al., 1999). The
decreased Ri values of mutated splice sites indicate that such sites
are either not recognized or are bound with lower affinity, and may
result in exon skipping or cryptic site activation. Decreases in Ri
are more moderate for leaky splicing mutations and are associated
with milder phenotypes. The minimum change in binding affinity
for leaky mutations is ≥ 2ΔRi
lower fold than cognate wild type
sites. Mutations that activate cryptic splicing may decrease the Ri
value of the natural site, increase the strength of the cryptic site, or
concomitantly affect the strengths of both types of sites (see Figure
2). Non-deleterious changes result in negligible changes in Ri
*To whom correspondence should be addressed at progan@uwo.ca
(Rogan and Schneider, 1995). Increases in Ri indicate stronger
interactions between protein and cognate binding sites.
The information content of a sequence measures the success (or
fitness) of the organism in its environment (Adami et al 2000).
Neutral mutations which change Shannon entropy are critical for
evolution to proceed (Maynard-Smith 1970). Adaptive evolution
can be viewed (in the absence of frequency-based selection) as the
maximization of fitness in a population. The fittest genotype is the
one with the highest growth rate. Expressed in an information
theory framework, growth rate (or channel capacity) is limited by
the length of the message encoding the genotype, the bit rate of
transmission from parent to offspring and the power to noise ratio,
which is equivalent to robustness to effects of mutation.
In this study, we develop a fitness metric that detects deleterious
alleles based on changes in information content at functional bind-
ing sites. By determining their mutational load, we apply this
measure to detect splicing mutations in the population resulting
from validated single nucleotide polymorphisms (SNPs). Many of
these predictions can be confirmed with gene expression data.
2 METHODS
2.1 Objective function
The objective function relates differences in individual Shan-
non information content of a pair of functional alleles (Ri,major,
Ri,minor) to the fitness of these genotypes in a population of individ-
uals. Fitness is a usually unitless measurement of replication ability
of a particular individual in a specified environment. To apply
fitness (W) in the context of the information content of a pair al-
leles, we assume a homogeneous genetic landscape in the absence
of any other data regarding their origin. In population genetics,
comparison of fitnesses of different genotypes gives a ratio of their
respective replication rates. Fitness is defined as the log of the
actual replication rate, because merits of one genotype relative to
another are doled out using an exponential scheme. Replication
rate is the merit divided by the mean gestation time (assumed to be
constant for genotypes exposed to the same environment). In ar-
tificial organisms merit increases exponentially with reproductive
success, and the information content corresponds to the log of its
fitness (Adami 1998).
Ri ≅ log2 W (1)
2. Mucaki and Rogan
2
Rearranging eq (1),
𝑊 ≅ 2𝑅𝑖
(2)
The difference in the individual information contents of the minor
and dominant alleles (Ri,major - Ri,minor = ∆ Ri) can be restated in
terms of the fitness of these alleles.
For a single gene locus with the alleles A1..An, which have the fit-
nesses, w1..wn and the allele frequencies, p1..pn, respectively, 𝑤
� is
the mean of all the fitnesses weighted by their corresponding fre-
quency of allele Ai:
𝑤
� = ∑ 𝑝𝑖𝑤𝑖
𝑛
𝑖=1 (3)
Expressing mean fitness in terms of the individual information of a
SNP with two alleles:
𝑤 = 𝑝1 2Ri,major + 𝑝2 2Ri, minor (4)
Ignoring frequency-dependent selection, then locus-specific genet-
ic load (L) is:
𝐿 =
𝑊𝑚𝑎𝑥− 𝑊
�
𝑊𝑚𝑎𝑥
(5)
where wmax is the maximum possible fitness, 2Ri,major. The multi-
locus mean fitness (in the absence of linkage between loci) is the
product of the genetic loads for individual loci (Crow and Kimura
1970):
𝑤
�𝑃𝑂𝑃𝑈𝐿𝐴𝑇𝐼𝑂𝑁 = ∏ (1 −
𝑗=1,𝑛 𝐿𝑗) (6)
2.2 Information and expression analysis of HapMap SNPs
SNP-induced changes in natural splice site information were
detected by scanning all human chromosome sequences with in-
formation weight matrices based on sequences of known donor and
acceptor splice regions from both strands of the human genome
reference sequence (Rogan et al., 2003). The average information
contents of the acceptor and donor sites in these models are respec-
tively, 9.8118 ± 0.0001 bits/site and 8.12140 ± 0.00009 bits/site.
Splicing related changes in the information contents of splice do-
nor and acceptor sites were computed for all SNPs in the reference
human genome (hg18) that have been validated in the Phase II
human haplotype map (www.hapmap.org). The results were fil-
tered to select changes in Ri values of all annotated donor and
acceptor sites. These changes have been organized and related to
known gene structures, population genotypes and allele frequen-
cies and gene expression results.
We created a MySql database to integrate microarray and EST
expression data with gene structure, SNP genotype, allele frequen-
cy and changes in splice site information. The gene expression
data are derived from Genbank (mRNAs and ESTs) and from GEO
dataset (GSE7792; Huang et al, 2007), which covers all exons on
the Affymetrix exon ST array hybridized with cDNAs of geno-
typed HapMap samples. Exon expression data was derived from
Affymetrix Human Exon 1.0 ST microarray data of 176 genotyped
HapMap cell lines. Probeset intensities were re-computed by
eliminating probes which overlapped any known SNP (dbSNP129)
prior to normalization. Microarray data was normalized using the
PLIER algorithm, then incorporated into a MySQL database with
tables containing HapMap genotypes and Ensembl gene and exon
boundaries. The database was used to relate SNPs to their nearest
probesets to find genotype-related changes in the splicing index
(defined as probeset intensity/overall gene intensity) of an exon.
SNPs found within donor and acceptor splice sites where geno-
type-specific splicing index changes (major homozygote, hetero-
zygote, minor homozygote genotypes where possible) are present
in a related probeset.
SQL queries were used to identify changes in gene expression
concordant with predictions of information theory based changes
due to SNPs within naturally-occuring donor and acceptor splice
sites. We have previously shown that changes in information con-
tent can be due to SNP-related splicing mutations and that these
changes affect gene expression (Nalla et al., 2005).
Perl scripts were developed to compute genetic fitness and load
for all SNPs based on information-based changes in mRNA splice
sites and population allele frequencies. Analyses were performed
both on a composite set of CEU (Caucasian; n=90) and YRI (Yo-
ruba/Nigerian; n=90) individuals. Offspring of CEU trios were
removed from the allele frequency calculations. Each population
was also analyzed separately for intergroup comparisons of the
effects of differences in allele frequencies.
3 RESULTS
3.1 Fitness and genetic load estimation
Both Ri values and allele frequencies (Table 1) affect genetic
load and fitness as predicted. Rare SNPs (p2 = 0.01) with small
changes in Ri (<0.5 bit) marginally reduce genetic load and popu-
lation fitness. Since this corresponds to ~1.4 fold lower binding
site affinity, there is only a modest change in expression due to
such SNPs. The multilocus mean fitness is reduced for such muta-
tions, but these variants can still be tolerated at numerous genomic
loci. By contrast, low frequency alleles (0.05<p2<0.1) with larger
∆Ri values (1 to 5 bits) depress the load and population mean fit-
ness to unsustainable levels when present at many loci (n=100).
Table 1. Fitness and load computation using simulated parameters
Ri, major Ri,minor p2 𝑤
� 𝑤𝑚𝑎𝑥 L # Loci 𝑤
�𝑃𝑂𝑃
10 5 0.1 924 1024 0.09 1 0.9
10 5 1.0 32 1024 0.97 1 0.03
8 7 0.1 243 256 0.05 1 0.95
10 5 0.1 924 1024 0.09 10 0.36
10 5 0.1 924 1024 0.09 100 0.00004
8 7 0.1 243 256 0.05 10 0.6
8 7 0.1 243 256 0.05 100 0.01
8 7.5 0.01 252 256 0.01 100 0.18
Interestingly, an increase in Ri of a rare minor allele can signifi-
cantly increase the genetic load. In these instances, selection is
operating to reduce exon recognition, and increase exon skipping.
3. Population Fitness and Genetic Load of Single Nucleotide Polymorphisms Affecting mRNA splicing
3
3.2 Distribution of SNP-related changes in individual in-
formation at natural splice sites
3.2.1 ∆Ri values at natural splice sites. The human genome refer-
ence sequence was analyzed for all information changes due to
Phase II HapMap SNPs (n=4,071,589). The information contents
of cryptic and natural splice sites within known genes were altered
for 1,093,474 of these variants (361,003 donor sites, 732,471 ac-
ceptor sites, which includes cryptic splice sites). Of these, 9051
SNPs altered the Ri values of natural donor and acceptor sites in
5970 genes, with 211 having more than one SNP mapped to the
same site. There were 8 instances where two different natural
splice sites were affected by the same SNP. The information
changes affected similar numbers of SNPs for both minor and ma-
jor alles (Ri,major > Ri,minor: 4311; Ri,minor > Ri,major: 4740). As ex-
pected from selection, the quantity natural sites altered by SNPs is
related to the severity of the mutation (Table 2).
Table 2. Splice sites affected by SNPs for different ∆Ri thresholds
∆Ri (bits) Total # sites # Donor # Acceptor
≥ 0.1 8873 1767 7106
≥0.5 7064 1347 5717
≥1.0 3097 963 2134
≥5.0 462 145 317
3.3 Fitness and genetic loads from combined HapMap pop-
ulations
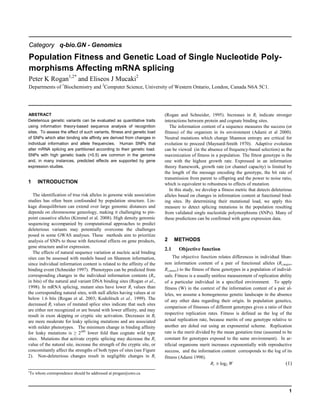
3.3.1 Intrasite distribution of sequence changes. Position-specific
substitutions within natural splice donor and acceptor sites were
analyzed for rare and common SNPs with predicted effects on
splicing. SNPs with small load values (<0.12) were filtered in
order to minimize variants with limited effects on splicing (likely
the result of genetic drift). Substitutions in the conserved dinuc-
leotide (0, +1) adjacent to all splice junctions are significantly less
common than changes elsewhere (some common SNPs do occur at
these positions). In donor sites, the patterns of substitution are
consistent at low and high allele frequencies. Overall, substitutions
due to rare SNP alleles are ~5 fold less abundant than for common
alleles. Substitutions in protein coding sequences frequently alter
strengths of both donor (-1 to -3) and acceptor (+1, +2) splice sites.
.
3.3.2 Genetic load analysis. SNPs with L> 0 occuring at natural
splice sites in 5374 different genes (Table 3). The
Table 3. Relationship between genetic load and average ∆Ri
L > No. Sites ∆𝑹
����𝒊 (bits) ±Std.Dev.
0.00 7476
0.10 5375 0.36 2.4
0.12 5046 0.44 2.4
0.20 3773 0.82 2.34
0.30 2634 1.17 2.44
0.40 1426 1.84 2.73
0.50 779 2.69 3.07
0.60 484 3.19 3.43
0.70 293 3.72 3.78
0.80 146 4.94 4.75
majority of these variants with low loads (L<0.12) exhibit small
changes in information (∆Ri <1 bit), limiting their impact on spli-
cesomal binding affinity and exon recognition. The contribution of
the ∆Ri term predominates over allele frequency at larger loads
(L>0.5), because of larger difference between the mean and maxi-
mum fitness. Sensitive quantitative RT-PCR assays do not consis-
tently detect changes in transcript levels below ∆Ri<0.5 bits (Ro-
gan and Mucaki, in preparation). At low load values, small effects
due to segregating SNPs that result from genetic drift are challeng-
ing to sort out from phenotypically significant modest changes in
mRNA splicing. The relationship between L and ∆𝑅
����𝑖 is not a sim-
ple one, which is evident from the large standard deviations on
∆𝑅
����𝑖.
The genome-wide distribution of high load SNPs affecting
mRNA splicing was partitioned according to allele frequency (Fig-
ure 2). Rare MAF alleles span the full range of genetic loads (0 –
0.98), whereas L for common alleles is highly constrained (
≤0.5),
probably because of selection. Based on results in Tables 2 and 3,
we expected to find fewer SNPs with higher loads with increasing
∆Ri values due to selection. However, the SNP density plots (Fig.
2) of L over the full range of minor allele frequencies reveals a
more complex distribution.
0
20
40
60
80
100
120
-2 0 2 4 6
Number
of
SNPs
Position relativeto splice junction
p2>0.05 p2<0.05 All SNPs
Figure 1. Position-specific substitutions due to SNPs in donor (left) and
acceptor (right) splice sites with genetic loads ≥ 0.12.
Figure 2. Genetic loads (L) of SNPs in CEU + YRI populations sorted by
minor allele frequency (MAF). Panels depict all SNPs across full range of
loads (0 – 1; left), and exclusively those with high loads (0.5 – 1; right).
Legends below the corresponding panel indicate graduated grayscale
distributions of SNP densities, each thresholded by a range of counts. The
plot resolution of each window is 0.01 L x 0.01 MAF units. Labels A-D
depict locally dense concentration of SNPs.
4. Mucaki and Rogan
4
The distribution of SNPs with rare alleles (p2 ≤0.05) is multi-
modal, with major peak concentrations from 0 <L ≤ 0.11 (region
A) and 0.2 ≤L≤ 0.5 (region C). This partitioning may prove to have
functional significance. Region A consists of 267 SNPs, with
0.51≤∆Ri ≤0.78 bits. Interestingly, the Ri values of the minor al-
leles of all splice sites altered by these SNPs are stronger than the
corresponding major alleles. Region C contains 930 SNPs, of
which 696 have minor alleles with lower Ri values (-18.63 ≤∆Ri ≤ -
0.5; ∆𝑅
����𝑖 = -1.55 ± 2.81 bits). Few these SNPs have increased Ri
values, with a maximum of 0.2 bits.
Locally dense pockets of common SNPs are clustered within a
narrow range of low load values (regions B [0.1 ≤L≤ 0.15] and D
[0.1 ≤L≤ 0.2]) and a broad range of allele frequencies. Region B
consists of 239 SNPs with minor alleles with predominantly lower
Ri values (-1.7 ≤∆Ri ≤ 0.35; ∆𝑅
����𝑖 = -0.70 ± 0.42 bits). Stratifying
this region, SNPs with higher loads (0.13-0.15) exhibit larger re-
ductions in ∆Ri (> -1 bits). Region D consists of a block of 433
SNPs, most of which show limited changes in Ri values (-1.3 ≤∆Ri
≤ 0.66; ∆𝑅
����𝑖 = 0.22 ± 0.59 bits). Only 18 splice sites have SNPs
with ∆Ri ≥ -0.9 bits.
3.3.3 Gene expression validation of predicted SNP effects.
Predictions of information analysis were compared with microar-
ray expression data for exons associated with these SNPs. Initial-
ly, splicing indices (SI) of relevant probesets were simply com-
pared with ∆Ri values of splice sites associated with SNPs pre-
dicted to reduce splice site use. There are limitations with the accu-
racy of this approach, as probesets often can show considerable
variation in SI values in individuals with the same genotypes.
SNPs (n=355) that concommitantly activate one or more adjacent
cryptic sites within the same probeset were also eliminated from
the analysis, since these would not be expected to alter SI.
Table 4. Relationships between SI and ∆Ri
Range of SI ratios between:
∆Ri(maj-min) 0.7 and 0.9 0.5 and 0.7 >0 and 0.5 Total # SNPs
> 2 47 8 11 66
1 to 2 70 26 13 109
0.5 to 1 251 84 75 410
0 to 0.5 102 28 21 151
-0.5 to 0 94 20 12 126
-0.5 to -1 191 54 61 306
-1 to -2 83 32 38 153
< -2 83 39 43 165
We anticipated that categories of SNPs with higher ∆Ri values
would be associated with lower SI expression changes. While there
is some suggestion that this may be correct (SI: compare >0 - 0.5
vs 0.7 – 0.9), the results are not compelling (Table 4). Statistical
tests developed to predict alternative splicing events from microar-
ry expression data have also had mixed results (Hu et al. 2001;
Wang et al. 2003).
The use of high load SNPs with allele-specific, dose-dependent
expression of the weaker splice site effectively eliminates SNPs
with high coefficients of variation of interindividual expression
and permits direct analysis of allele specific effects. We analyzed
1069 SNPs in which hetero- and homozygous individuals carrying
the lower Ri value allele were concordant for SI (either both >1 or
both <1). For example, rs3764897 is a common SNP (MAF= 0.23,
L=0.634) in exon 23 of the PLD2 gene, which strengthens an al-
ternative donor site downstream (from G: 1.5 → A: 4.1 bits) lead-
ing to a 33 nt extension of this exon (Figure 3). The median SI of
probeset 3707250 which covers the extended exon is consistent
with increasing dosage of the A allele.
rs924900 is an example of a rare, high-load SNP (MAF=0.02;
L=0.74) that affects inclusion of the adjacent exon in ZNF713
(Figure 4). The G allele weakens the acceptor site (∆Ri=2 bits),
reducing its expression and increasing exon skipping of the adja-
cent exon.
3.3.4 Mean fitness for HapMap individuals
The mean fitness of each of the mRNA splicing mutations for all
high load SNPs was determined explicity for each of the HapMap
individuals. Higher fitness SNP homozygous and heterozygous
genotypes are assumed to be equivalent. Of the 9051 SNPs (L>0)
which affect splice site strength, each of these individual are ho-
mozygous for, on average, 471±23 SNPs with the lower fitness
alleles. Figure 5 shows representative distributions of 𝑤
� for sam-
ples of 30 individuals from each of these HapMap populations. In
each individual, the majority of loci consist of slightly deleterious
mutations with average 𝑤
�~ 0.8. It is also evident, however, that
every individual harbors between 5 and 15 deleterious splicing
variants (0.02 < 𝑤
� ≤ 0.56). Regardless of which individual is ana-
lyzed, 𝑤
�𝑃𝑂𝑃𝑈𝐿𝐴𝑇𝐼𝑂𝑁≈ 0, and it is therefore underestimated by Eqn
(6). When mild mutations are eliminated from the analysis, and
𝑤
�𝑃𝑂𝑃𝑈𝐿𝐴𝑇𝐼𝑂𝑁 is computed from the SNPs with low 𝑤
� values (in
Figure 3), similar results are obtained.
Figure 3. Expression changes at a common, high-load SNP. Whisker plot
indicates dose-dependent expression in HapMap individuals of probeset
3707250 for all genotypes. Browser track shows the locations of
rs3764897 in PLD2, the alternative splice site affected and probeset
3707250.
Figure 4. Expression changes at a rare, high-load SNP. Whisker plot indi-
cates expression in HapMap individuals of probeset 3003113, which de-
tects an increase in expression in AG heterozygotes. Browser track shows
locations for rs924900 in ZNF713, probeset 3003113, and evidence of
exon skipping in GenBank Accession DA714504.
5. Population Fitness and Genetic Load of Single Nucleotide Polymorphisms Affecting mRNA splicing
5
Fitness and genetic load of HapMap subpopulations
3.4.1 Overall comparison of SNP loads in CEU and YRI popula-
tions. The effects of population specific selection were investi-
gated by analyzing differences between genetic loads for the same
SNP in different populations. The population allele frequencies of
the CEU and YRI subgroups in Phase II HapMap data were used to
compute population-specific genetic fitness and load values for
each SNP. The analysis was limited to these groups because the
corresponding exon microarray expression data were available for
these groups only. Genetic drift contributions should be negligible
because individual genotypes are sampled from large breeding
populations (Li 1955).
Figure 6. Genetic loads (L) of SNPs in natural splice sites for different
populations. Panels show densities of SNPs in CEU (left) vs. YRI (right)
groups sorted by minor allele frequency (MAF). Legends below each cor-
responding panel indicate graduated grayscale distributions of SNP densi-
ties, each thresholded by a range of counts
.
The overall patterns of SNP density within 9051 splice sites
across a range of genetic loads are similar between the groups,
especially for SNPs with MAF < 0.05. Nevertheless, 269 of these
SNPs are polymorphic only in CEU and 152 are polymorphic only
in the YRI group. Higher densities of common SNPs of moderate
load are apparent in the YRI population; for example, there are
increased number of SNPs with 0.08 <MAF< 0.16 at 0.22 <L<
0.35 and 0.25 < MAF <0.34 at 0.2 <L< 0.05.
Population-specific differences in frequencies of alleles can be
discerned by comparing the loads for the same SNP in each sub-
group, ∆L. Many SNPs have identical loads in both populations
(∆L=0; n=2715). Significant number of HapMap SNPs are either
absent in CEU and YRI (n=2076) or are have very low MAFs in
both of these populations (n=639).
Table 5. Population-specific differences in genetic load
Number of SNPs:
∆L≥ YRI > CEU CEU>YRI
0.4 1 4
0.3 23 32
0.25 57 60
0.2 127 124
0.15 274 262
0.1 604 613
0.01 2557 2756
As expected, the quantity of SNPs decreases with increasing ∆L
(Table 5). Larger values of ∆L presumably reflect bigger differ-
ences in the fitness landscapes between the populations. This me-
tric is constrained by species specific selection and the divergence
time since both groups shared a set of ancestral genotypes. Interes-
tingly, the numbers of SNPs which show load differences are near-
ly balanced in the different populations, which is consistent with a
fixed rate of frequency dependent selection of these SNPs in these-
respective populations since the migration of the CEU population
from the African continent.
3.4.2 Population specific differences in gene expression.
Patterns of gene expression were also surveyed in SNPs exhibit-
ing differences in genetic load due to frequency dependent selec-
tion. Dose-dependent, allele-specific changes in mRNA splicing
were found for minor alleles of 637 SNPs present at different fre-
quencies in CEU and in the YRI populations. Figures 7 and 8
show results for two such SNPs: rs10190751 which is more preva-
lent in YRI (∆L =∆p2= 0.25) and rs1018448, which is more com-
mon in CEU (∆L =∆p2= 0.36).
Information analysis of rs10190751 predicts ≥181 fold reduced
affinity for the A allele in the acceptor site of exon 8 of CFLAR.
Expression differences are significant for all genotypes (K-W χ2
=61, p<<0.001). Exon skipping due to decreased recognition of
this acceptor is common in both mRNA and EST sequences.
Figure 7. Expression changes at a high-load SNP present at high frequency
in Yorubans and lower frequency in Caucasians. Whisker plot indicates
expression in HapMap individuals of probeset 3707250 for all genotypes.
Browser track shows the locations of rs10190751 in CFLAR and probeset
2522648, which activates an alternative terminal exon in individuals con-
taining the G allele.
Figure 5. Distribution of mean fitness values of all SNPs affecting mRNA
splicing in 30 CEU (left) and 30 YRI (right) individuals. Whisker plots
indicate 𝑤
� for only homozygous genotypes.
6. Mucaki and Rogan
6
A C-A substitution due to rs1018448A at a acceptor site of exon 12
in the ARFGAP3 gene results in a 2.2 bit weaker binding site (≥ 4.6
fold, reducing inclusion of this exon in the mature mRNA, and
may lead to increased skipping of this exon.
4 DISCUSSION
To date, the common variants described by genomewide associa-
tion studies have had modest predictive power (generally, <10%).
For most diseases and traits, these variants explain only a small
fraction of heritability (Hirschorn 2009). Hundreds of risk alleles,
each with distinct locus associations, are needed to explain the
relative risks for complex genetic diseases (Kraft and Hunter
2009). Many rare alleles which contribute to these risks remain to
be discovered. The present study suggests that the human genome
contains numerous common and rare alleles with significant genet-
ic loads. Many of these predicted mutations demonstrate dose-
dependent, allele-specific effects on the exons adjacent to the
splice sites in which they are found. A significant number of SNPs
that alter mRNA splicing are under frequency-dependent selection
in different human populations. We also validate these findings
with corresponding gene expression data.
The proportion of mutations that are due to adaptive evolution
has been estimated for protein coding changes, however these es-
timates is generally biased downward by segregation of slightly
deleterious variants. To reduce this bias, low frequency polymor-
phisms have been removed (Charlesworth and Eyre-Walker 2008).
Caution must be exercised when eliminating rare splicing muta-
tions, where rare alleles are may not be slightly deleterious and can
significantly impact mRNA structure and protein coding.
Each HapMap individual carries higher load genotypes, most of
which are mild mutations with high 𝑊
� values. The multilocus
mean fitnesses based on all of these variants are underestimated by
equation (6). All individuals possess generally 5-15 low fitness
outlier genotypes with low values of 𝑊
� . Even if the SNPs with
high 𝑊
� values are eliminated, these outlier loci dramatically de-
press 𝑤
�𝑃𝑂𝑃𝑈𝐿𝐴𝑇𝐼𝑂𝑁 to unrealistically low levels. Accurate determi-
nation of multilocus mean fitness is challenging for a variety of
reasons. The combined deleterious effects of mutations in proteins
are subject to negative epistasis which are larger than expected
from the multiplication of their individual effects (Bershtein et al.,
2006). The unobserved geneology of ancestral recombination pat-
terns invalidate assumptions regarding the independence of indi-
vidual fitness scores (Griffiths and Marjoram 1996).
The majority of SNPs with L>>0 are unlikely to be recent muta-
tions. At least 30% these of SNPs are present in both CEU and
YRI populations with the same allele frequences. Only 7% of
these SNPs are found in neither population, consistent with pre-
vious worldwide surveys of unselected variants (Int HapMap Con-
sortium 2007) Further, a significant component (24%; L> 0.1) of
these SNPs affect splicing through population-specific, frequency
dependent selection. For these SNPs, the assumption of a common
genetic landscape may not be appropriate.
ACKNOWLEDGEMENTS
Funding: This research was undertaken thanks to support from the
Canada Research Chairs program, the Canadian Foundation for
Innovation, NSERC, and the University of Western Ontario.
REFERENCES
Adami C. (1998) Artificial Life. p. 347. Springer.
Adami C, Ofria C, Collier TC. (2000) Evolution of biological complexity. Proc Natl
Acad Sci U S A; 97(9):4463-8.
Bershtein S, Segal M, Bekerman R, et al. (2006) Robustness-epistasis link shapes the
fitness landscape of a randomly drifting protein Nature 444:929-932,
Charlesworth J and Eyre-Walker A (2008) The McDonald-Kreitman test and slightly
deleterious mutations. Mol Biol Evol 25: 1007-15.
Crow JF. and Kimura M. (1970) An introduction to population genetics theory, Harper
and Row.
Griffiths RC, Marjoram P. Ancestral inference from samples of DNA sequences with
recombination. (1996) J Comput Biol. 3(4):479-502.
International HapMap Consortium. 2007 A second generation human haplotype map of
over 3.1 million SNPs. Nature.449(7164):851-61.
Hirschorn JN. (2009) Genome-wide association studies--illuminating biologic path-
ways. N Engl J Med. 360(17):1699-701.
Huang RS, Duan S, Bleibel WK, et al. (2007) A genome-wide approach to identify
genetic variants that contribute to etoposide-induced cytotoxicity. Proc Natl Acad
Sci USA.; 104(23):9758-63.
Kimmel G, Karp RM, Jordan MI,and Halperin E. Association mapping and significance
estimation via the coalescent. (2008) Am. J. Hum. Genet. 83: 675-83.
Kodolitsch Yv. Berger J, Rogan PK. Predicting severity of haemophilia A and B
splicing mutations by information analysis. (2006) Haemophilia.12(3):258-62.
Kraft, P. and Hunter D.J. (2009) Genetic risk prediction: are we there yet? N Engl J
Med. 360(17):1701-1703.
Li CC. (1955) Population genetics. University of Chicago.
Maynard-Smith J. Natural Selection and the Concept of a Protein Space. Nature 225,
563-564
Nalla VK and Rogan PK. (2005) Automated Splicing Mutation Analysis by Informa-
tion Theory. Hum Mut; 25:334-342.
Rogan PK and Schneider TD (1995) Using information content and base frequencies to
distinguish mutations from genetic polymorphisms in splice junction recognition
sites. Hum Mutat. 6:74-76.
Rogan PK., Faux, B, and Schneider TD. (1998) Information analysis of human splice
site mutations Hum Mutat. 12(3): 153-171.
Rogan PK. Svojanovsky S, and Leeder J. (2003) Information theory-based analysis of
CYP219, CYP2D6 and CYP3A5 splicing mutations, Pharmacogenetics, 13(4):
207-218
Schneider TD. (1997) Information content of individual genetic sequences. J Theor
Biol.;189(4):427-41
Figure 8. Expression changes at a high-load SNP present at high frequency
in Caucasions and lower frequency in Yorubans. Whisker plot indicates
expression in HapMap individuals of probeset 3292628, which shows
graduated reduction in expression of this sequence with increasing copy
number of the A allele. Browser track shows the locations of rs1018448 in
exon 12 of ARFGAP3. GenBank Accession BX389234 lacks this exon.