💎VVIP Kolkata Call Girls Parganas🩱7001035870🩱Independent Girl ( Ac Rooms Avai...
Relation between income inequality and mortality
1. occur, leading to some 34 000 fewer deaths overall
within five years of diagnosis by the year 2010, of which
some 24 000 would be in people aged under 75. This
represents about a quarter of the government’s overall
target “to reduce the death rate from cancer in people
under 75 years by at least a fifth by 2010—saving up to
100 000 lives in total.”1
It is too early to assess the impact on national can-
cer survival rates of the reorganisation of cancer treat-
ment services under way since 1995 (the “Calman-
Hine process”9
), but if inequalities in cancer survival
were substantially reduced by this process, it would
have a major additional impact on avoided deaths. Sur-
vival rates for patients with cancer diagnosed in
England and Wales during 1986-90 and followed up to
the end of 1995 suggest that some 12 700 deaths
within five years of diagnosis would be avoided over
five years if there were no socioeconomic inequalities
in survival.3
Eliminating these inequalities would
greatly improve the chances of achieving the
government’s target of 100 000 fewer deaths in cancer
patients aged under 75 by 2010.
Contributors: MAR and MPC developed the initial idea for
estimating avoided deaths. PB and DS contributed substantially
to the study design and carried out all the analyses. All four
authors wrote the paper. MPC is the guarantor for the study.
Competing interests: None declared.
1 Department of Health. Saving lives: our healthier nation. London: DoH,
1999.
2 Office for National Statistics. Cancer 1971-1997 (CD Rom). London: ONS,
1999.
3 Coleman MP, Babb P, Damiecki P, Grosclaude P, Honjo S, Jones J, et al.
Cancer survival trends in England and Wales 1971-1995: deprivation and
NHS Region. London: Stationery Office, 1999. (Series SMPS No 61.)
4 Carstairs V, Morris R. Deprivation and health in Scotland. Aberdeen: Aber-
deen University Press, 1991.
5 Estève J, Benhamou E, Croasdale M, Raymond L. Relative survival and
the estimation of net survival: elements for further discussion. Stat Med
1990;9:529-38.
6 Beral V, Hermon C, Reeves G, Peto R. Sudden fall in breast cancer death
rates in England and Wales. Lancet 1995;345:1642-3.
7 Stockton D, Davies TW, Day NE, McCann J. Retrospective study of
reasons for improved survival in patients with breast cancer in East
Anglia: earlier diagnosis or better treatment? BMJ 1997;314:472-5.
8 Early Breast Cancer Trialists’ Collaborative Group. Polychemotherapy for
early breast cancer: an overview of the randomised trials. Lancet 1998;
352:930-42.
9 Expert Advisory Group on Cancer. A policy framework for commissioning
cancer services. London: Department of Health, 1995.
(Accepted 3 March 2000)
Relation between income inequality and mortality in
Canada and in the United States: cross sectional
assessment using census data and vital statistics
Nancy A Ross, Michael C Wolfson, James R Dunn, Jean-Marie Berthelot, George A Kaplan,
John W Lynch
Abstract
Objective To compare the relation between mortality
and income inequality in Canada with that in the
United States.
Design The degree of income inequality, defined as
the percentage of total household income received by
the less well off 50% of households, was calculated
and these measures were examined in relation to all
cause mortality, grouped by and adjusted for age.
Setting The 10 Canadian provinces, the 50 US states,
and 53 Canadian and 282 US metropolitan areas.
Results Canadian provinces and metropolitan areas
generally had both lower income inequality and lower
mortality than US states and metropolitan areas. In
age grouped regression models that combined
Canadian and US metropolitan areas, income
inequality was a significant explanatory variable for all
age groupings except for elderly people. The effect
was largest for working age populations, in which a
hypothetical 1% increase in the share of income to
the poorer half of households would reduce mortality
by 21 deaths per 100 000. Within Canada, however,
income inequality was not significantly associated with
mortality.
Conclusions Canada seems to counter the
increasingly noted association at the societal level
between income inequality and mortality. The lack of
a significant association between income inequality
and mortality in Canada may indicate that the effects
of income inequality on health are not automatic and
may be blunted by the different ways in which social
and economic resources are distributed in Canada
and in the United States.
Introduction
A large body of research reports an association
between income distribution and health1–14
and a range
of hypotheses articulates possible mechanisms operat-
What is already known on this topic
Survival is known to be improving for many (but not all) cancers in
England and Wales
There have been no previous estimates of the number of deaths
avoided as a result of improvements in cancer survival
What this study adds
Higher survival rates experienced by patients in England and Wales
with cancer diagnosed during 1986-90 (compared with those for
cancers diagnosed five years earlier) reduced excess mortality by 3%, or
about 17 000 fewer deaths within five years of diagnosis
If recent rates of improvement in cancer survival continue, there
should be some 24 000 fewer deaths in people aged under 75 by 2010,
representing about a quarter of the government’s target of 100 000
fewer cancer deaths in people under 75 by the year 2010
Papers
Statistics Canada,
Ottawa, ON,
Canada K1A 0T6
Nancy A Ross
research analyst,
health analysis and
modelling group
Michael C Wolfson
director general,
analysis and
development branch
Jean-Marie
Berthelot
manager, health
analysis and
modelling group
continued over
BMJ 2000;320:898–902
898 BMJ VOLUME 320 1 APRIL 2000 bmj.com
2. ing between income inequality and poor health
outcomes.15 16
Among American states, mortality is
more weakly correlated with mean or median state
income than it is with various measures of how that
income is shared within a state.5 6
US metropolitan
areas with greater income inequality also have
significantly higher mortality than metropolitan areas
with more equal income distributions, independent of
the median income of the metropolitan area.8
Collectively these studies point to the conclusion
that populations in areas where there is an unequal
income distribution have higher mortality than
populations in more homogeneous areas. While some
have claimed that the relation between income
inequality and mortality is an artefact of the non-linear
relation between income and mortality at the
individual level,17
Wolfson and colleagues18
and others
reporting findings from multilevel analyses19–22
provide
substantial evidence for a non-artefactual explanation.
We compared income inequality and age grouped
mortality in Canada and the United States. We consid-
ered two levels of geographic aggregation: state/
provincial and metropolitan area. The comparison of
states/provinces and US metropolitan areas is compel-
ling in that it has the potential to highlight characteris-
tics and policies specific to particular social contexts
that could affect health. While the product of similar
economic, social, and cultural forces,23
Canada and the
United States also have some major differences,
especially with regard to social policy and racial
divisions. US metropolitan areas differ greatly from
Canadian metropolitan areas in terms of the degree of
economic and social inequality they generate and the
ways in which unequal material circumstances and
social relations are institutionalised through policy and
urban political structure.24 25
While economic segrega-
tion and social polarisation are less pronounced in
Canadian cities, some studies have suggested that they
increased in the last decade of the 20th century.26 27
Incomes at the bottom of the distribution are
higher in Canada than in the United States, and while
inequality in net income rose between 1985 and 1995
in the United States it actually fell slightly in Canada
because of the redistributive effects of Canadian
taxation and transfer policies.28
Furthermore, since the
1980s, pay inequality in Canada has widened much less
than in the United States.28 29
In the United States,
labour market prospects for low skilled workers have
been poor over the past two decades. Hypotheses such
as the growing skill requirements of a global economy,
deindustrialisation, relocations of employers to subur-
ban areas, and racial discrimination have been offered
to explain these trends.30
Methods
Associations between income inequality and mortality
were studied in the 50 US states and the 10 Canadian
provinces, as well as in 282 US and 53 Canadian met-
ropolitan areas with populations greater than 50 000
(as of 1990 in the United States and 1991 in Canada).
All mortalities were age standardised to the Canadian
population in 1991. The associations were examined
separately by the following age and sex groupings for
the states and provinces: infants (less than 1 year), chil-
dren and youth (1 to 24 years), working age men (25 to
64 years), working age women (25 to 64 years), elderly
men (65 years and older), and elderly women (65 years
and older). Age groupings were the same for
metropolitan areas but breakdowns by sex were
unavailable.
Inequality was operationalised as the proportion
of total household income accruing to the less well off
50% of households within an area (that is, the “median
share” of income). In a setting of perfect equality, the
bottom half of the income distribution receives 50% of
the total income and the area then has a median share
value of 0.50. The indicator has recently been used in
similar studies on inequality and mortality,5 8
and thus
allowed for comparability of results. Moreover, tests
with a range of other measures of inequality and
polarisation suggested that this choice did not
substantially affect the results.
US data
Mortality data for the 50 US states came from the
Centers for Disease Control (CDC) Wonder website.
Mortalities by state, sex, and age were averaged over
three years (1989-91) to improve the stability of the
estimates. State median share proportions and the
median income values were generated from the 1990
US census and have appeared in a previous paper by
Kaplan and colleagues.5
Metropolitan area mortalities
and median share proportions were from the work of
Lynch and colleagues.8
Canadian data
The income inequality data for Canada came from a
micro data file of the 1991 census of Canada. The
income definition used in the Canadian calculations,
like that for the United States, included income from
wages and salaries, net income from self employment,
government transfers, and investment income. Cana-
dian mortality data were based on three year averages
(1990-2) by province, sex and age group, and by
metropolitan area and age group.
Model building and general linear testing
Multiple regression analyses were conducted only on
the metropolitan area data because of the small number
of Canadian provinces. Given that the reliability of the
estimated mortality is related to the populations of
metropolitan areas we used weighted regression with
population size as the weight. Use of these weights
ensures that the regression line goes through the mean
mortality of the entire population under study. Further-
more, the use of such a weighted regression allows for
the unobserved differences in mortality between
Canada and the United States, potentially because of
differences in social structure, to be taken into account
through the use of a dummy variable.31
The regression analyses proceeded in four steps.
Firstly, models specific for age group were fitted for the
282 US metropolitan areas with median share of total
metropolitan area household income as an explana-
tory variable. Secondly, median income for the US
metropolitan areas was added as an explanatory
variable. Thirdly, the 53 Canadian metropolitan areas
were added. In the combined models, metropolitan
median household income for the Canadian cities was
adjusted downwards by a factor of 0.8 (this is Statistics
Canada’s purchasing power parity rate, applied to
Papers
Centre for Health
Services and Policy
Research,
Department of
Health Care and
Epidemiology,
University of British
Columbia,
Vancouver, BC,
Canada V6T 1Z3
James R Dunn
research associate
School of Public
Health, University
of Michigan, Ann
Arbor, MI
48109-2029, USA
George A Kaplan
professor and chair
John W Lynch
assistant professor
Correspondence to:
N Ross
rossnan@statcan.ca
899
BMJ VOLUME 320 1 APRIL 2000 bmj.com
3. personal final expenditure, for 199523
) to achieve
purchasing power parity between the two countries.
We also included a dummy variable to indicate whether
the metropolitan area was Canadian or American to
adjust for the mortality differentials between the two
countries.32
Finally, we tested whether the relation
between income inequality and mortality in Canada
differed significantly from the US relation and whether
the coefficients for median share for Canada differed
significantly from zero. The approach involved specify-
ing full models, including all two way interactions, and
then specifying reduced models with the effect of inter-
est removed (the multicollinearity present in the fully
fitted models made it difficult to assess the slope differ-
ences; the approach comparing the error sum of
squares of the full and reduced models circumvents the
problem). The test statistic entailed a comparison of
the error sum of squares of each model and followed
an F distribution.33
Results
States and provinces
The median share values ranged from 0.17 (least
equal) in Louisiana to 0.23 (most equal) in New
Hampshire for the US states, while the range for the
Canadian provinces was 0.22 (least equal) for
Saskatchewan to 0.24 (most equal) for Prince Edward
Island. The median proportion of income received by
the less well off half was 0.21 for US states, while for
Canadian provinces it was 0.23. There was little overlap
between US states and Canadian provinces in regard
to income inequality with only Wisconsin, Vermont,
Utah, and New Hampshire sharing similar income dis-
tributions to the Canadian provinces.
Median share of income was correlated (P < 0.01)
with infants (r = m-0.69), children/youth (r = − 0.62),
working age men (r = − 0.81), working age women
(r = − 0.81), elderly men (r = − 0.44), elderly women
(r = − 0.42), and all age (r = − 0.68) mortality in
combined US states and Canadian provinces calcula-
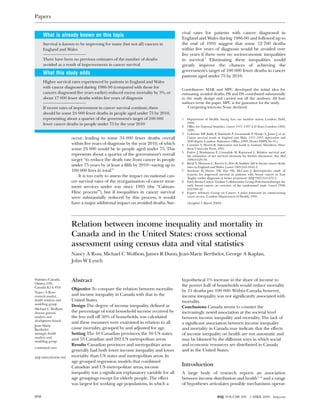
tions. Figure 1 shows a weighted linear fit (the areas of
the circles are proportional to the population size)
between income inequality and mortality for working
age men at the state/provincial levels. The strongest
relation with inequality was for working age popula-
tions. The Canadian provinces seem almost like a more
equitable extension of the US data, by having lower
mortality and lower inequality. Within Canada,
however, the slope of the weighted regression line was
in the expected direction but was not significantly
different from zero.
Metropolitan areas
The populations of the 282 metropolitan areas in the
United States ranged from 56 735 (Enid, Oklahoma) to
18 087 251 (New York city) with a median size of
242 847. The populations of the 53 metropolitan areas
in Canada ranged from 50 193 (Saint-Hyacinthe, Que-
bec) to 3 893 046 (Toronto, Ontario) with a median
size of 116 100. The median share values ranged from
0.15 (least equal) in Bryan, Texas, to 0.25 (most equal)
in Jacksonville, North Carolina, for the United States
while the range in Canada was 0.22 (least equal) for
Montreal, Quebec, to 0.26 (most equal) for Barrie,
Ontario. The median proportion of income received
by the less well off half of households for US
metropolitan areas was 0.21 while for the Canadian
metropolitan areas it was 0.23.
There were significant correlations (P < 0.01)
between median share and mortality for infants
(r = − 0.37), children and youth (r = − 0.38), the
working age population (r = − 0.55), the elderly popu-
lation (r = − 0.25), and all ages combined (r = − 0.43)
for the pooled 335 metropolitan areas in the United
States and Canada. Within Canada, however, there was
no statistical relation between inequality and mortality
at the metropolitan area level as evidenced by the
weighted linear fit (dashed line) to the Canadian data
points for working age mortality in figure 2.
In the first set of multiple regression models, the
median share was a significant explanatory variable for
all but the model of mortality in elderly people for the
282 US metropolitan areas (table). The largest effect
was in mortality in working age people, where a 1%
increase in the share of household income to the
poorer half of the income distribution was associated
with a decline in mortality of nearly 22 deaths per
100 000. In general, the size of the effect of the median
share variable changed little with the addition of the
median state income variable, the second set of regres-
sions. The inclusion of the 53 Canadian metropolitan
areas, the third set of regressions, improved the
explanatory significance of the models with, for exam-
ple, the adjusted R2
(squared multiple correction)
increasing from 0.02 to 0.27 for infants and from 0.33
to 0.51 for the working age population. The country
dummy variable was significant in each of the models
and may be interpreted as the difference in mortality
between the two countries after adjustment for the dis-
tribution of household income and median household
income. Thus there were 91 fewer deaths per 100 000
in Canadian metropolitan areas than in US metropoli-
tan areas after adjustment for median share and
median income.
Median share of income
Rate
per
100
000
population
0.18 0.20 0.22 0.24
300
550
675
MS
AL
SC
FL
MN
BC
SK
QC
MB
NH
NS
NB
ND
PE
ON
AB
CA
TX
LA
800
US states with weighted linear fit (from Kaplan et al, 19955)
Canadian provinces with weighted linear fit (slope not significant)
425
Fig 1 Mortality in working age men by proportion of income belonging to the less well off
half of households, US states (1990) and Canadian provinces (1991). Mortality standardised
to Canadian population in 1991. State abbreviations: LA-Louisiana; MS-Mississippi;
AL-Alabama; SC-South Carolina; FL-Florida; TX-Texas; CA-California; AR-Arkansas; NH-New
Hampshire; MN-Minnesota. Province abbreviations: QC-Quebec; NS-Nova Scotia; NB-New
Brunswick; ND-Newfoundland; PE-Prince Edward Island; ON-Ontario; AB-Alberta; BC-British
Columbia; MB-Manitoba; SK-Saskatchewan
Papers
900 BMJ VOLUME 320 1 APRIL 2000 bmj.com
4. Finally, the general linear testing indicated that the
slope of the relation between median share and
mortality for Canadian metropolitan areas was signifi-
cantly different than the US slope for children and
youth (F1,329 = 5.98, P < 0.05), working age populations
(F1,329 = 8.79, P < 0.01), and all age groups combined
(F1,329 = 6.22, P < 0.05). In all cases, however, after the
three main effects variables (median share, median
income, and the dummy country indicator) and all two
way interactions in the Canada and US models were
accounted for, the slope of the relation between
median share and mortality in Canada was not signifi-
cantly different from zero.
Discussion
Our analysis of data from Canada and the United
States has shown that variations in the equality of the
income distribution are associated with mortality. The
relation was strongest for working age populations but
was much weaker in elderly populations. Other
research has suggested that differential working age
mortality across populations may be a more powerful
measure of relative disadvantage than the traditionally
studied infant mortality differential.20 34 35
As for the
attenuation seen in elderly populations, current house-
hold income may not be a useful measure for this
group given that income levels before retirement or
measures of wealth better reflect their social position.36
There were no significant asociations between
income inequality and mortality in Canada at either
the provincial or metropolitan area levels, whereas
such associations were apparent in the United States.
The absence of an effect within Canada may indicate
that the relation between income inequality and
mortality is non-linear (that is, at higher levels of equal-
ity there is a diminishing effect on health) or that the
relation between income inequality and mortality is
not universal but instead depends on social and politi-
cal characteristics specific to place. The first explana-
tion suggests that reducing income inequality would be
beneficial for population health. The latter explanation
suggests that specific policies can be implemented to
buffer the health effects of income inequality.15
The juxtaposition of Canadian and US policies in
these analyses raises questions about differences in the
social and material conditions of the two countries that
mute (in Canada) and exaggerate (in the United States)
the relation of inequality to mortality. One plausible
difference is the greater degree of economic segrega-
tion in large US cities.20
Such segregation can create a
spatial mismatch between workers and jobs and large
inequalities in provision of public goods and services
(for example, schools, transportation, health care,
policing, housing, etc) because of concentrations of
people with high social needs in municipalities with
low tax bases.37
The population health effects of
inequalities in provision of these public goods and
others like parks, libraries, and recreation facilities
need to be the focus of future research.15 38
Another major difference between the two
countries is the way in which resources such as health
care and high quality education are distributed. In the
United States these resources tend to be distributed by
the marketplace so their utilisation tends to be associ-
ated with ability to pay; in Canada they are publicly
funded and universally available. As a consequence, in
the United States an individual’s income, in both a
relative and absolute sense, is a much stronger
determinant of life chances and, in turn, “health
chances” than in Canada.
These comments underscore the point that
observations of contexts in which income inequality
has health consequences and those in which it does not
provide opportunities to examine the role of variations
in economic and social policy which structure the
availability of resources and demands placed on
individuals. Collectively, these resources and demands
Median share of income
Rate
per
100
000
population
0.15 0.19 0.23 0.27
200
400
500
600
Florence, SC
Augusta, GA
Pine Bluff, AR
New Orleans, LA
US cities (n=282) with weighted linear fit (from Lynch et al, 19988)
Canadian cities (n=53) with weighted linear fit (slope not significant)
300
New York, NY
Monroe, LA
Bryan, TX
Mcallen, TX
Los Angeles, CA
Shawinigan, QC
Shawinigan, QC
Shawinigan, QC
Montreal, QC
Vancouver, BC
Toronto, ON
Appleton, WI
Oshawa, ON
Barrie, ON
Sioux City, IA
Portsmouth, NH
Fig 2 Mortality in all working age people by proportion of income belonging to the less well off
half of households, US (1990) and Canadian metropolitan areas (1991). Mortality standardised
to Canadian population in 1991. State abbreviations: LA-Louisiana; GA-Georgia; AR-Arkansas;
SC-South Carolina; NY-New York; TX-Texas; CA-California; IA-Iowa; NH-New Hampshire;
WI-Wisconsin. Province abbreviations: QC-Quebec; ON-Ontario; BC-British Columbia
Metropolitan area regression results for US only models (n=282) and combined Canada
and US models (n=335)
Age group and model Intercept
Median share
(%)
Median income
(USr1000)
Country
dummy
Adjusted
R2
*
Infants
US only 1341† −19.73† — — 0.03
US only with income 1386† −19.35† −1.6 — 0.02
US-Canada with dummy 1358† −18.18† −1.5 −280† 0.27
Child/youth
US only 110† −2.49† — — 0.11
US only with income 116† −2.43† −0.20† — 0.11
US-Canada with dummy 113† −2.26† −0.30† −18† 0.35
Working age
US only 848† −21.71† — — 0.33
US only with income 838† −21.80† 0.40 — 0.34
US-Canada with dummy 826† −20.92† 0.20 −67† 0.51
Elderly
US only 5255† −20.58 — — 0.01
US only with income 5547† −18.03 −10.50† — 0.03
US-Canada with dummy 5490† −14.16 −11.20† −399† 0.16
All ages
US only 1110† −15.09† — — 0.13
US only with income 1141† −14.82† −1.10 — 0.12
US-Canada with dummy 1127† −13.84† −1.30† −91† 0.34
*Squared multiple correction.
†P<0.05.
Papers
901
BMJ VOLUME 320 1 APRIL 2000 bmj.com
5. modify the day to day experiences of individuals
thereby creating different patterns of health and
disease in different places.
Contributors: NAR performed the analyses and wrote most of
the paper. MCW had the original idea for the research and
helped to write the paper. JRD developed some of the concep-
tual arguments around the differences between Canada and the
United States and participated in the writing of the paper. J-MB
provided statistical expertise and helped to write the paper.
GAK and JWL inspired the analysis and participated in the
design and writing of the final version of the paper. NAR and
MCW are guarantors.
Funding: Statistics Canada, Canadian Population Health
Initiative, Social Sciences and Humanities Research Council of
Canada (postdoctoral fellowship No 756-98-0194), University of
Michigan Initiative on Inequalities in Health.
Competing interests: None declared.
1 Ben-Shlomo Y, White IR, Marmot M. Does the variation in the socioeco-
nomic characteristics of an area affect mortality? BMJ 1996;312:1013-4.
2 Davey Smith G, Egger M. Commentary: understanding it all—health,
meta-theories, and mortality trends. BMJ 1996;313:1584-5.
3 Fiscella K, Franks P. Poverty or income inequality as predictors of
mortality: longitudinal cohort study. BMJ 1997;314:1724-8.
4 Flegg A. Inequality of income, illiteracy, and medical care as determinants
of infant mortality in developing countries. Popul Stud 1982;36:441-58.
5 Kaplan GA, Pamuk E, Lynch JW, Cohen RD, Balfour JL. Income inequal-
ity and mortality in the United States: analysis of mortality and potential
pathways. BMJ 1996;312:999-1003.
6 Kennedy BP, Kawachi, Prothrow-Stith D. Income distribution and
mortality: cross sectional ecological study of the Robin Hood index in the
United States. BMJ 1996;312:1004-7.
7 Le Grand J. Inequalities in health: some international comparisons. Eur
Econ Rev 1987;31:182-91.
8 Lynch JW, Kaplan GA, Pamuk ER, Cohen RD, Heck KE, Balfour JL, et al.
Income inequality and mortality in metropolitan areas of the United
States. Am J Public Health 1998;1074-80.
9 Rodgers GB. Income and inequality as determinants of mortality: an
international cross-section analysis. Popul Stud 1979;33:343-51.
10 Waldmann RJ. Income distribution and infant mortality. Q J Econ
1992;107:1283-302.
11 Wennemo I. Infant mortality, public policy and inequality—a comparison of
18 industrialised countries 1950-85. Sociol Health Illness 1993;15:429-46.
12 Wilkinson RG. Income and mortality. In: Wilkinson RG, ed. Class and
health: research and longitudinal data. London: Tavistock, 1986.
13 Wilkinson RG. Income distribution and life expectancy. BMJ
1992;304:165-8.
14 Wilson M, Daly M. Life expectancy, economic inequality, homicide, and
reproductive timing in Chicago neighbourhoods. BMJ 1997;314:1271-4.
15 Lynch JW, Davey Smith G, Kaplan GA, House J. Income inequality and
health: a neo-material interpretation. BMJ (in press).
16 Wilkinson RG. Unhealthy societies: the afflictions of inequality. London:
Routledge, 1996.
17 Gravelle H. How much of the relation between population mortality and
unequal distribution of income is a statistical artefact? BMJ
1998;316:382-5.
18 Wolfson MC Kaplan G, Lynch J, Ross NA, Backlund E. The relationship
between income inequality and mortality is not a statistical artefact: an
empirical assessment. BMJ 1999;319:953-7.
19 Daly M, Duncan G, Kaplan GA, Lynch JW. Macro-to-micro linkages in the
inequality-mortality relationship. Milbank Mem Fund Q 1998;76:315-39.
20 Waitzman NJ, Smith KR. Separate but lethal: the effects of economic seg-
regation on mortality in metropolitan America. Milbank Mem Fund Q
1998;76:341-73.
21 Kennedy BP, Kawachi I, Glass R, Prothrow-Stith D. Income distribution,
socioeconomic status, and self rated health in the United States:
multilevel analysis. BMJ 1998;317:917-21.
22 Soobader M-J, LeClere FB. Aggregation and the measurement of income
inequality: effects on morbidity. Soc Sci Med 1999;48:733-44.
23 Yeates, M. The North American city. 4th ed. New York: Harper and Row,
1990.
24 Goldberg M, Mercer J. The myth of the North American city. Vancouver: Uni-
versity of British Columbia Press, 1986.
25 Badcock B. Unfairly structured cities. Oxford: Basil Blackwell, 1984.
26 Bourne LS. Social inequalities, polarization, and the redistribution of
income within cities: a Canadian example. In: Badcock BA, Browett MH,
eds. Developing small area indicators for policy research in Australia. Adelaide:
National Key Centre for Social Applications of Geographical
Information Systems, University of Adelaide, 1997.
27 Murdie RA. The welfare state, economic restructuring, and immigrant
flows: impacts on socio-spatial segregation in urban Toronto. In: Musterd
S, Ostendorf W, eds. Urban segregation and the welfare state. New York:
Routledge, 1998:64-93.
28 Wolfson MC, Murphy BB. New view on inequality trends in Canada and
the United States. Monthly Labor Rev 1998;April:3-23.
29 Murphy KM, Riddell WC, Romer P.Wages,skills and technology in the United
States and Canada. Cambridge, MA: National Bureau of Economic
Research (NBER), 1998 (working paper No 6638).
30 Holzer H. What employers want. New York, NY: Russell Sage Foundation,
1996.
31 O’Connell JM. The relationship between health expenditures and the age
structure of the population in OECD countries. Health Econ
1996;5:573-8.
32 Statistics Canada. Report on the demographic situation in Canada 1997.
Ottawa, ON: Minister of Industry, 1998.
33 Neter J, Wasserman, W, Kutner MH. Applied linear statistical models:
regression, analysis of variance, and experimental designs. 3rd ed. Boston, MA:
Irwin, 1990.
34 Guest AM, Almgren G, Hussey JM. The ecology of race and
socioeconomic distress: infant and working-age mortality in Chicago.
Demography 1998;35:23-34.
35 Marmot MG, Fuhrer R, Ettner SL, Marks NF, Bumpas LL, Ryfe CD. Con-
tribution of psychosocial factors to socioeconomic differences in health.
Milbank Q 1998;76:403-48.
36 Wolfson MC, Rowe G, Gentleman JF, Tomiak M. Career earnings and
death: a longitudinal analysis of older Canadian men. J Gerontol
1993;48:S167-79.
37 Orfield M. Metropolitics: a regional agenda for community and stability. Wash-
ington, DC: Brookings Institution Press and the Lincoln Institute of Land
Policy, 1997.
38 Lynch JW, Kaplan GA. Understanding how inequality in the distribution
of income affects health. J Health Psychol 1997;2:297-314.
(Accepted 20 January 2000)
What is already known on this topic
Income inequality has been shown to be associated with mortality when
countries, US states, and US metropolitan areas have been compared
What this study adds
Data from Canada have been added to the research on the relation
between income inequality and mortality, thus providing a more
complete picture for North America
Income inequality is strongly associated with mortality in the United
States and in North America as a whole, but there is no relation within
Canada at either the province or metropolitan area level
Overall, the comparison between Canada and the United States
suggests that policies directed toward evening out the income
distribution may reduce the effects of inequality on health
A useful radiology report
Like all specialists, I was taught never to trust an x ray report.
There are times when a specialist report is invaluable.
I was asked to see an elderly patient on a medical ward. The
patient clearly had marked impairment of cognitive and memory
functions. But how long was the history? The only child was away;
the GP had not had much contact. The usual psychodetective
work of searching for clues began.
I looked through the medical notes: a radiology report of
unusual length, with some normal, and in this context, some
unimportant findings. Then a second paragraph: “Mr X had a
rather fraught time leaving the hospital escorted by radiologist as
he could not remember who had given him a lift, in what car and
at which entrance he had been deposited. It took an hour and a
half before his lift could be located during which time he walked
further than I think was good for him.”
This was dated some 18 months before my visit. So the history
of memory problems was at least that long.
Unfortunately, this aspect of the report did not lead to any
action by the requesting doctor.
I thank Dr C P Robinson for the helpful report.
Adam Moliver consultant in old age psychiatry, Cheltenham
Papers
902 BMJ VOLUME 320 1 APRIL 2000 bmj.com