1. The main objectives of this study are:
1) To identify and quantify all recognizable atmospheric organic
aerosols from East St. Louis samples
2) To conduct a positive matrix factorization (PMF) analysis to
determine the number of factors involved in creation of the
atmospheric organic aerosols in East St. Louis
3) To use the identification and PMF results to find the sources of each
factor
Identification and Quantification of Atmospheric Organic Aerosol in East St. Louis as Determined by
Hourly Measurements of Source Marker Compounds
Taylor Smith, Michael Walker, Brent Williams
Department of Chemical Engineering, 1 Brookings Drive, Washington University in St. Louis, MO, 63112
Introduction
Objectives
Compound Identification and Quantification
Method
References
Results
Zero air
Sampling
Inlet
Std Injection
Cyclone
RH
Humidifier
Bypass
Q
Vacuum
ΔP CTD
Cell
Vent
Purge He
6-Port
Valve
He
Positive Matrix Factorization (PMF)
Method
Results
Organic aerosol (OA) constitutes a
significant fraction of submicron
atmospheric aerosol, and are
comprised of tens of thousands of
different organic compounds. These
compounds have detrimental effects
on: • Human health
• Visibility
• Climate forcing
• Ecosystems
Between Piggot Avenue and Tudor Avenue
on South 13th Street in East St. Louis (as
seen in above map), 221 outdoor air
samples were taken during the St. Louis Air
Quality Regional Study (SLAQRS) in August
and September of 2015. Samples were
identified and quantified using the Thermal
Desorption Aerosol GC/MS (TAG). These
samples were analyzed to determine the
number of factors contributing to the
production of OA. Once factors were
determined, the sources could be
hypothesized.
Samples collected
Compounds Identified
Compounds Quantified
PMF Analysis
Sources Identification
400
300
200
100
x10
3
300025002000150010005000
Signal
Retention Time (secs)
Future Work
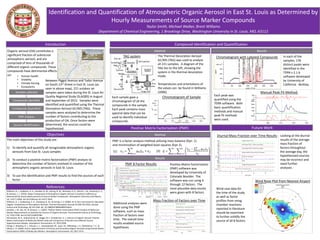
The Thermal Desorption Aerosol
GC/MS (TAG) was used to analyze
all 221 samples. A diagram of the
TAG lies to the left, showing the
system in the thermal desorption
mode.
Temperatures and orientations of
the valves can be found in Williams
(2006).
Each sample gave a
chromatogram of all the
compounds in the sample.
Each peak contains mass
spectral data that can be
used to identify individual
compounds.
In each of the
samples, 178
distinct peaks were
identified in the
TERN v 2.1.6
software developed
by University of
California - Berkley.
Each peak was
quantified using the
TERN software. Both
basic quantification
methods and manual
peak fit methods
were used.
TAG system
Chromatogram of Sample
Chromatogram with Labeled Compounds
Manual Peak Fit Method
PMF is a factor analysis method utilizing mass balance (Eqn. 1)
and minimization of weighted least squares (Eqn 2).
𝑥𝑖𝑗 =
𝑘=1
𝑝
𝑔𝑖𝑘 𝑓𝑘𝑗 + 𝑒𝑖𝑗(1) (2) 𝑄 =
𝑖=1
𝑛
𝑗=1
𝑚 𝑥𝑖𝑗 − 𝑘=1
𝑝
𝑔𝑖𝑘 𝑓𝑘𝑗
𝑠𝑖𝑗
PMF 8 Factor Results
Mass Fraction of Factors over Time
Positive Matrix Factorization
(PMF) software was
developed by University of
Colorado Boulder. The
software was run using 4
through 12 factors. The
most plausible data results
were given with 8 factors.
Additional analyses were
done using the PMF
software, such as mass
fraction of factors over
time. The overall time
results enabled source
hypotheses.
Looking at the diurnal
results of the average
mass fraction of
factors throughout
the average day, the
hypothesized sources
may be incorrect and
need further
analyses.
Wind rose data for
the time of the study
as well as factor
profiles from smog
chamber reactions
reported in literature
should be examined
to further solidify the
source of all 8 factors.
Diurnal Mass Fraction over Time Results
Wind Rose Plot from Nearest Airport
Williams, B. J., Goldstein, A. H., Kreisber, N. M., Hering, N. M., Worshop, D. R., Ulbrich, I. M., Docherty, K. S.,
& Jimenez, J. L. (2010). Major Components of Atmospheric Organic Aerosol in Southern California as
Determined by Hourly Measurements of Source Marker Compounds. Atmospheric Chemistry and Physics,
10, 11577-11603. doi:10.5194/acp-10-11577-2010
Williams, B. J., Goldsteing, A. H., Kreisberg, N. M., & Hering, S. V. (2006). An In-Situ Instrument for Speciated
Organic Composition of Atmospheric Aerosols: Thermal Desorption Aerosol GC/MS-FID (TAG). Aerosol
Science and Technology, 40, 627-638. doi: 10.1080/02786820600754631
Jaeckels, J. M., Bai, M., & Schauer, J. J. (2007). Positive Matrix Factorization (PMF) Analysis of Molecular
Marker Measurements to Quantify the Sources of Organic Aerosols. Environmental Science & Technology,
41, 5763-5769. doi:10.1021/es062536b
Shrivastava, M. K., Subramanian, R., Rogge, W. F., & Robinson, A. L. Sources of Organic Aerosol: Positive
Matrix Factorization of Molecular Marker Data and Comparison of Results from Different Source
Apportionment Models. Atmospheric Environment, 41, 9353-9369.
Zhang, Y., Sheesley, R. J., Schauer, J. J., Lewandowski, M., Jaoui, M., Offenberg, J. H., Dleindienst, T. E., &
Edney, E. O. (2009). Source Apportionment of Primary and Secondary Organic Aerosols using Positive Matrix
Factorizations (PMF) of Molecular Markers. Atmospheric Environment, 43, 5567-5574.
Regional primary anthropogenic factor
Regional primary anthropogenic factor
Regional primary anthropogenic factor
Denuder