SlideShare a Scribd company logo
1 of 8
Download to read offline
P.O. Box 26893
Manama, Bahrain
Telephone: +973 17 533570
tarek.fadlallah@bh.nomura.com
1
Monday 20th
June, 2005
-50%
0%
50%
100%
150%
200%
250%
300%
350%
400%
450%
Jan-02 May-02 Sep-02 Jan-03 May-03 Sep-03 Jan-04 May-04 Sep-04 Jan-05 May-05 Sep-05 Jan-06 May-06 Sep-06
Nasdaq Saudi UAE Oil
November 1998
March 2000
-58%
-78%
The Great Arabian Bubble
Red Alert
There are some exciting and hugely encouraging ongoing developments within the GCC that augur well
for the long term economic development of the region.
Aided and abetted in no small measure by buoyant oil prices, soaring property values and a boom in
tourism the region is also benefiting from sweeping economic reforms and business deregulation.
Despite these positive developments however it is getting increasingly difficult to justify the rapid rise in
stock prices across the regional bourses particularly given the deterioration in valuations.
The chart below shows the Saudi Tadawul Index, UAE General Index and WTI oil since January 2002.
For comparison the NASDAQ index from November 1996 to November 2001 has been superimposed.
NASDAQ appeared overvalued as early as November 1998 but investors who sold their shares at that
point must have felt like fools as the market doubled over the next fifteen months.
However they were eventually vindicated after the index declined -78% from its subsequent highs and
more than halved from its November 1998 levels!
P.O. Box 26893
Manama, Bahrain
Telephone: +973 17 533570
tarek.fadlallah@bh.nomura.com
2
Monday 20th
June, 2005
Sign of the Times
The sight of university students flaunting shimmering new sports cars at the local shopping mall may not
be unusual but the fact that these are being self-financed by stock market profits ought to be raising alarm.
Such images are reminiscent of New York taxi drivers throwing away their keys to become NASDAQ day
traders or Japanese housewives funding luxury lifestyles through real estate speculation in the 1980s.
Stock Market Performance:
(as at 19th June) Saudi Arabia UAE Kuwait Qatar Oman MSCI-World
2005 (YTD) 69.8% 111.8% 33.7% 56.4% 63.1% 0.1%
2004 84.9% 88.4% 33.8% 64.5% 23.8% 13.4%
2003 76.2% 32.1% 101.7% 69.9% 42.1% 32.1%
Source: Bloomberg
While no two bubbles are identical they tend to share common characteristics some of which are becoming
evident across the GCC markets particularly in Saudi Arabia and the UAE.
One principle characteristic is that participants and vested interests discard universal valuation benchmarks
to validate the higher prices on the basis of some new paradigm.
Stock market gains today are said to be durable because they rest on a sound economic basis revolving
upon economic reform, a structural rise in oil prices, a boom in real estate and increased regional liquidity.
But it is instructive to note that every bubble in history including the one preceding the Great Crash has
been rooted in sound fundamentals only to spiral out of proportion through excessive speculation.
• In the 1980s the bubble in Japan was sustained by rising asset prices, low interest rates, soaring
exports and an appreciating currency – but prices ran too far and valuations deteriorated.
• In the 1990s the bubble in internet stocks was based on a genuine revolution in technology that
has radically changed our world – but prices ran too far and valuations deteriorated.
Another characteristic evident across the GCC is that corporate profits become highly leveraged into the
rising trend in asset prices – property and stocks – that develops into a virtuous circle feeding upon itself.
A third major characteristic is that retail investors (often borrowing heavily) embrace risk without concern
and plunge wholeheartedly into stocks for fear of being excluded from the enriching party.
Although investors would like to believe that their markets are unique and that this particular situation is
different the likelihood is that the GCC markets are destined to play by the universal rules that govern
markets from Toronto to Tokyo and Timbuktu.
A case can made for a correction in all GCC markets but this note will focus on the Saudi Arabian market
due to its scale, extraordinary valuations and its potential impact on neighbouring states.
P.O. Box 26893
Manama, Bahrain
Telephone: +973 17 533570
tarek.fadlallah@bh.nomura.com
3
Monday 20th
June, 2005
The Valuations
The following list of thirty large stocks in Saudi Arabia offers the clearest indication of the regional
overvaluation with an unweighted Price Earnings Ratio (PER) of 50.4x profits for 2004.
COMPANY PRICE PER PBR YIELD MARKET CAP MARKET CAP
(data as at 18th June, 2005) (SAR) (x) (x) (%) (SAR mn) ($ mn)
SAUDI BASIC INDUSTRIES CORP 1124.0 31.6 11.2 0.80% 449,602 119,894
SAUDI TELECOM CO 940.0 30.3 9.1 2.77% 282,000 75,200
AL-RAJHI BANKING & INVST CRP 1627.0 49.9 20.2 1.11% 146,430 39,048
SAMBA FINANCIAL GROUP 914.0 43.8 11.6 1.53% 109,680 29,248
SAUDI ELECTRICITY CO 128.5 72.9 2.4 2.72% 107,081 28,555
RIYAD BANK 840.0 41.9 9.3 1.71% 84,000 22,400
ETIHAD ETISALAT CO 690.0 - - - 69,000 18,400
SAUDI BRITISH BANK 1306.8 39.9 12.1 1.45% 65,338 17,423
BANQUE SAUDI FRANSI 1275.8 37.4 10.4 1.57% 57,409 15,309
ARAB NATIONAL BANK 938.0 40.2 9.8 0.83% 46,900 12,507
SAVOLA 1575.0 78.4 21.3 0.57% 39,375 10,500
SAFCO 859.0 52.1 8.8 0.93% 34,360 9,163
SAUDI INVESTMENT BANK 889.0 52.1 8.7 0.27% 30,559 8,149
SAUDI HOLLANDI BANK 928.0 31.5 8.1 1.62% 23,386 6,236
MAKKAH CONS 781.0 - - - 22,620 6,032
SOUTHERN PROVINCE CEMENT 857.0 33.0 9.5 2.92% 17,997 4,799
YANBU CEMENT 791.0 38.8 8.2 2.53% 16,611 4,430
SAUDI CEMENT 784.0 36.6 8.2 2.17% 15,994 4,265
NATIONAL SHIPPING/SAUDI 330.5 30.9 6.2 1.51% 13,220 3,525
BANK AL-JAZIRA 827.0 62.5 8.3 0.41% 12,405 3,308
YAMAMAH SAUDI CEMENT 1318.0 21.9 8.8 2.28% 11,862 3,163
ARABIAN CEMENT 878.3 34.4 7.4 1.82% 10,539 2,810
EASTERN CEMENT 807.0 38.6 7.1 2.48% 10,410 2,776
TABUK CEMENT 595.0 64.8 9.1 1.26% 8,330 2,221
MEDICAL APPLIANCES 671.8 123.1 5.2 0.74% 8,061 2,150
AMIANTIT 517.0 98.0 9.7 - 7,962 2,123
THE QASSIM CEMENT 814.0 29.7 6.6 2.70% 7,326 1,954
NATIONAL GAS & INDUSTRIAL 487.0 60.6 6.5 1.23% 7,305 1,948
REAL ESTATE / SAUDI ARABIA 463.8 - - - 5,565 1,484
TAIBAH 359.5 85.7 4.7 1.11% 5,393 1,438
Source: Bloomberg Average 50.4 9.2 1.52% 1,726,719 460,458
In fairness the weighted PER (excluding loss-making firms) is 39.2x due to the influence of heavyweights
SABIC (31x) and Saudi Telecom (30x) which are themselves expensive compared to their global peers.
The earnings yield of 1.98% (1/50.4) and dividend yield of 1.52% are low by international standards and
compared to the SAR discount rate of 3.95% while the Price to Book Ratio (PBR) of 9.2x is outrageous!
P.O. Box 26893
Manama, Bahrain
Telephone: +973 17 533570
tarek.fadlallah@bh.nomura.com
4
Monday 20th
June, 2005
The Search for Value
Building precise valuation models for the GCC markets in the midst of an evolutionary period is very
complicated as it requires a clear understanding and an accurate evaluation of the ongoing changes.
The aggregated impact of reform, deregulation, growing inward investment, rising domestic consumption,
relaxed property rights for foreigners and the repatriation of regional wealth is difficult to assess.
Nonetheless the GCC is not the first region to undergo economic transformation and there are some
intuitive measures that can be used to evaluate whether markets are fairly valued in broad terms.
Market capitalisation is one measure that – while dependent on the number and size of listed firms – offers
some clues to guesstimate relative valuations although PERs and Yields are comparatively more objective.
Saudi Arabia China Korea Brazil Mexico Russia S. Africa
(TADAWUL) ('A' SHARES) (KOSPI) (BOVESPA) (BOLSA) (RTS INDEX) (ALL SHARE)
GDP ($bn) 310.0 7,262.0 925.0 1,492.0 1,006.0 1,408.0 491.0
Market Cap ($bn) 480.0 375.8 448.2 213.4 153.6 153.0 343.9
Ratio (%) 155% 5% 48% 14% 15% 11% 70%
PER(weighted) (x) 39.2 17.4 10.5 9.01 12.9 14.9 12.3
Div Yield (%) 1.5 2.1 2.5 24.7 1.7 2.3 2.8
Source: CIA Factbook, Bloomberg
The Saudi Arabian market capitalisation (which excludes the publicly owned oil sector and many of the
leading family firms that dominate the local economy) is now larger that the country’s GDP and
implausibly greater than the Korean KOSPI, Brazilian BOVESPA, Mexican BOLSA, Russian RTS, South
African ALL SHARE and the combined Shanghai and Shenzhen ‘A’ share indices.
The comparative valuation of Saudi Telecom offers a further insight into the disparity that exists at the
corporate level between Saudi stocks and global equities.
Country Company PER PBR DIV YIELD
China China Telecom 7.9 1.45 2.43
Korea SK Telecom 9.5 1.98 2.66
Brazil Tele Norte 11.5 1.87 6.78
Mexico Telefonos de Mexico 8.6 2.49 3.72
Russia Rostelecom 12.2 0.86 2.61
South Africa Telekom SA 9.1 2.84 4.51
Average 9.8 1.92 3.79
Saudi Arabia Saudi Telecom 30.3 9.12 2.77
(data as at 18th June, 2005) Source: Bloomberg
Taking into account the average valuation of the six emerging market telecom companies it seems highly
unlikely that Saudi Telecom is appropriately valued at current prices.
Given current global valuations investors should consider PERs of 10x-15x as appropriate benchmark
market multiples although certain high growth stocks would obviously justify premium multiples.
P.O. Box 26893
Manama, Bahrain
Telephone: +973 17 533570
tarek.fadlallah@bh.nomura.com
5
Monday 20th
June, 2005
PER
Fair Value?
0
5
10
15
20
25
30
35
40
45
2004 2005 2006 2007 2008 2009 2010 2011 2012 2013 2014 2015 2016 2017 2018
10% Growth 20% Growth 30% Growth
Profits in Saudi Arabia have increased substantially in the past two years from a modest base but recent
history may not provide an accurate guide as to how fast profits will grow in the future.
Year 10% 20% 30%
2004 39.2 39.2 39.2
2005 35.6 32.7 30.2
2006 32.4 27.2 23.2
2007 29.5 22.7 17.8
2008 26.8 18.9 13.7
2009 24.3 15.8 10.6
2010 22.1 13.1 8.1
2011 20.1 10.9 6.2
2012 18.3 9.1 4.8
2013 16.6 7.6 3.7
2014 15.1 6.3 2.8
2015 13.7 5.3 2.2
2016 12.5 4.4 1.7
2017 11.4 3.7 1.3
2018 10.3 3.1 1.0
Annual Profit Growth Rates
Naturally the timetable for suggested normalisation not only requires profits to rise as expected but also
that stock prices remain unchanged for the duration of the adjustment phase.
If stock prices were to rise or profits fail to grow as expected the adjustment process would take longer.
Current valuations leave no margin for error.
Nonetheless assuming a positive and bullish stance
the table (left) and chart (below) offer a guide as to
how valuations could develop and normalise
assuming three base scenarios for profit growth.
Under an aggressive scenario of 30% profit growth
the market will achieve sensible PER valuations of
between 15x-10x by 2007-09 whereas lower
growth of 20% will require a further two years.
Under the conservative and perhaps sensible
assumption of 10% profit growth it will take until
2014-18 (up to thirteen years!) for PERs to correct
toward historically sustainable levels.
P.O. Box 26893
Manama, Bahrain
Telephone: +973 17 533570
tarek.fadlallah@bh.nomura.com
6
Monday 20th
June, 2005
The China Model
The performance of the Chinese stock market offers an illuminating illustration of how highly valued
markets can adjust even in a healthy macro-economic environment when profits are rising.
In July 1994 the Shanghai A index that consists of Renminbi denominated local shares began a sharp rally
propelled by the breathtaking pace of economic growth in China.
By June 2001 the index had risen 700% from 330 points to a record 2,337 points as local investors
celebrated China’s unprecedented period of double digit economic growth.
Valuations also soared with the market earnings multiple reaching a flabbergasting 62x in August 2000
after which they began a downward adjustment which has taken five years and cut PERs to around 17x.
800
1000
1200
1400
1600
1800
2000
2200
2400
Dec-99 May-00 Oct-00 Mar-01 Aug-01 Jan-02 Jun-02 Nov-02 Apr-03 Sep-03 Feb-04 Jul-04 Dec-04 May-05
Shanghai A Share Index
10
20
30
40
50
60
70
P/E Ratio
Economic Growth
The adjustment was partly due to an increase in earnings but owed much to the fact that the stock market
recorded a -55% decline during this period.
China has shown that it is possible for stocks to decline in spite of a buoyant economy and rising profits if
the starting point is high valuations.
This multiple contraction phenomenon is typical in emerging markets and follows a period of rapid share
price appreciation after investors have rushed to discount positive news well into the distant future.
P.O. Box 26893
Manama, Bahrain
Telephone: +973 17 533570
tarek.fadlallah@bh.nomura.com
7
Monday 20th
June, 2005
Scope for Correction
Excessive valuations can be adjusted either gradually through a drawn out period of sideways trading with
a downside bias or by a sharp correction with a messy aftermath.
And while it is possible that some of the GCC markets could correct gradually the nature of the rally and
the frenzied retail activity suggests that the correction will be both sharp and painful.
The use of leverage (either directly or indirectly) which has boosted the gains on the upside is likely to
amplify the risks to the downside with the upside overshoot being matched by a downside overshoot.
Since there are no technical signs that the GCC markets have peaked yet some investors may be tempted to
take advantage of the rising price trend to hunt some eleventh-hour profits.
Further gains among the GCC markets are certainly possible but an important lesson from the NASDAQ
debacle is that timing the market peak is very difficult even in efficient markets.
Unfortunately the trigger for a correction is rarely apparent except in hindsight and psychological factors
often play a crucial role – sometimes stocks fall because they fell yesterday and might fall tomorrow.
Furthermore once a post-bubble bear market is underway it can be both severe in depth and lengthy in
duration depending on the nature of the excesses and the market mechanisms in place to deflate them.
The Nikkei index fell -80% between December 1989 and April 2003 (one hundred and sixty months)
while the more efficient NASDAQ index declined an equally dramatic -78% in just thirty one months!
Strategy and Action Plan
Exposure to the most blatantly overvalued markets in Saudi Arabia, the UAE and possibly Qatar should be
aggressively reduced at current levels.
Saudi Arabia UAE Kuwait Qatar Oman Bahrain
TASI NBAD KSEI DSM MSM All Share
13,933 17,961 8,569 10,158 5,505 2,163
SELL SELL REDUCE REDUCE REDUCE REDUCE
Source: Bloomberg
Valuations in Kuwait, Bahrain and Oman appear reasonable if not cheap but these markets are unlikely to
be excluded from any regional price adjustments even if they might avoid the worst.
Notwithstanding the dire nature of this warning it may be prudent for investors to maintain some selective
exposure to attractively priced stocks for long term investment purposes (or in case we are wrong)!
Going forward local investors should consider a dollar averaging investment strategy in order to avoid
buying the highs or missing the lows.
P.O. Box 26893
Manama, Bahrain
Telephone: +973 17 533570
tarek.fadlallah@bh.nomura.com
8
Monday 20th
June, 2005
Conclusion
The bearish call on GCC stocks is no reflection on the long term prospects for regional economic growth
or the capabilities of local managers.
Instead it is a statement about the disconnect that now exists between the real economy and the financial
instruments that purport to represent them.
The GCC markets had been undervalued prior to the invasion of Iraq but have now become overvalued as
the initial euphoria and subsequent boom developed into what some might term “irrational exuberance”.
It is possible that the GCC markets provide an exception to the rule but if history is to be repeated then the
highs in the local markets may be imminent and may be followed by a period of severe declines.
Beware. Red Alert.
Regards
Tarek Fadlallah, CFA
IMPORTANT WARNING: PLEASE NOTE THAT THE PERSONAL OPINIONS EXPRESSED IN THIS NOTE ARE SOLEY THOSE OF THE
AUTHOR AND DO NOT REFLECT ANY RECOMMENDATIONS OR ATTEMPT TO SOLICIT BUSINESS. THIS PUBLICATION HAS BEEN
ISSUED BY THE SALES/TRADING DEPARTMENT OF NOMURA INVESTMENT BANKING (MIDDLE EAST) BSC AND IS PROVIDED
WITHOUT COMPENSATION. THIS DOCUMENT IS NOT INTENDED FOR PRIVATE CUSTOMERS WITHIN THE RULES OF THE UK
FINANCIAL SERVICES AUTHRORITY (FSA) OR THE BAHRAIN MONETARY AGENCY (BMA) AND IS NOT TO BE DISTRIUBTED WITHOUT
PRIOR AUTHORISATION AND IS NOT INTENDED FOR PRIVATE INDIVIDUALS AND SHOULD NOT BE DISTRIBUTED AS SUCH NOR
SHOULD IT BE COPIED TO ANY OTHER PERSON WITHOUT OUT EXPRESS CONSENT. THIS DOCUMENT SHOULD NOT BE
CONSIDERED AN OFFER TO BUY OR SELL INVESTMENTS. WE ARE NOT YOUR INVESTMENT ADVISER AND THIS INFORMATION IS
PROVIDED ON THE BASIS THAT YOU HAVE SUCH KNOWLEDGE AND EXPERIENCE TO EVALUATE ITS MERITS AMD RISKS AND ARE
CAPABLE OF UNDERTAKING YOUR OWN OBJECTIVE ANALYSIS OF THE INVESTMENT AND ITS SUITABILITY TO MEET YOUR
REQUIREMENTS. THE INFORMATION IS BASED ON SOURCES WE BELIEVE TO BE RELIABLE BUT WE DO NOT REPRESENT THAT IT
IS ACCURATE OR COMPLETE. ANY VALUATIONS CONTAINED HEREIN ARE SUBJECT TO CHANGE WITHOUT NOTICE. NOMURA
INVESTMENT BANKING (MIDDLE EAST) BSC AND/OR CONNECTED PERSONS DO NOT ACCEPT ANY LIABILITY WHATSOEVER FOR
ANY DIRECT, INDIRECT, INCORRECT OR INCONSEQUENTIAL LOSS ARISING FOM ANY USE OF THE INFORMATION OR ITS CONTENT.
NOMURA INVESTMENT BANKING (MIDDLE EAST) BSC IS AUTHORISED AND REGULATED BY THE BMA.

More Related Content

What's hot

8 September Daily market report
8 September Daily market report8 September Daily market report
8 September Daily market reportQNB Group
 
10 September Daily Market Report
10 September Daily Market Report 10 September Daily Market Report
10 September Daily Market Report QNB Group
 
The Arabian Markets - Afterworld
The Arabian Markets - AfterworldThe Arabian Markets - Afterworld
The Arabian Markets - AfterworldTarek Fadlallah
 
25 September Daily market report
25 September Daily market report25 September Daily market report
25 September Daily market reportQNB Group
 
New base 684 special 10 september 2015
New base 684 special  10 september 2015New base 684 special  10 september 2015
New base 684 special 10 september 2015Khaled Al Awadi
 
Crisis In Regional Aviation
Crisis In Regional AviationCrisis In Regional Aviation
Crisis In Regional AviationAndrew_Watterson
 
29 September Daily Market Report
29 September Daily Market Report 29 September Daily Market Report
29 September Daily Market Report QNB Group
 
New base 21 october 2019 energy news issue 1287 by khaled al awadi (1)
New base 21 october 2019 energy news issue   1287  by khaled al awadi (1)New base 21 october 2019 energy news issue   1287  by khaled al awadi (1)
New base 21 october 2019 energy news issue 1287 by khaled al awadi (1)Khaled Al Awadi
 
9 April Daily market report
9 April Daily market report 9 April Daily market report
9 April Daily market report QNB Group
 
QNBFS Daily Market Report November 23, 2020
QNBFS Daily Market Report November 23, 2020QNBFS Daily Market Report November 23, 2020
QNBFS Daily Market Report November 23, 2020QNB Group
 
Saudi aramco ipo - a reality of mythical proportions
Saudi aramco ipo - a reality of mythical proportionsSaudi aramco ipo - a reality of mythical proportions
Saudi aramco ipo - a reality of mythical proportionsAranca
 
MENA SUKUK: Untapped Potential - Adnan Halawi
MENA SUKUK: Untapped Potential - Adnan HalawiMENA SUKUK: Untapped Potential - Adnan Halawi
MENA SUKUK: Untapped Potential - Adnan HalawiAdnan Halawi
 
QNBFS Weekly Market Report July 19, 2018
QNBFS Weekly Market Report July 19, 2018 QNBFS Weekly Market Report July 19, 2018
QNBFS Weekly Market Report July 19, 2018 QNB Group
 
9 March Daily market report
9 March Daily market report9 March Daily market report
9 March Daily market reportQNB Group
 
Motaz Al Mohamady SM V4.3
Motaz Al Mohamady  SM  V4.3Motaz Al Mohamady  SM  V4.3
Motaz Al Mohamady SM V4.3Motaz Ahmed
 
2017 Trafigura interim report period ended 31 march 2017
2017 Trafigura interim report period ended 31 march 20172017 Trafigura interim report period ended 31 march 2017
2017 Trafigura interim report period ended 31 march 2017GE 94
 
East Africa Growing Interest in Investment Opportunities
East Africa  Growing Interest in Investment OpportunitiesEast Africa  Growing Interest in Investment Opportunities
East Africa Growing Interest in Investment OpportunitiesRuth Adams
 

What's hot (19)

8 September Daily market report
8 September Daily market report8 September Daily market report
8 September Daily market report
 
10 September Daily Market Report
10 September Daily Market Report 10 September Daily Market Report
10 September Daily Market Report
 
The Arabian Markets - Afterworld
The Arabian Markets - AfterworldThe Arabian Markets - Afterworld
The Arabian Markets - Afterworld
 
25 September Daily market report
25 September Daily market report25 September Daily market report
25 September Daily market report
 
New base 684 special 10 september 2015
New base 684 special  10 september 2015New base 684 special  10 september 2015
New base 684 special 10 september 2015
 
Crisis In Regional Aviation
Crisis In Regional AviationCrisis In Regional Aviation
Crisis In Regional Aviation
 
29 September Daily Market Report
29 September Daily Market Report 29 September Daily Market Report
29 September Daily Market Report
 
New base 21 october 2019 energy news issue 1287 by khaled al awadi (1)
New base 21 october 2019 energy news issue   1287  by khaled al awadi (1)New base 21 october 2019 energy news issue   1287  by khaled al awadi (1)
New base 21 october 2019 energy news issue 1287 by khaled al awadi (1)
 
9 April Daily market report
9 April Daily market report 9 April Daily market report
9 April Daily market report
 
QNBFS Daily Market Report November 23, 2020
QNBFS Daily Market Report November 23, 2020QNBFS Daily Market Report November 23, 2020
QNBFS Daily Market Report November 23, 2020
 
Saudi aramco ipo - a reality of mythical proportions
Saudi aramco ipo - a reality of mythical proportionsSaudi aramco ipo - a reality of mythical proportions
Saudi aramco ipo - a reality of mythical proportions
 
MENA SUKUK: Untapped Potential - Adnan Halawi
MENA SUKUK: Untapped Potential - Adnan HalawiMENA SUKUK: Untapped Potential - Adnan Halawi
MENA SUKUK: Untapped Potential - Adnan Halawi
 
Indian Equities - Time-In or Timing?
Indian Equities - Time-In or Timing?Indian Equities - Time-In or Timing?
Indian Equities - Time-In or Timing?
 
QNBFS Weekly Market Report July 19, 2018
QNBFS Weekly Market Report July 19, 2018 QNBFS Weekly Market Report July 19, 2018
QNBFS Weekly Market Report July 19, 2018
 
9 March Daily market report
9 March Daily market report9 March Daily market report
9 March Daily market report
 
Motaz Al Mohamady SM V4.3
Motaz Al Mohamady  SM  V4.3Motaz Al Mohamady  SM  V4.3
Motaz Al Mohamady SM V4.3
 
Initiating coverage tata motors ltd
Initiating coverage tata motors ltdInitiating coverage tata motors ltd
Initiating coverage tata motors ltd
 
2017 Trafigura interim report period ended 31 march 2017
2017 Trafigura interim report period ended 31 march 20172017 Trafigura interim report period ended 31 march 2017
2017 Trafigura interim report period ended 31 march 2017
 
East Africa Growing Interest in Investment Opportunities
East Africa  Growing Interest in Investment OpportunitiesEast Africa  Growing Interest in Investment Opportunities
East Africa Growing Interest in Investment Opportunities
 

Similar to The Great Arabian Bubble (2005)

The GCC Bear Trap (August 2005)
The GCC Bear Trap (August 2005)The GCC Bear Trap (August 2005)
The GCC Bear Trap (August 2005)Tarek Fadlallah
 
Souk of Fortune (January 2006)
Souk of Fortune (January 2006)Souk of Fortune (January 2006)
Souk of Fortune (January 2006)Tarek Fadlallah
 
21 October Daily market report
21 October Daily market report 21 October Daily market report
21 October Daily market report QNB Group
 
9 December Daily Market Report
9 December Daily Market Report9 December Daily Market Report
9 December Daily Market ReportQNB Group
 
QNBFS Daily Market Report April 6, 2022
QNBFS Daily Market Report April 6, 2022QNBFS Daily Market Report April 6, 2022
QNBFS Daily Market Report April 6, 2022QNB Group
 
QNBFS Daily Market Report August 16, 2018
QNBFS Daily Market Report August 16, 2018QNBFS Daily Market Report August 16, 2018
QNBFS Daily Market Report August 16, 2018QNB Group
 
4 August Technical Market Report
4 August Technical Market Report4 August Technical Market Report
4 August Technical Market ReportQNB Group
 
QNBFS Daily Market Report January 02, 2022
QNBFS Daily Market Report January 02, 2022QNBFS Daily Market Report January 02, 2022
QNBFS Daily Market Report January 02, 2022QNB Group
 
QNBFS Daily Market Report May 05, 2021
QNBFS Daily Market Report May 05, 2021QNBFS Daily Market Report May 05, 2021
QNBFS Daily Market Report May 05, 2021QNB Group
 
11 February Daily market report
11 February Daily market report 11 February Daily market report
11 February Daily market report QNB Group
 
20 January Daily market report
20 January Daily market report20 January Daily market report
20 January Daily market reportQNB Group
 
25 March Daily market report
25 March Daily market report25 March Daily market report
25 March Daily market reportQNB Group
 
9 July Technical Market Report
9 July Technical Market Report9 July Technical Market Report
9 July Technical Market ReportQNB Group
 
QNBFS Daily Market Report March 22, 2020
QNBFS Daily Market Report March 22, 2020QNBFS Daily Market Report March 22, 2020
QNBFS Daily Market Report March 22, 2020QNB Group
 
2 April Daily market report
2 April Daily market report2 April Daily market report
2 April Daily market reportQNB Group
 
30 March Daily market report
30 March Daily market report 30 March Daily market report
30 March Daily market report QNB Group
 
QNBFS Daily Market Report September 07, 2017
QNBFS Daily Market Report September 07, 2017QNBFS Daily Market Report September 07, 2017
QNBFS Daily Market Report September 07, 2017QNB Group
 
QNBFS Daily Market Report March 20, 2019
QNBFS Daily Market Report March 20, 2019QNBFS Daily Market Report March 20, 2019
QNBFS Daily Market Report March 20, 2019QNB Group
 
14 April Daily market report
14 April Daily market report14 April Daily market report
14 April Daily market reportQNB Group
 
QNBFS Daily Market Report March 20, 2022
QNBFS Daily Market Report March 20, 2022QNBFS Daily Market Report March 20, 2022
QNBFS Daily Market Report March 20, 2022QNB Group
 

Similar to The Great Arabian Bubble (2005) (20)

The GCC Bear Trap (August 2005)
The GCC Bear Trap (August 2005)The GCC Bear Trap (August 2005)
The GCC Bear Trap (August 2005)
 
Souk of Fortune (January 2006)
Souk of Fortune (January 2006)Souk of Fortune (January 2006)
Souk of Fortune (January 2006)
 
21 October Daily market report
21 October Daily market report 21 October Daily market report
21 October Daily market report
 
9 December Daily Market Report
9 December Daily Market Report9 December Daily Market Report
9 December Daily Market Report
 
QNBFS Daily Market Report April 6, 2022
QNBFS Daily Market Report April 6, 2022QNBFS Daily Market Report April 6, 2022
QNBFS Daily Market Report April 6, 2022
 
QNBFS Daily Market Report August 16, 2018
QNBFS Daily Market Report August 16, 2018QNBFS Daily Market Report August 16, 2018
QNBFS Daily Market Report August 16, 2018
 
4 August Technical Market Report
4 August Technical Market Report4 August Technical Market Report
4 August Technical Market Report
 
QNBFS Daily Market Report January 02, 2022
QNBFS Daily Market Report January 02, 2022QNBFS Daily Market Report January 02, 2022
QNBFS Daily Market Report January 02, 2022
 
QNBFS Daily Market Report May 05, 2021
QNBFS Daily Market Report May 05, 2021QNBFS Daily Market Report May 05, 2021
QNBFS Daily Market Report May 05, 2021
 
11 February Daily market report
11 February Daily market report 11 February Daily market report
11 February Daily market report
 
20 January Daily market report
20 January Daily market report20 January Daily market report
20 January Daily market report
 
25 March Daily market report
25 March Daily market report25 March Daily market report
25 March Daily market report
 
9 July Technical Market Report
9 July Technical Market Report9 July Technical Market Report
9 July Technical Market Report
 
QNBFS Daily Market Report March 22, 2020
QNBFS Daily Market Report March 22, 2020QNBFS Daily Market Report March 22, 2020
QNBFS Daily Market Report March 22, 2020
 
2 April Daily market report
2 April Daily market report2 April Daily market report
2 April Daily market report
 
30 March Daily market report
30 March Daily market report 30 March Daily market report
30 March Daily market report
 
QNBFS Daily Market Report September 07, 2017
QNBFS Daily Market Report September 07, 2017QNBFS Daily Market Report September 07, 2017
QNBFS Daily Market Report September 07, 2017
 
QNBFS Daily Market Report March 20, 2019
QNBFS Daily Market Report March 20, 2019QNBFS Daily Market Report March 20, 2019
QNBFS Daily Market Report March 20, 2019
 
14 April Daily market report
14 April Daily market report14 April Daily market report
14 April Daily market report
 
QNBFS Daily Market Report March 20, 2022
QNBFS Daily Market Report March 20, 2022QNBFS Daily Market Report March 20, 2022
QNBFS Daily Market Report March 20, 2022
 

More from Tarek Fadlallah

The Arabian Markets - Rebuilding the Economy
The Arabian Markets - Rebuilding the EconomyThe Arabian Markets - Rebuilding the Economy
The Arabian Markets - Rebuilding the EconomyTarek Fadlallah
 
The Arabian Markets: Unknown Unknowns
The Arabian Markets: Unknown UnknownsThe Arabian Markets: Unknown Unknowns
The Arabian Markets: Unknown UnknownsTarek Fadlallah
 
The Arabian Markets - Neverland
The Arabian Markets - Neverland The Arabian Markets - Neverland
The Arabian Markets - Neverland Tarek Fadlallah
 
Setting The Tone For Listing GCC State Owned Enterprises
Setting The Tone For Listing GCC State Owned EnterprisesSetting The Tone For Listing GCC State Owned Enterprises
Setting The Tone For Listing GCC State Owned EnterprisesTarek Fadlallah
 

More from Tarek Fadlallah (12)

The GCC's Golden Era
The GCC's Golden EraThe GCC's Golden Era
The GCC's Golden Era
 
Game Stopped
Game StoppedGame Stopped
Game Stopped
 
The Arabian Markets - Rebuilding the Economy
The Arabian Markets - Rebuilding the EconomyThe Arabian Markets - Rebuilding the Economy
The Arabian Markets - Rebuilding the Economy
 
The Litmus test
The Litmus testThe Litmus test
The Litmus test
 
Paradox of Plenty
Paradox of PlentyParadox of Plenty
Paradox of Plenty
 
The Arabian Markets: Unknown Unknowns
The Arabian Markets: Unknown UnknownsThe Arabian Markets: Unknown Unknowns
The Arabian Markets: Unknown Unknowns
 
A Numbers Game
A Numbers GameA Numbers Game
A Numbers Game
 
The Gemini Economy
The Gemini EconomyThe Gemini Economy
The Gemini Economy
 
Decade Of Disruption
Decade Of DisruptionDecade Of Disruption
Decade Of Disruption
 
The Arabian Markets - Neverland
The Arabian Markets - Neverland The Arabian Markets - Neverland
The Arabian Markets - Neverland
 
Setting The Tone For Listing GCC State Owned Enterprises
Setting The Tone For Listing GCC State Owned EnterprisesSetting The Tone For Listing GCC State Owned Enterprises
Setting The Tone For Listing GCC State Owned Enterprises
 
Brave New World
Brave New WorldBrave New World
Brave New World
 

Recently uploaded

letter-from-the-chair-to-the-fca-relating-to-british-steel-pensions-scheme-15...
letter-from-the-chair-to-the-fca-relating-to-british-steel-pensions-scheme-15...letter-from-the-chair-to-the-fca-relating-to-british-steel-pensions-scheme-15...
letter-from-the-chair-to-the-fca-relating-to-british-steel-pensions-scheme-15...Henry Tapper
 
00_Main ppt_MeetupDORA&CyberSecurity.pptx
00_Main ppt_MeetupDORA&CyberSecurity.pptx00_Main ppt_MeetupDORA&CyberSecurity.pptx
00_Main ppt_MeetupDORA&CyberSecurity.pptxFinTech Belgium
 
Call US 📞 9892124323 ✅ Kurla Call Girls In Kurla ( Mumbai ) secure service
Call US 📞 9892124323 ✅ Kurla Call Girls In Kurla ( Mumbai ) secure serviceCall US 📞 9892124323 ✅ Kurla Call Girls In Kurla ( Mumbai ) secure service
Call US 📞 9892124323 ✅ Kurla Call Girls In Kurla ( Mumbai ) secure servicePooja Nehwal
 
High Class Call Girls Nagpur Grishma Call 7001035870 Meet With Nagpur Escorts
High Class Call Girls Nagpur Grishma Call 7001035870 Meet With Nagpur EscortsHigh Class Call Girls Nagpur Grishma Call 7001035870 Meet With Nagpur Escorts
High Class Call Girls Nagpur Grishma Call 7001035870 Meet With Nagpur Escortsranjana rawat
 
Bladex Earnings Call Presentation 1Q2024
Bladex Earnings Call Presentation 1Q2024Bladex Earnings Call Presentation 1Q2024
Bladex Earnings Call Presentation 1Q2024Bladex
 
High Class Call Girls Nashik Maya 7001305949 Independent Escort Service Nashik
High Class Call Girls Nashik Maya 7001305949 Independent Escort Service NashikHigh Class Call Girls Nashik Maya 7001305949 Independent Escort Service Nashik
High Class Call Girls Nashik Maya 7001305949 Independent Escort Service NashikCall Girls in Nagpur High Profile
 
Instant Issue Debit Cards - High School Spirit
Instant Issue Debit Cards - High School SpiritInstant Issue Debit Cards - High School Spirit
Instant Issue Debit Cards - High School Spiritegoetzinger
 
(DIYA) Bhumkar Chowk Call Girls Just Call 7001035870 [ Cash on Delivery ] Pun...
(DIYA) Bhumkar Chowk Call Girls Just Call 7001035870 [ Cash on Delivery ] Pun...(DIYA) Bhumkar Chowk Call Girls Just Call 7001035870 [ Cash on Delivery ] Pun...
(DIYA) Bhumkar Chowk Call Girls Just Call 7001035870 [ Cash on Delivery ] Pun...ranjana rawat
 
Instant Issue Debit Cards - School Designs
Instant Issue Debit Cards - School DesignsInstant Issue Debit Cards - School Designs
Instant Issue Debit Cards - School Designsegoetzinger
 
Independent Lucknow Call Girls 8923113531WhatsApp Lucknow Call Girls make you...
Independent Lucknow Call Girls 8923113531WhatsApp Lucknow Call Girls make you...Independent Lucknow Call Girls 8923113531WhatsApp Lucknow Call Girls make you...
Independent Lucknow Call Girls 8923113531WhatsApp Lucknow Call Girls make you...makika9823
 
20240429 Calibre April 2024 Investor Presentation.pdf
20240429 Calibre April 2024 Investor Presentation.pdf20240429 Calibre April 2024 Investor Presentation.pdf
20240429 Calibre April 2024 Investor Presentation.pdfAdnet Communications
 
Call Girls Service Nagpur Maya Call 7001035870 Meet With Nagpur Escorts
Call Girls Service Nagpur Maya Call 7001035870 Meet With Nagpur EscortsCall Girls Service Nagpur Maya Call 7001035870 Meet With Nagpur Escorts
Call Girls Service Nagpur Maya Call 7001035870 Meet With Nagpur Escortsranjana rawat
 
02_Fabio Colombo_Accenture_MeetupDora&Cybersecurity.pptx
02_Fabio Colombo_Accenture_MeetupDora&Cybersecurity.pptx02_Fabio Colombo_Accenture_MeetupDora&Cybersecurity.pptx
02_Fabio Colombo_Accenture_MeetupDora&Cybersecurity.pptxFinTech Belgium
 
VIP Call Girls Thane Sia 8617697112 Independent Escort Service Thane
VIP Call Girls Thane Sia 8617697112 Independent Escort Service ThaneVIP Call Girls Thane Sia 8617697112 Independent Escort Service Thane
VIP Call Girls Thane Sia 8617697112 Independent Escort Service ThaneCall girls in Ahmedabad High profile
 
Russian Call Girls In Gtb Nagar (Delhi) 9711199012 💋✔💕😘 Naughty Call Girls Se...
Russian Call Girls In Gtb Nagar (Delhi) 9711199012 💋✔💕😘 Naughty Call Girls Se...Russian Call Girls In Gtb Nagar (Delhi) 9711199012 💋✔💕😘 Naughty Call Girls Se...
Russian Call Girls In Gtb Nagar (Delhi) 9711199012 💋✔💕😘 Naughty Call Girls Se...shivangimorya083
 
Dharavi Russian callg Girls, { 09892124323 } || Call Girl In Mumbai ...
Dharavi Russian callg Girls, { 09892124323 } || Call Girl In Mumbai ...Dharavi Russian callg Girls, { 09892124323 } || Call Girl In Mumbai ...
Dharavi Russian callg Girls, { 09892124323 } || Call Girl In Mumbai ...Pooja Nehwal
 
VIP Kolkata Call Girl Serampore 👉 8250192130 Available With Room
VIP Kolkata Call Girl Serampore 👉 8250192130  Available With RoomVIP Kolkata Call Girl Serampore 👉 8250192130  Available With Room
VIP Kolkata Call Girl Serampore 👉 8250192130 Available With Roomdivyansh0kumar0
 
05_Annelore Lenoir_Docbyte_MeetupDora&Cybersecurity.pptx
05_Annelore Lenoir_Docbyte_MeetupDora&Cybersecurity.pptx05_Annelore Lenoir_Docbyte_MeetupDora&Cybersecurity.pptx
05_Annelore Lenoir_Docbyte_MeetupDora&Cybersecurity.pptxFinTech Belgium
 
Monthly Market Risk Update: April 2024 [SlideShare]
Monthly Market Risk Update: April 2024 [SlideShare]Monthly Market Risk Update: April 2024 [SlideShare]
Monthly Market Risk Update: April 2024 [SlideShare]Commonwealth
 

Recently uploaded (20)

letter-from-the-chair-to-the-fca-relating-to-british-steel-pensions-scheme-15...
letter-from-the-chair-to-the-fca-relating-to-british-steel-pensions-scheme-15...letter-from-the-chair-to-the-fca-relating-to-british-steel-pensions-scheme-15...
letter-from-the-chair-to-the-fca-relating-to-british-steel-pensions-scheme-15...
 
00_Main ppt_MeetupDORA&CyberSecurity.pptx
00_Main ppt_MeetupDORA&CyberSecurity.pptx00_Main ppt_MeetupDORA&CyberSecurity.pptx
00_Main ppt_MeetupDORA&CyberSecurity.pptx
 
Call US 📞 9892124323 ✅ Kurla Call Girls In Kurla ( Mumbai ) secure service
Call US 📞 9892124323 ✅ Kurla Call Girls In Kurla ( Mumbai ) secure serviceCall US 📞 9892124323 ✅ Kurla Call Girls In Kurla ( Mumbai ) secure service
Call US 📞 9892124323 ✅ Kurla Call Girls In Kurla ( Mumbai ) secure service
 
High Class Call Girls Nagpur Grishma Call 7001035870 Meet With Nagpur Escorts
High Class Call Girls Nagpur Grishma Call 7001035870 Meet With Nagpur EscortsHigh Class Call Girls Nagpur Grishma Call 7001035870 Meet With Nagpur Escorts
High Class Call Girls Nagpur Grishma Call 7001035870 Meet With Nagpur Escorts
 
Commercial Bank Economic Capsule - April 2024
Commercial Bank Economic Capsule - April 2024Commercial Bank Economic Capsule - April 2024
Commercial Bank Economic Capsule - April 2024
 
Bladex Earnings Call Presentation 1Q2024
Bladex Earnings Call Presentation 1Q2024Bladex Earnings Call Presentation 1Q2024
Bladex Earnings Call Presentation 1Q2024
 
High Class Call Girls Nashik Maya 7001305949 Independent Escort Service Nashik
High Class Call Girls Nashik Maya 7001305949 Independent Escort Service NashikHigh Class Call Girls Nashik Maya 7001305949 Independent Escort Service Nashik
High Class Call Girls Nashik Maya 7001305949 Independent Escort Service Nashik
 
Instant Issue Debit Cards - High School Spirit
Instant Issue Debit Cards - High School SpiritInstant Issue Debit Cards - High School Spirit
Instant Issue Debit Cards - High School Spirit
 
(DIYA) Bhumkar Chowk Call Girls Just Call 7001035870 [ Cash on Delivery ] Pun...
(DIYA) Bhumkar Chowk Call Girls Just Call 7001035870 [ Cash on Delivery ] Pun...(DIYA) Bhumkar Chowk Call Girls Just Call 7001035870 [ Cash on Delivery ] Pun...
(DIYA) Bhumkar Chowk Call Girls Just Call 7001035870 [ Cash on Delivery ] Pun...
 
Instant Issue Debit Cards - School Designs
Instant Issue Debit Cards - School DesignsInstant Issue Debit Cards - School Designs
Instant Issue Debit Cards - School Designs
 
Independent Lucknow Call Girls 8923113531WhatsApp Lucknow Call Girls make you...
Independent Lucknow Call Girls 8923113531WhatsApp Lucknow Call Girls make you...Independent Lucknow Call Girls 8923113531WhatsApp Lucknow Call Girls make you...
Independent Lucknow Call Girls 8923113531WhatsApp Lucknow Call Girls make you...
 
20240429 Calibre April 2024 Investor Presentation.pdf
20240429 Calibre April 2024 Investor Presentation.pdf20240429 Calibre April 2024 Investor Presentation.pdf
20240429 Calibre April 2024 Investor Presentation.pdf
 
Call Girls Service Nagpur Maya Call 7001035870 Meet With Nagpur Escorts
Call Girls Service Nagpur Maya Call 7001035870 Meet With Nagpur EscortsCall Girls Service Nagpur Maya Call 7001035870 Meet With Nagpur Escorts
Call Girls Service Nagpur Maya Call 7001035870 Meet With Nagpur Escorts
 
02_Fabio Colombo_Accenture_MeetupDora&Cybersecurity.pptx
02_Fabio Colombo_Accenture_MeetupDora&Cybersecurity.pptx02_Fabio Colombo_Accenture_MeetupDora&Cybersecurity.pptx
02_Fabio Colombo_Accenture_MeetupDora&Cybersecurity.pptx
 
VIP Call Girls Thane Sia 8617697112 Independent Escort Service Thane
VIP Call Girls Thane Sia 8617697112 Independent Escort Service ThaneVIP Call Girls Thane Sia 8617697112 Independent Escort Service Thane
VIP Call Girls Thane Sia 8617697112 Independent Escort Service Thane
 
Russian Call Girls In Gtb Nagar (Delhi) 9711199012 💋✔💕😘 Naughty Call Girls Se...
Russian Call Girls In Gtb Nagar (Delhi) 9711199012 💋✔💕😘 Naughty Call Girls Se...Russian Call Girls In Gtb Nagar (Delhi) 9711199012 💋✔💕😘 Naughty Call Girls Se...
Russian Call Girls In Gtb Nagar (Delhi) 9711199012 💋✔💕😘 Naughty Call Girls Se...
 
Dharavi Russian callg Girls, { 09892124323 } || Call Girl In Mumbai ...
Dharavi Russian callg Girls, { 09892124323 } || Call Girl In Mumbai ...Dharavi Russian callg Girls, { 09892124323 } || Call Girl In Mumbai ...
Dharavi Russian callg Girls, { 09892124323 } || Call Girl In Mumbai ...
 
VIP Kolkata Call Girl Serampore 👉 8250192130 Available With Room
VIP Kolkata Call Girl Serampore 👉 8250192130  Available With RoomVIP Kolkata Call Girl Serampore 👉 8250192130  Available With Room
VIP Kolkata Call Girl Serampore 👉 8250192130 Available With Room
 
05_Annelore Lenoir_Docbyte_MeetupDora&Cybersecurity.pptx
05_Annelore Lenoir_Docbyte_MeetupDora&Cybersecurity.pptx05_Annelore Lenoir_Docbyte_MeetupDora&Cybersecurity.pptx
05_Annelore Lenoir_Docbyte_MeetupDora&Cybersecurity.pptx
 
Monthly Market Risk Update: April 2024 [SlideShare]
Monthly Market Risk Update: April 2024 [SlideShare]Monthly Market Risk Update: April 2024 [SlideShare]
Monthly Market Risk Update: April 2024 [SlideShare]
 

The Great Arabian Bubble (2005)

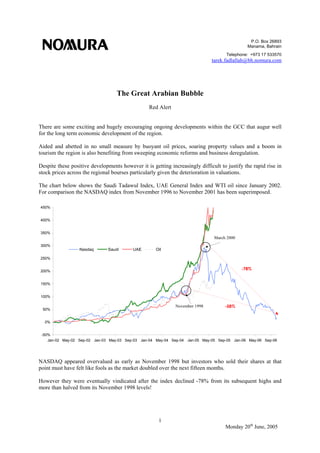
  • 1. P.O. Box 26893 Manama, Bahrain Telephone: +973 17 533570 tarek.fadlallah@bh.nomura.com 1 Monday 20th June, 2005 -50% 0% 50% 100% 150% 200% 250% 300% 350% 400% 450% Jan-02 May-02 Sep-02 Jan-03 May-03 Sep-03 Jan-04 May-04 Sep-04 Jan-05 May-05 Sep-05 Jan-06 May-06 Sep-06 Nasdaq Saudi UAE Oil November 1998 March 2000 -58% -78% The Great Arabian Bubble Red Alert There are some exciting and hugely encouraging ongoing developments within the GCC that augur well for the long term economic development of the region. Aided and abetted in no small measure by buoyant oil prices, soaring property values and a boom in tourism the region is also benefiting from sweeping economic reforms and business deregulation. Despite these positive developments however it is getting increasingly difficult to justify the rapid rise in stock prices across the regional bourses particularly given the deterioration in valuations. The chart below shows the Saudi Tadawul Index, UAE General Index and WTI oil since January 2002. For comparison the NASDAQ index from November 1996 to November 2001 has been superimposed. NASDAQ appeared overvalued as early as November 1998 but investors who sold their shares at that point must have felt like fools as the market doubled over the next fifteen months. However they were eventually vindicated after the index declined -78% from its subsequent highs and more than halved from its November 1998 levels!
  • 2. P.O. Box 26893 Manama, Bahrain Telephone: +973 17 533570 tarek.fadlallah@bh.nomura.com 2 Monday 20th June, 2005 Sign of the Times The sight of university students flaunting shimmering new sports cars at the local shopping mall may not be unusual but the fact that these are being self-financed by stock market profits ought to be raising alarm. Such images are reminiscent of New York taxi drivers throwing away their keys to become NASDAQ day traders or Japanese housewives funding luxury lifestyles through real estate speculation in the 1980s. Stock Market Performance: (as at 19th June) Saudi Arabia UAE Kuwait Qatar Oman MSCI-World 2005 (YTD) 69.8% 111.8% 33.7% 56.4% 63.1% 0.1% 2004 84.9% 88.4% 33.8% 64.5% 23.8% 13.4% 2003 76.2% 32.1% 101.7% 69.9% 42.1% 32.1% Source: Bloomberg While no two bubbles are identical they tend to share common characteristics some of which are becoming evident across the GCC markets particularly in Saudi Arabia and the UAE. One principle characteristic is that participants and vested interests discard universal valuation benchmarks to validate the higher prices on the basis of some new paradigm. Stock market gains today are said to be durable because they rest on a sound economic basis revolving upon economic reform, a structural rise in oil prices, a boom in real estate and increased regional liquidity. But it is instructive to note that every bubble in history including the one preceding the Great Crash has been rooted in sound fundamentals only to spiral out of proportion through excessive speculation. • In the 1980s the bubble in Japan was sustained by rising asset prices, low interest rates, soaring exports and an appreciating currency – but prices ran too far and valuations deteriorated. • In the 1990s the bubble in internet stocks was based on a genuine revolution in technology that has radically changed our world – but prices ran too far and valuations deteriorated. Another characteristic evident across the GCC is that corporate profits become highly leveraged into the rising trend in asset prices – property and stocks – that develops into a virtuous circle feeding upon itself. A third major characteristic is that retail investors (often borrowing heavily) embrace risk without concern and plunge wholeheartedly into stocks for fear of being excluded from the enriching party. Although investors would like to believe that their markets are unique and that this particular situation is different the likelihood is that the GCC markets are destined to play by the universal rules that govern markets from Toronto to Tokyo and Timbuktu. A case can made for a correction in all GCC markets but this note will focus on the Saudi Arabian market due to its scale, extraordinary valuations and its potential impact on neighbouring states.
  • 3. P.O. Box 26893 Manama, Bahrain Telephone: +973 17 533570 tarek.fadlallah@bh.nomura.com 3 Monday 20th June, 2005 The Valuations The following list of thirty large stocks in Saudi Arabia offers the clearest indication of the regional overvaluation with an unweighted Price Earnings Ratio (PER) of 50.4x profits for 2004. COMPANY PRICE PER PBR YIELD MARKET CAP MARKET CAP (data as at 18th June, 2005) (SAR) (x) (x) (%) (SAR mn) ($ mn) SAUDI BASIC INDUSTRIES CORP 1124.0 31.6 11.2 0.80% 449,602 119,894 SAUDI TELECOM CO 940.0 30.3 9.1 2.77% 282,000 75,200 AL-RAJHI BANKING & INVST CRP 1627.0 49.9 20.2 1.11% 146,430 39,048 SAMBA FINANCIAL GROUP 914.0 43.8 11.6 1.53% 109,680 29,248 SAUDI ELECTRICITY CO 128.5 72.9 2.4 2.72% 107,081 28,555 RIYAD BANK 840.0 41.9 9.3 1.71% 84,000 22,400 ETIHAD ETISALAT CO 690.0 - - - 69,000 18,400 SAUDI BRITISH BANK 1306.8 39.9 12.1 1.45% 65,338 17,423 BANQUE SAUDI FRANSI 1275.8 37.4 10.4 1.57% 57,409 15,309 ARAB NATIONAL BANK 938.0 40.2 9.8 0.83% 46,900 12,507 SAVOLA 1575.0 78.4 21.3 0.57% 39,375 10,500 SAFCO 859.0 52.1 8.8 0.93% 34,360 9,163 SAUDI INVESTMENT BANK 889.0 52.1 8.7 0.27% 30,559 8,149 SAUDI HOLLANDI BANK 928.0 31.5 8.1 1.62% 23,386 6,236 MAKKAH CONS 781.0 - - - 22,620 6,032 SOUTHERN PROVINCE CEMENT 857.0 33.0 9.5 2.92% 17,997 4,799 YANBU CEMENT 791.0 38.8 8.2 2.53% 16,611 4,430 SAUDI CEMENT 784.0 36.6 8.2 2.17% 15,994 4,265 NATIONAL SHIPPING/SAUDI 330.5 30.9 6.2 1.51% 13,220 3,525 BANK AL-JAZIRA 827.0 62.5 8.3 0.41% 12,405 3,308 YAMAMAH SAUDI CEMENT 1318.0 21.9 8.8 2.28% 11,862 3,163 ARABIAN CEMENT 878.3 34.4 7.4 1.82% 10,539 2,810 EASTERN CEMENT 807.0 38.6 7.1 2.48% 10,410 2,776 TABUK CEMENT 595.0 64.8 9.1 1.26% 8,330 2,221 MEDICAL APPLIANCES 671.8 123.1 5.2 0.74% 8,061 2,150 AMIANTIT 517.0 98.0 9.7 - 7,962 2,123 THE QASSIM CEMENT 814.0 29.7 6.6 2.70% 7,326 1,954 NATIONAL GAS & INDUSTRIAL 487.0 60.6 6.5 1.23% 7,305 1,948 REAL ESTATE / SAUDI ARABIA 463.8 - - - 5,565 1,484 TAIBAH 359.5 85.7 4.7 1.11% 5,393 1,438 Source: Bloomberg Average 50.4 9.2 1.52% 1,726,719 460,458 In fairness the weighted PER (excluding loss-making firms) is 39.2x due to the influence of heavyweights SABIC (31x) and Saudi Telecom (30x) which are themselves expensive compared to their global peers. The earnings yield of 1.98% (1/50.4) and dividend yield of 1.52% are low by international standards and compared to the SAR discount rate of 3.95% while the Price to Book Ratio (PBR) of 9.2x is outrageous!
  • 4. P.O. Box 26893 Manama, Bahrain Telephone: +973 17 533570 tarek.fadlallah@bh.nomura.com 4 Monday 20th June, 2005 The Search for Value Building precise valuation models for the GCC markets in the midst of an evolutionary period is very complicated as it requires a clear understanding and an accurate evaluation of the ongoing changes. The aggregated impact of reform, deregulation, growing inward investment, rising domestic consumption, relaxed property rights for foreigners and the repatriation of regional wealth is difficult to assess. Nonetheless the GCC is not the first region to undergo economic transformation and there are some intuitive measures that can be used to evaluate whether markets are fairly valued in broad terms. Market capitalisation is one measure that – while dependent on the number and size of listed firms – offers some clues to guesstimate relative valuations although PERs and Yields are comparatively more objective. Saudi Arabia China Korea Brazil Mexico Russia S. Africa (TADAWUL) ('A' SHARES) (KOSPI) (BOVESPA) (BOLSA) (RTS INDEX) (ALL SHARE) GDP ($bn) 310.0 7,262.0 925.0 1,492.0 1,006.0 1,408.0 491.0 Market Cap ($bn) 480.0 375.8 448.2 213.4 153.6 153.0 343.9 Ratio (%) 155% 5% 48% 14% 15% 11% 70% PER(weighted) (x) 39.2 17.4 10.5 9.01 12.9 14.9 12.3 Div Yield (%) 1.5 2.1 2.5 24.7 1.7 2.3 2.8 Source: CIA Factbook, Bloomberg The Saudi Arabian market capitalisation (which excludes the publicly owned oil sector and many of the leading family firms that dominate the local economy) is now larger that the country’s GDP and implausibly greater than the Korean KOSPI, Brazilian BOVESPA, Mexican BOLSA, Russian RTS, South African ALL SHARE and the combined Shanghai and Shenzhen ‘A’ share indices. The comparative valuation of Saudi Telecom offers a further insight into the disparity that exists at the corporate level between Saudi stocks and global equities. Country Company PER PBR DIV YIELD China China Telecom 7.9 1.45 2.43 Korea SK Telecom 9.5 1.98 2.66 Brazil Tele Norte 11.5 1.87 6.78 Mexico Telefonos de Mexico 8.6 2.49 3.72 Russia Rostelecom 12.2 0.86 2.61 South Africa Telekom SA 9.1 2.84 4.51 Average 9.8 1.92 3.79 Saudi Arabia Saudi Telecom 30.3 9.12 2.77 (data as at 18th June, 2005) Source: Bloomberg Taking into account the average valuation of the six emerging market telecom companies it seems highly unlikely that Saudi Telecom is appropriately valued at current prices. Given current global valuations investors should consider PERs of 10x-15x as appropriate benchmark market multiples although certain high growth stocks would obviously justify premium multiples.
  • 5. P.O. Box 26893 Manama, Bahrain Telephone: +973 17 533570 tarek.fadlallah@bh.nomura.com 5 Monday 20th June, 2005 PER Fair Value? 0 5 10 15 20 25 30 35 40 45 2004 2005 2006 2007 2008 2009 2010 2011 2012 2013 2014 2015 2016 2017 2018 10% Growth 20% Growth 30% Growth Profits in Saudi Arabia have increased substantially in the past two years from a modest base but recent history may not provide an accurate guide as to how fast profits will grow in the future. Year 10% 20% 30% 2004 39.2 39.2 39.2 2005 35.6 32.7 30.2 2006 32.4 27.2 23.2 2007 29.5 22.7 17.8 2008 26.8 18.9 13.7 2009 24.3 15.8 10.6 2010 22.1 13.1 8.1 2011 20.1 10.9 6.2 2012 18.3 9.1 4.8 2013 16.6 7.6 3.7 2014 15.1 6.3 2.8 2015 13.7 5.3 2.2 2016 12.5 4.4 1.7 2017 11.4 3.7 1.3 2018 10.3 3.1 1.0 Annual Profit Growth Rates Naturally the timetable for suggested normalisation not only requires profits to rise as expected but also that stock prices remain unchanged for the duration of the adjustment phase. If stock prices were to rise or profits fail to grow as expected the adjustment process would take longer. Current valuations leave no margin for error. Nonetheless assuming a positive and bullish stance the table (left) and chart (below) offer a guide as to how valuations could develop and normalise assuming three base scenarios for profit growth. Under an aggressive scenario of 30% profit growth the market will achieve sensible PER valuations of between 15x-10x by 2007-09 whereas lower growth of 20% will require a further two years. Under the conservative and perhaps sensible assumption of 10% profit growth it will take until 2014-18 (up to thirteen years!) for PERs to correct toward historically sustainable levels.
  • 6. P.O. Box 26893 Manama, Bahrain Telephone: +973 17 533570 tarek.fadlallah@bh.nomura.com 6 Monday 20th June, 2005 The China Model The performance of the Chinese stock market offers an illuminating illustration of how highly valued markets can adjust even in a healthy macro-economic environment when profits are rising. In July 1994 the Shanghai A index that consists of Renminbi denominated local shares began a sharp rally propelled by the breathtaking pace of economic growth in China. By June 2001 the index had risen 700% from 330 points to a record 2,337 points as local investors celebrated China’s unprecedented period of double digit economic growth. Valuations also soared with the market earnings multiple reaching a flabbergasting 62x in August 2000 after which they began a downward adjustment which has taken five years and cut PERs to around 17x. 800 1000 1200 1400 1600 1800 2000 2200 2400 Dec-99 May-00 Oct-00 Mar-01 Aug-01 Jan-02 Jun-02 Nov-02 Apr-03 Sep-03 Feb-04 Jul-04 Dec-04 May-05 Shanghai A Share Index 10 20 30 40 50 60 70 P/E Ratio Economic Growth The adjustment was partly due to an increase in earnings but owed much to the fact that the stock market recorded a -55% decline during this period. China has shown that it is possible for stocks to decline in spite of a buoyant economy and rising profits if the starting point is high valuations. This multiple contraction phenomenon is typical in emerging markets and follows a period of rapid share price appreciation after investors have rushed to discount positive news well into the distant future.
  • 7. P.O. Box 26893 Manama, Bahrain Telephone: +973 17 533570 tarek.fadlallah@bh.nomura.com 7 Monday 20th June, 2005 Scope for Correction Excessive valuations can be adjusted either gradually through a drawn out period of sideways trading with a downside bias or by a sharp correction with a messy aftermath. And while it is possible that some of the GCC markets could correct gradually the nature of the rally and the frenzied retail activity suggests that the correction will be both sharp and painful. The use of leverage (either directly or indirectly) which has boosted the gains on the upside is likely to amplify the risks to the downside with the upside overshoot being matched by a downside overshoot. Since there are no technical signs that the GCC markets have peaked yet some investors may be tempted to take advantage of the rising price trend to hunt some eleventh-hour profits. Further gains among the GCC markets are certainly possible but an important lesson from the NASDAQ debacle is that timing the market peak is very difficult even in efficient markets. Unfortunately the trigger for a correction is rarely apparent except in hindsight and psychological factors often play a crucial role – sometimes stocks fall because they fell yesterday and might fall tomorrow. Furthermore once a post-bubble bear market is underway it can be both severe in depth and lengthy in duration depending on the nature of the excesses and the market mechanisms in place to deflate them. The Nikkei index fell -80% between December 1989 and April 2003 (one hundred and sixty months) while the more efficient NASDAQ index declined an equally dramatic -78% in just thirty one months! Strategy and Action Plan Exposure to the most blatantly overvalued markets in Saudi Arabia, the UAE and possibly Qatar should be aggressively reduced at current levels. Saudi Arabia UAE Kuwait Qatar Oman Bahrain TASI NBAD KSEI DSM MSM All Share 13,933 17,961 8,569 10,158 5,505 2,163 SELL SELL REDUCE REDUCE REDUCE REDUCE Source: Bloomberg Valuations in Kuwait, Bahrain and Oman appear reasonable if not cheap but these markets are unlikely to be excluded from any regional price adjustments even if they might avoid the worst. Notwithstanding the dire nature of this warning it may be prudent for investors to maintain some selective exposure to attractively priced stocks for long term investment purposes (or in case we are wrong)! Going forward local investors should consider a dollar averaging investment strategy in order to avoid buying the highs or missing the lows.
  • 8. P.O. Box 26893 Manama, Bahrain Telephone: +973 17 533570 tarek.fadlallah@bh.nomura.com 8 Monday 20th June, 2005 Conclusion The bearish call on GCC stocks is no reflection on the long term prospects for regional economic growth or the capabilities of local managers. Instead it is a statement about the disconnect that now exists between the real economy and the financial instruments that purport to represent them. The GCC markets had been undervalued prior to the invasion of Iraq but have now become overvalued as the initial euphoria and subsequent boom developed into what some might term “irrational exuberance”. It is possible that the GCC markets provide an exception to the rule but if history is to be repeated then the highs in the local markets may be imminent and may be followed by a period of severe declines. Beware. Red Alert. Regards Tarek Fadlallah, CFA IMPORTANT WARNING: PLEASE NOTE THAT THE PERSONAL OPINIONS EXPRESSED IN THIS NOTE ARE SOLEY THOSE OF THE AUTHOR AND DO NOT REFLECT ANY RECOMMENDATIONS OR ATTEMPT TO SOLICIT BUSINESS. THIS PUBLICATION HAS BEEN ISSUED BY THE SALES/TRADING DEPARTMENT OF NOMURA INVESTMENT BANKING (MIDDLE EAST) BSC AND IS PROVIDED WITHOUT COMPENSATION. THIS DOCUMENT IS NOT INTENDED FOR PRIVATE CUSTOMERS WITHIN THE RULES OF THE UK FINANCIAL SERVICES AUTHRORITY (FSA) OR THE BAHRAIN MONETARY AGENCY (BMA) AND IS NOT TO BE DISTRIUBTED WITHOUT PRIOR AUTHORISATION AND IS NOT INTENDED FOR PRIVATE INDIVIDUALS AND SHOULD NOT BE DISTRIBUTED AS SUCH NOR SHOULD IT BE COPIED TO ANY OTHER PERSON WITHOUT OUT EXPRESS CONSENT. THIS DOCUMENT SHOULD NOT BE CONSIDERED AN OFFER TO BUY OR SELL INVESTMENTS. WE ARE NOT YOUR INVESTMENT ADVISER AND THIS INFORMATION IS PROVIDED ON THE BASIS THAT YOU HAVE SUCH KNOWLEDGE AND EXPERIENCE TO EVALUATE ITS MERITS AMD RISKS AND ARE CAPABLE OF UNDERTAKING YOUR OWN OBJECTIVE ANALYSIS OF THE INVESTMENT AND ITS SUITABILITY TO MEET YOUR REQUIREMENTS. THE INFORMATION IS BASED ON SOURCES WE BELIEVE TO BE RELIABLE BUT WE DO NOT REPRESENT THAT IT IS ACCURATE OR COMPLETE. ANY VALUATIONS CONTAINED HEREIN ARE SUBJECT TO CHANGE WITHOUT NOTICE. NOMURA INVESTMENT BANKING (MIDDLE EAST) BSC AND/OR CONNECTED PERSONS DO NOT ACCEPT ANY LIABILITY WHATSOEVER FOR ANY DIRECT, INDIRECT, INCORRECT OR INCONSEQUENTIAL LOSS ARISING FOM ANY USE OF THE INFORMATION OR ITS CONTENT. NOMURA INVESTMENT BANKING (MIDDLE EAST) BSC IS AUTHORISED AND REGULATED BY THE BMA.