1. (A3)Beating Cancer: Impact of APOBEC3B
Expression on 5-Fluorouracil Treatment
Sydney Fine1, Artur Serebrenik2, Reuben Harris, Ph.D.1,2
University of Minnesota (LSSURP)1, University of Minnesota Department of Pharmacology2
Abstract
The APOBEC3 family of cytosine deaminases consists of seven
members that function as part of the innate immunity. One member,
APOBEC3B (A3B), is an endogenous source of mutation in cancer cells,
specifically in head/neck, lung, and breast cancers. A3B increases the rate
of mutation in DNA through its ability to deaminate cytosine into uracil.
The aim of this study was to determine if A3B over-expression synergizes
with 5-Fluorouracil (5-FU), an FDA-approved chemotherapeutic agent, to
promote cell death. 5-FU promotes cell death through two mechanisms.
First, 5-FU inhibits thymidylate synthase, an enzyme that converts
deoxyuridylate to deoxythymidylate. Second, 5-FU becomes incorporated
into DNA, which causes significant DNA damage. A3B was over-
expressed in a mammary epithelial cell line, MCF10A. Then, the cells
were treated with various concentrations of 5-FU. Cell viability in
response to 5-FU treatment was assessed by clonogenic survival assays,
which measure cells’ ability to proliferate. Up-regulation of A3B had little
to no effect on the efficacy of 5-FU. This research has implications in
regards to personalized treatment in cancer patients with A3B-high
tumors because treating these tumors with 5-FU may widen the
therapeutic window and allow for more effective disease treatment.
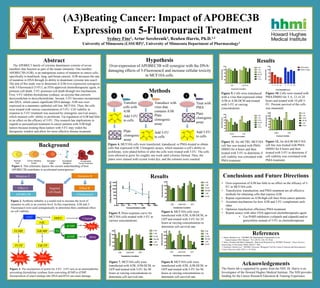
Results
Background
Conclusions and Future Directions
• Over-expression of A3B has little to no effect on the efficacy of 5-
FU in MCF10A cells
• Transfection, transduction, and PMA treatment are all effective
methods for obtaining cells that express A3B
• Repeat experiments on A3B-high cell lines from cancer patients
• Ascertain mechanism for how A3B and 5-FU complement each
other
• Optimize transfection efficiency/PMA treatment
• Repeat assays with other FDA-approved chemotherapeutic agent
• Use PARP-inhibitors (veliparib and oliparib) and/or
gemcitibine instead of 5-FU as chemotherapeutic
References
1. Burns, Michael et al. “APOBEC3B: Pathological Consequences of an
Innate Immune DNA Mutator.” 38.2 (2015): 102-110. Print.
2. Harris, Reuben and Mark Liddament. “Retroviral Restriction by APOBEC Proteins.” Nature Reviews
Immunology 4 (November 2004): 868-877. Web
3. Swanton, Charles et al. “APOBEC Enzymes: Mutagenic Fuel for Cancer Evolution and Heterogeneity.
Cancer Discovery (July 2015): 1-10. Print.
Acknowledgements
The Harris lab is supported by grants from the NIH. Dr. Harris is an
Investigator of the Howard Hughes Medical Institute. The NIH provides
funding for the Cancer Research Education & Training Experience.
Hypothesis
Over-expression of APOBEC3B will synergize with the DNA-
damaging effects of 5-Fluorouracil and increase cellular toxicity
in MCF10A cells.
Results
Figure 1. This schematic depicts the current understanding of how
APOBEC3B contributes to accelerated tumorigenesis.1
Figure 2. Synthetic lethality is a useful tool to increase the level of
mutation in cells to an extreme level. In this experiment, A3B and 5-
Fluorouracil were used synergistically to determine their combined effect
on cell viability.
Figure 3. The mechanism of action for 5-FU. 5-FU acts as an antimetabolite
preventing thymidylate synthase from converting dUMP to dTMP.
Incorporation of uracil analogs into DNA and RNA can cause damage.
APOBEC3B 5-Fluorouracil
Mutation A
Effect A
Mutation B
Effect BTargeted
Cell Death
5-FU
FUTP FdUTP
FUMP
RNA
damage
DNA
damage
FdUMP
FdU
DHFU
dUMP
dTMP DNA
Cleared
TS
DNA
Methods
Transfect
cells with
A3B
Add 5-FU
to cells
Plate
clonogenic
assay
Transduce with
virus that
contains A3B
1 2
Plate
clonogenic
assay
HN
O N
H
O
F
3
HN
O N
H
O
F
Treat with
PMA
Plate
clonogenic
assay
Add 5-FU
to cells
HN
O N
H
O
F
Add 5-FU
to cells
Figure 5. Dose-response curve for
MCF10A cells treated with 5-FU at
various concentrations.
Figure 7. MCF10A cells were
transfected with A3B, A3B-DCM, or
GFP and treated with 5-FU for 48
hours at varying concentrations to
determine cell survival rate.
Figure 10. Cells were treated with
PMA/DMSO for 3, 6, 12, or 24
hours and treated with 10 µM 5-
FU. Percent survival of the cells
was measured.
Figure 4. MCF10A cells were transfected, transduced, or PMA-treated to obtain
cells that expressed A3B. Clonogenic assays, which measure a cell’s ability to
proliferate, were plated before or after the cells were treated with 5-FU. The cells
were allowed to grow for roughly one week until colonies formed. Then, the
plates were stained with crystal violet dye, and the colonies were counted.
Figure 6. MCF10A cells were
transfected with A3B, A3B-DCM, or
GFP and treated with 5-FU for 24
hours at varying concentrations to
determine cell survival rate.
1
2
3
0
25
50
75
100
125
Transfection Condition
PercentSurvival
MCF10A Survival: Transfection + 24hr 5-FU
0 nM
1 nM
10 nM
100 nM
1 uM
10 uM
A3B A3B-DCM GFP
1
2
3
0
25
50
75
100
125
Transfection Condition
PercentSurvival
MCF10A Survival: Transfection + 48hr 5-FU
0 nM
1 nM
10 nM
100 nM
1 uM
10 uM
A3B A3B-DCM GFP
1
2
3
0
25
50
75
100
125
Transfection Condition
PercentSurvival
Transfection+96hrs5FU
0 nM
1 nM
10 nM
100 nM
1 uM
10 uM
A3B A3B-DCM GFP
1
2
0
25
50
75
100
125
Transduction Condition
PercentSurvival
MCF10A Survival: Transduction + 5-FU
0 nM
1 nM
10 nM
100 nM
1 uM
10 uM
A3B A3B-DCM
1
2
0
25
50
75
100
125
150
Treatment Condition
PercentSurvival
MCF10A Survivial: shCTRL+PMA/DMSO+5-FU
0 nM
1 nM
10 nM
100 nM
1 uM
10 uM
DMSO PMA
1
2
0
25
50
75
100
125
150
Treatment Condition
PercentSurvival
MCF10A Survival: shA3B+PMA/DMSO+5-FU
0 nM
1 nM
10 nM
100 nM
1 uM
10 uM
DMSO PMA
Figure 8. MCF10A cells were
transfected with A3B, A3B-DCM, or
GFP and treated with 5-FU for 96
hours at varying concentrations to
determine cell survival rate.
Figure 9. Cells were transduced
with a virus that expressed either
A3B or A3B-DCM and treated
with 5-FU at varying
concentrations.
Figure 11. An shCTRL MCF10A
cell line was treated with PMA/
DMSO for 6 hours and then
treated with 5-FU to determine if
cell viability was correlated with
PMA treatment.
Figure 12. An shA3B MCF10A
cell line was treated with PMA/
DMSO for 6 hours and then
treated with 5-FU to determine if
cell viability was correlated with
PMA treatment.
1
2
3
4
1
2
3
4
0
25
50
75
100
125
Time PMA/DMSO (hrs)
PercentSurvival
PMA Treated
DMSO Treated
MCF10A Survival: PMA/DMSO treatment + 5-FU (10 uM)
3 36 612 1224 24
0.001 0.01 0.1 1 10 100 1000
75
85
95
105
115
125
Concentration (uM)
ColonySurvivalRate(%)
MCF10A Survival: Dose-Response Curve 5-FU