Polkadot JAM Slides - Token2049 - By Dr. Gavin Wood
Purchasing Managers´Index Report, August 2011
1. Purchasing Managers’ Index Sep. 02, 2011
PMI drops to 48.7 in August 2011 – marked slowdown in the
industrial economy
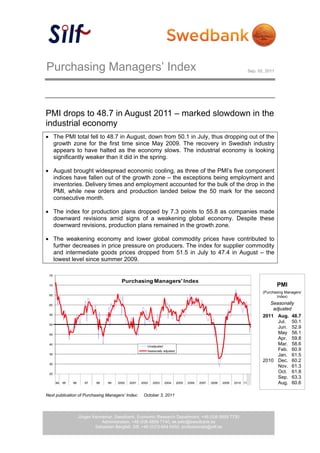
The PMI total fell to 48.7 in August, down from 50.1 in July, thus dropping out of the
growth zone for the first time since May 2009. The recovery in Swedish industry
appears to have halted as the economy slows. The industrial economy is looking
significantly weaker than it did in the spring.
August brought widespread economic cooling, as three of the PMI’s five component
indices have fallen out of the growth zone – the exceptions being employment and
inventories. Delivery times and employment accounted for the bulk of the drop in the
PMI, while new orders and production landed below the 50 mark for the second
consecutive month.
The index for production plans dropped by 7.3 points to 55.8 as companies made
downward revisions amid signs of a weakening global economy. Despite these
downward revisions, production plans remained in the growth zone.
The weakening economy and lower global commodity prices have contributed to
further decreases in price pressure on producers. The index for supplier commodity
and intermediate goods prices dropped from 51.5 in July to 47.4 in August – the
lowest level since summer 2009.
75
Purchasing Managers' Index
70 PMI
(Purchasing Managers’
65
Index)
60 Seasonally
adjusted
55
2011 Aug. 48.7
Jul. 50.1
50
Jun. 52.9
45 May 56.1
Apr. 59.8
40
Unadjusted
Mar. 58.6
Seasonally adjusted Feb. 60.9
35 Jan. 61.5
2010 Dec. 60.2
30
Nov. 61.3
25
Oct. 61.8
Sep. 63.3
94 95 96 97 98 99 2000 2001 2002 2003 2004 2005 2006 2007 2008 2009 2010 11 Aug. 60.6
Next publication of Purchasing Managers’ Index: October 3, 2011
Jörgen Kennemar, Swedbank, Economic Research Department, +46 (0)8-5859 7730
Administration, +46 (0)8-5859 7740, ek.sekr@swedbank.se
Sebastian Bergfelt, Silf, +46 (0)73-944 6450, professionals@silf.se
1 (4)
4. Silf/Swedbank’s
Purchasing Managers’ Index
- objectives and methodology
History Silf (earlier I&L) and Swedbank AB. publ. (at that time Sparbanken Sweden)
make the first joint – internal – calculation of the “Purchasing Managers’ Index” for
the five indexes (PMI) in December 1994. Exactly one year later, the index was
publicly announced for the first time. In Sweden the Purchasing Managers’ Index
is known as the ICI index. The model for PMI is the ISM index (Institute for Supply
Management, formerly known as the NAPM index) – one of the most highly
regarded and well-recognized economic indicators in the United States. The ISM
index has existed since 1931 in the form of its predecessor, the NAPM index.
Participants About 200 purchasing managers in the manufacturing industry.
Publication First weekday of each month. 8:30 am.
Analysis Period Comparison with previous month.
Composition of PMI (%) New orders (within the company) 30
Production (within the company) 25
Employment (within the company) 20
Suppliers’ Delivery Times 15
Inventories (purchased material) 10
Other leading indicators New Export Orders
(not included in PMI) New Domestic Orders
Backlog of Orders
Suppliers’ commodity and intermediate goods prices
Imports
Production Plans next six months
Other questions Reason for higher/lower inventories level
Important commodities and intermediate goods with rising/falling prices
Objective Quick economic indicator
Simple statistics
Statistics with relatively short publication intervals
Constant contact with well-informed professional group
Calculation According to “diffusion index”. Positive changes are noted in percent for the five
sub indexes. The percentage of unchanged replies, multiplied by 0.5, is added to
this figure. Then the different sub indexes are weighted as described above to
reach the total index. The Purchasing Managers’ Index does not indicate activity
levels but rather monthly changes in industrial activity.
“Break-even” The dividing line between growth and decline – in line with US praxis – has been
drawn at a total index of 50. However, this boundary or “neutral growth zone”
should not be applied excessively. Rather, “Break-even” at 50 indicates a target
value.
We believe we have used reliable sources and procedures to generate and analyze the Purchasing Managers’ Index (PMI –
in Sweden ICI). However, Swedbank AB (publ) and SILF (earlier Organisationen för Inköp och Logistik, /I&L/ – The
Organization for Purchasing and Logistics) cannot guarantee the accuracy or completeness of the analyses and cannot be
responsible for any errors or omissions in the basic data or processing thereof. The reader should base any decisions on
other background material as well.
Swedbank AB (publ), SILF. their employees, and other coworkers accept no liability whatsoever for any direct or
consequential loss or injury of any kind arising from any errors or omissions in the analyses presented in the Purchasing
Managers’ Index.
4 (4)