SlideShare a Scribd company logo
1 of 4
Download to read offline
Energy & Commodities
Monthly newsletter from Swedbank’s Economic Research Department
by Jörgen Kennemar                                                                                         No. 1 • 12 January 2011


Higher energy and food prices lift Swedbank’s Commodity Price Index
       • Commodity prices accelerated during the second half of 2010. By December
         Swedbank’s Total Commodity Price Index had risen by slightly over 20%
         compared with six months earlier. Energy and food posted the biggest gains.
         Stronger global demand and tighter supply conditions in several commodity
         markets are having a growing impact. In the euro zone, the increase in
         commodity prices was even higher due to the weaker euro.
       • We expect commodity prices to continue to rise in 2011, though at a weaker
         pace, partly because last year’s huge inventory build-up is being reduced and
         China’s expansion is slowing. A continuation of the Fed’s and ECB’s
         expansive monetary policies will keep liquidity in the financial markets high,
         however, which in turn will keep investors interested in commodity-related
         investments. At the same time too fast a price increase could threaten the
         economic recovery and add to inflation pressures in many countries.
                                                   Swedbanks Commodity Price Index, USD

                     500
                           2000=100
                     450

                     400

                     350

                     300
             Index


                                                                 Energy raw materials
                     250
                                                  Total index
                     200      Total index exclusive energy commodities
                     150

                     100                                                        Food

                     50
                            00        01     02       03        04       05       06    07     08     09        10
                                                                                                           Source: Swedbank


In December 2010 Swedbank’s Total Commodity                                   commodities. Since October 2010 the US
Price Index rose by 5.8% in USD compared with                                 currency has risen by 5% against the euro at the
the previous month, further accelerating                                      same time that the index has gained 9% in USD.
commodity prices during the last quarter of the
year. As a result, the Commodity Price Index                                  The weaker euro has exacerbated the increase in
reached its highest level in over two years despite                           commodity prices, creating higher inflation, not
a stronger dollar, contrary to the historic and                               least in countries where energy and food
negative connection between the dollar and                                    consumption weigh heavily. The highest inflation


                      Economic Research Department. Swedbank AB. SE-105 34 Stockholm. Phone +46-8-5859 1000.
                                           E-mail: ek.sekr@swedbank.se www.swedbank.se
                                 Legally responsible publisher: Cecilia Hermansson. +46-8-5859 7720.
                                Magnus Alvesson. +46-8-5859 3341. Jörgen Kennemar. +46-8-5859 7730.
Energy & Commodities
                                                    Monthly newsletter from Swedbank’s Economic Research Department, continued

                                                                                                             No. 1 • 12 January 2011


in the EU in November was in Romania (7.7%),                                                                                     100 dollar, which could jeopardise the global
Estonia (5.0%) and Greece (4.8%).                                                                                                recovery.

   Swedbanks Commodity Price Index in different currencies                                                                                            Oil price and average forecast for 2011-2012 in USD

                                                                                                                                              150
150
                                                                                                                                              140
                                                                                                                                              130
140                                                                                                                                           120
                                                                                                    EUR
                                                                                                                                              110
                                                                                                                                              100


                                                                                                                                 USD/Barrel
130
                                                                                                                                               90
                                                                                                                                               80
120
                                                                                                                                               70
                                                                                                                                               60
                                                                                                                   SEK
110                                                                                                                                            50
                                                                                                                                               40

100
                                                                            USD                                                                30
                                                                                                                                                          05            06           07               08             09           10           11                 12
                                                                                                                                                                                                                                               Källa: Swedbank, Reuters EcoWin

 90
      12


                                                                                                10


                                                                                                          11


                                                                                                                   12
                1


                         2


                                  3


                                           4


                                                    5


                                                             6


                                                                      7


                                                                               8


                                                                                        9
                m


                         m


                                  m


                                           m


                                                    m


                                                             m


                                                                      m


                                                                               m


                                                                                        m


                                                                                                                                 The major increase in food prices, which began
     m


                                                                                                m


                                                                                                         m


                                                                                                                   m
              10


                       10


                                10


                                         10


                                                  10


                                                           10


                                                                    10


                                                                             10


                                                                                      10
   09


                                                                                              10


                                                                                                       10


                                                                                                                 10
           20


                    20


                             20


                                      20


                                               20


                                                        20


                                                                 20


                                                                          20


                                                                                   20
 20


                                                                                            20


                                                                                                     20


                                                                                                               20


                                                                                                                                 last summer, continued in December, when the
                                                                                                                                 food price index rose by 6.0% compared with
Prices of energy commodities again began to                                                                                      November. This means that food prices have
accelerate in November and December. On                                                                                          risen by 26% in 12 months. Grain prices, which
average, oil rose by 6.5% in December, while the                                                                                 rose significantly in September and October,
price of coal climbed by no less than 11.8%. The                                                                                 stabilised temporarily in November before
big increase is partly due to the cold winter and                                                                                accelerating again in December. Other food
historic floods in Australia. A substantial drop in                                                                              products such as coffee, oilseeds and beverages
coal production in Australia, which accounts for                                                                                 have become more expensive, which taken
around 40% of the world's total coke production,                                                                                 together are putting pressure on household
could lead to a coal shortage, which would                                                                                       consumption. Lower food production owing to
especially hurt the steel industry – and the energy                                                                              unfavourable weather conditions is a main reason
sector as well. Coal plays a vital role in global                                                                                why inventories are lower than expected. Political
energy production, particularly for emerging Asian                                                                               decisions such as the export caps in Russia and
economies. The fact that global oil consumption                                                                                  Ukraine to ensure domestic food supplies have
will rise faster in 2011 not only in emerging                                                                                    further tightened supply conditions, which also
economies but also in OECD countries, which                                                                                      tends to lead to increased speculation. We expect
account for around 60% of global consumption, is                                                                                 the increase in food commodity prices to slow in
also driving prices higher. We expect the average                                                                                2011, when global production rises and the
price of oil to rise from USD 80 a barrel last year                                                                              temporary impact of weather conditions fades.
to USD 87 in 2011, even though the momentum in                                                                                   The price increase in the latter part of 2010
global GDP growth will be lower than last year. If                                                                               means, however, that the average increase will be
the dollar continues to appreciate, as expected,                                                                                 greater this year than last. Global food supplies
the price increase will be higher in euro terms,                                                                                 are proving highly vulnerable to production
with the risk of rising inflation, especially in                                                                                 disruptions at the same time that global demand is
countries where energy consumption weighs                                                                                        trending higher as the purchasing power of
heavily in the consumption basket.                                                                                               population-dense economies strengthens and
                                                                                                                                 economic prospects brighten.
This probably means that today’s high oil price of
just over USD 95 is temporary and that it will fall                                                                                            Price development for different food commodities, in USD
when this unusually cold season ends and
warmer weather returns. At the same time the oil                                                                                              180
                                                                                                                                                     2008-12-31=100

market is still facing excess supply, even though                                                                                             170


inventories have dropped in recent months, which                                                                                              160

                                                                                                                                              150                                                 Sugar, beverages
indicates that the price gains have also been the
                                                                                                                                              140
result of increased expectations and speculation.                                                                                                                                        Food prices, total
                                                                                                                                 Index


                                                                                                                                              130
Global pressure on OPEC countries, which                                                                                                      120

provide over 35% of global production, to raise                                                                                               110

production levels is likely to mount if oil prices                                                                                            100
                                                                                                                                                                                            Cereals
should stabilise at current levels or reach USD                                                                                                90
                                                                                                                                                    jan   mar   maj    jul   sep   nov    jan   mar    maj     jul   sep   nov   jan   mar   maj    jul     sep     nov
                                                                                                                                                                      08                                      09                                   10
                                                                                                                                                                                                                                                       Source: Reuters EcoWin


                                                                                                                         2 (4)
Energy & Commodities
                      Monthly newsletter from Swedbank’s Economic Research Department, continued

                                               No. 1 • 12 January 2011


Other than foods, metals posted the strongest                   the debt crisis’s impact on the macro economy
price gains in 2010, although there are relatively              isn’t over yet. Gold’s status as a safe haven
big differences between product groups. Among                   among financial investors is likely to continue as
metals, nickel and copper rose the most (by                     long as global imbalances remain. Silver’s use in
41.6% and 31.1%, respectively) between                          an increasing number of commercial applications,
December 2009 and December 2010. Zinc and                       thanks in no small part to its favourable physical
lead, on the other hand, have been the weakest in               properties, has led to higher price levels. There is
the group. Although the price of iron ore has fallen            still a long way to go to reach the 1980 level,
for two consecutive months in USD, it is still over             however, when the price of silver reached USD 48
70% higher than in 2009. We expect metal prices                 per troy ounce for a short period of time.
to continue to rise in 2011, though at a slower                 Geologists are warning of a future silver shortage
pace as global inventories shrink. Ferrous metals               if the current increase in consumption continues.
rose by 35% in USD last year and are expected to                We feel that today’s price increase rests more on
increase by an average of 8-12% this year.                      fundamentals.
Metals, where supply conditions are limited, have
the biggest potential for further price increases.              In addition to changes in supply and demand,
Copper and tin inventories have fallen to the                   commodity prices are increasingly affected by
lowest levels since 2008. The expected rise in                  financial flows. Low nominal interest rates have
metal prices is based, however, on the continued                led to rapidly expanding liquidity in global financial
strong expansion of the Chinese economy, which                  markets, where an increasing share of investment
accounts for slightly over 40% of global metal                  capital is turning to commodity markets. This
consumption. Government concerns about the                      tends to drive up prices even further, especially
high inflation rate (5.1% in November) and rapidly              when there are fundamental imbalances. Our
rising asset prices have led to several austerity               expectation of unchanged benchmark interest
packages, and more are likely in the year ahead.                rates in the US and in EMU countries in 2011 and
The effect of austerity policies on the Chinese                 further unconventional measures in the form of
economy and commodity demand could lead to                      central banks’ bond purchases would mean
increased volatility in global commodity markets.               continued high liquidity in the global financial
                                                                market, which should also drive up commodity
Among precious metals, silver continues to rise in              prices unless the global economy proves weaker
price, while gold has stabilised at a high level of             than expected.
just under USD 1 400 per troy ounce. Although
gold is under pressure from the stronger dollar,                                                   Jörgen Kennemar
there is still an underlying demand, not least due
to growing inflation concerns, the same time that


                                                        3 (4)
Energy & Commodities
                                      Monthly newsletter from Swedbank’s Economic Research Department, continued

                                                                      No. 1 • 12 January 2011


Swedbank Commodity Index                                              - US$ -              Swedbank Commodity Index                                             - SKr -
Basis 2000 = 1oo                                                        12/01/11           Basis 2000 = 1oo                                                      12/01/11
                                               10.2010      11.2010     12.2010                                                         10.2010      11.2010      12.2010
Total index                                      288.2        297.1       314.2            Total index                                    209.0        220.3        233.6
                 Per cent change month ago         5.5          3.1         5.8                             Per cent change month ago      -0.2          5.4          6.1
                 Per cent change year ago         17.8         16.5        25.0                             Per cent change year ago       13.1         14.8         19.7
Total index exclusive energy                     279.4        283.8       292.7            Total index exclusive energy                   202.6        210.4        217.6
                 Per cent change month ago         2.1          1.6         3.1                             Per cent change month ago      -3.4          3.9          3.4
                 Per cent change year ago         35.6         34.3        33.2                             Per cent change year ago       30.2         32.3         27.6
    Food, tropical beverages                     256.7        270.1       286.2                Food, tropical beverages                   186.1        200.2        212.8
                 Per cent change month ago         4.4          5.2         6.0                             Per cent change month ago      -1.2          7.6          6.3
                 Per cent change year ago         19.3         23.4        26.1                             Per cent change year ago       14.5         21.6         20.8
        Cereals                                  252.5        257.1       278.9                    Cereals                                183.1        190.6        207.4
                 Per cent change month ago         5.2          1.8         8.5                             Per cent change month ago      -0.5          4.1          8.8
                 Per cent change year ago         34.9         29.7        36.2                             Per cent change year ago       29.4         27.8         30.5
        Tropical beverages and tobacco           270.9        285.2       301.5                    Tropical beverages and tobacco         196.4        211.4        224.2
                 Per cent change month ago         2.5          5.3         5.7                             Per cent change month ago      -3.1          7.6          6.0
                 Per cent change year ago         14.4         21.1        22.5                             Per cent change year ago        9.8         19.4         17.4
            Coffee                               161.6        173.9       183.8                        Coffee                             117.2        128.9        136.7
                 Per cent change month ago        -1.2          7.6         5.7                             Per cent change month ago      -6.5         10.0          6.0
                 Per cent change year ago         33.4         45.3        47.0                             Per cent change year ago       28.1         43.2         40.9
        Oilseeds and oil                         228.7        246.1       258.0                    Oilseeds and oil                       165.8        182.4        191.8
                 Per cent change month ago         9.1          7.6         4.8                             Per cent change month ago       3.2         10.0          5.1
                 Per cent change year ago         22.4         25.2        28.7                             Per cent change year ago       17.4         23.4         23.3
    Industrial raw materials                     286.0        287.8       294.6                Industrial raw materials                   207.4        213.3        219.0
                 Per cent change month ago         1.5          0.6         2.3                             Per cent change month ago      -4.0          2.9          2.6
                 Per cent change year ago         40.6         37.6        35.4                             Per cent change year ago       35.0         35.6         29.7
        Agricultural raw materials               185.7        190.7       193.2                    Agricultural raw materials             134.6        141.4        143.6
                 Per cent change month ago         6.1          2.7         1.3                             Per cent change month ago       0.4          5.0          1.6
                 Per cent change year ago         27.4         24.8        23.1                             Per cent change year ago       22.2         23.0         18.0
            Cotton                               112.5        132.0       140.8                        Cotton                              81.6         97.9        104.7
                 Per cent change month ago        16.2         17.3         6.7                             Per cent change month ago      10.0         20.0          7.0
                 Per cent change year ago         71.5         92.1        88.5                             Per cent change year ago       64.6         89.4         80.6
            Softwood                             153.5        149.3       144.6                        Softwood                           111.3        110.7        107.5
                 Per cent change month ago         2.9         -2.7        -3.1                             Per cent change month ago      -2.7         -0.5         -2.9
                 Per cent change year ago         13.5          6.5         3.4                             Per cent change year ago        8.9          5.0         -0.9
            Woodpulp                             966.4        956.9       949.8                        Woodpulp                           700.6        709.4        706.2
                 Per cent change month ago        -0.6         -1.0        -0.7                             Per cent change month ago      -6.0          1.2         -0.5
                 Per cent change year ago         30.4         23.9        19.3                             Per cent change year ago       25.1         22.1         14.3
        Non-ferrous metals                       263.7        264.0       275.6                    Non-ferrous metals                     191.2        195.7        204.9
                 Per cent change month ago         8.1          0.1         4.4                             Per cent change month ago       2.3          2.4          4.7
                 Per cent change year ago         28.6         24.4        22.2                             Per cent change year ago       23.4         22.6         17.0
            Copper                              8291.8       8469.1      9130.1                        Copper                            6011.6       6278.2       6788.0
                 Per cent change month ago         7.6          2.1         7.8                             Per cent change month ago       1.8          4.4          8.1
                 Per cent change year ago         31.9         26.9        31.1                             Per cent change year ago       26.6         25.0         25.6
            Aluminium                           2346.1       2332.6      2347.4                        Aluminium                         1700.9       1729.2       1745.2
                 Per cent change month ago         8.5         -0.6         0.6                             Per cent change month ago       2.7          1.7          0.9
                 Per cent change year ago         24.9         19.7         7.8                             Per cent change year ago       19.9         18.0          3.2
            Lead                                2379.0       2376.1      2404.9                        Lead                              1724.8       1761.4       1788.0
                 Per cent change month ago         8.9         -0.1         1.2                             Per cent change month ago       3.1          2.1          1.5
                 Per cent change year ago          6.2          2.9         3.5                             Per cent change year ago        1.9          1.5         -0.9
            Zinc                                2371.8       2291.1      2272.7                        Zinc                              1719.6       1698.4       1689.7
                 Per cent change month ago        10.3         -3.4        -0.8                             Per cent change month ago       4.3         -1.2         -0.5
                 Per cent change year ago         14.5          4.5        -3.9                             Per cent change year ago        9.9          3.0         -8.0
            Nickel                             23802.0      22905.5     24055.5                        Nickel                           17256.5      16979.9      17884.7
                 Per cent change month ago         5.1         -3.8         5.0                             Per cent change month ago      -0.5         -1.6          5.3
                 Per cent change year ago         28.5         34.8        41.6                             Per cent change year ago       23.3         32.9         35.6
        Iron ore, steel scrap                    605.3        603.0       607.0                    Iron ore, steel scrap                  438.8        447.0        451.3
                 Per cent change month ago        -8.6         -0.4         0.7                             Per cent change month ago     -13.5          1.9          1.0
                 Per cent change year ago         75.0         75.0        73.4                             Per cent change year ago       68.0         72.5         66.1
    Energy raw materials                         292.1        303.0       323.8                Energy raw materials                       211.8        224.6        240.7
                 Per cent change month ago         7.1          3.7         6.8                             Per cent change month ago       1.3          6.1          7.2
                 Per cent change year ago         11.6         10.4        21.9                             Per cent change year ago        7.1          8.8         16.8
        Coking coal                              369.2        406.7       454.7                    Coking coal                            267.7        301.5        338.1
                 Per cent change month ago         4.1         10.2        11.8                             Per cent change month ago      -1.6         12.6         12.1
                 Per cent change year ago         36.8         38.6        48.5                             Per cent change year ago       31.3         36.6         42.3
        Crude oil                                288.6        298.3       317.8                    Crude oil                              209.2        221.1        236.3
                 Per cent change month ago         7.2          3.4         6.5                             Per cent change month ago       1.5          5.7          6.8
                 Per cent change year ago         10.4          9.0        20.5                             Per cent change year ago        6.0          7.4         15.5

Source : SWEDBANK and HWWA-Institute for Economic Research Hamburg                         Source : SWEDBANK and HWWA-Institute for Economic Research Hamburg


Swedbank
Economic Research Department                             Swedbank’s monthly Energy & Commodities newsletter is published as a service to our
                                                         customers. We believe that we have used reliable sources and methods in the preparation
SE-105 34 Stockholm, Sweden                              of the analyses reported in this publication. However, we cannot guarantee the accuracy or
Phone +46-8-5859 7740                                    completeness of the report and cannot be held responsible for any error or omission in the
ek.sekr@swedbank.se                                      underlying material or its use. Readers are encouraged to base any (investment) decisions
www.swedbank.se                                          on other material as well. Neither Swedbank nor its employees may be held responsible for
Legally responsible publisher                            losses or damages, direct or indirect, owing to any errors or omissions in Swedbank’s
Cecilia Hermansson, +46-88-5859 7720                     monthly Energy & Commodities newsletter.
Magnus Alvesson, +46-8-5859 3341
Jörgen Kennemar, +46-8-5859 7730


                                                                                   4 (4)

More Related Content

What's hot

“It wasn’t the end of the world…so what now?” – Investec
“It wasn’t the end of the world…so what now?” – Investec“It wasn’t the end of the world…so what now?” – Investec
“It wasn’t the end of the world…so what now?” – InvestecSenate Group Financial Advisors
 
Recent developments in the canadian economy dec2011
Recent developments in the canadian economy   dec2011Recent developments in the canadian economy   dec2011
Recent developments in the canadian economy dec2011Sam Batarseh
 
Economic Indicators January 2013
Economic Indicators January 2013Economic Indicators January 2013
Economic Indicators January 2013SappiHouston
 
Summary of AUGUST 2010 Existing Home Sales Statistics
Summary of AUGUST 2010 Existing Home Sales StatisticsSummary of AUGUST 2010 Existing Home Sales Statistics
Summary of AUGUST 2010 Existing Home Sales StatisticsNAR Research
 
Outlook for the Norwegian Economy
Outlook for the Norwegian EconomyOutlook for the Norwegian Economy
Outlook for the Norwegian EconomyIvararthur
 
1-800-PetMeds September 2011 Business Plan
1-800-PetMeds September 2011 Business Plan1-800-PetMeds September 2011 Business Plan
1-800-PetMeds September 2011 Business PlanPet Meds
 
Summary of Existing Home Sales for July 2010
Summary of Existing Home Sales for July 2010Summary of Existing Home Sales for July 2010
Summary of Existing Home Sales for July 2010NAR Research
 
World Economic Situation And Prospects 2009 2010
World Economic Situation And Prospects 2009 2010World Economic Situation And Prospects 2009 2010
World Economic Situation And Prospects 2009 2010icgfmconference
 
Economic indicators - Economic Monthly Overvies November 2012
Economic indicators - Economic Monthly Overvies November 2012Economic indicators - Economic Monthly Overvies November 2012
Economic indicators - Economic Monthly Overvies November 2012SappiHouston
 

What's hot (10)

“It wasn’t the end of the world…so what now?” – Investec
“It wasn’t the end of the world…so what now?” – Investec“It wasn’t the end of the world…so what now?” – Investec
“It wasn’t the end of the world…so what now?” – Investec
 
Recent developments in the canadian economy dec2011
Recent developments in the canadian economy   dec2011Recent developments in the canadian economy   dec2011
Recent developments in the canadian economy dec2011
 
Economic Indicators January 2013
Economic Indicators January 2013Economic Indicators January 2013
Economic Indicators January 2013
 
World Economic Situation and Prospects: Monthly Briefing, No. 35
World Economic Situation and Prospects: Monthly Briefing, No. 35World Economic Situation and Prospects: Monthly Briefing, No. 35
World Economic Situation and Prospects: Monthly Briefing, No. 35
 
Summary of AUGUST 2010 Existing Home Sales Statistics
Summary of AUGUST 2010 Existing Home Sales StatisticsSummary of AUGUST 2010 Existing Home Sales Statistics
Summary of AUGUST 2010 Existing Home Sales Statistics
 
Outlook for the Norwegian Economy
Outlook for the Norwegian EconomyOutlook for the Norwegian Economy
Outlook for the Norwegian Economy
 
1-800-PetMeds September 2011 Business Plan
1-800-PetMeds September 2011 Business Plan1-800-PetMeds September 2011 Business Plan
1-800-PetMeds September 2011 Business Plan
 
Summary of Existing Home Sales for July 2010
Summary of Existing Home Sales for July 2010Summary of Existing Home Sales for July 2010
Summary of Existing Home Sales for July 2010
 
World Economic Situation And Prospects 2009 2010
World Economic Situation And Prospects 2009 2010World Economic Situation And Prospects 2009 2010
World Economic Situation And Prospects 2009 2010
 
Economic indicators - Economic Monthly Overvies November 2012
Economic indicators - Economic Monthly Overvies November 2012Economic indicators - Economic Monthly Overvies November 2012
Economic indicators - Economic Monthly Overvies November 2012
 

Viewers also liked

The Global Economy No. 6 - September 22, 2011
The Global Economy No. 6 -  September 22, 2011The Global Economy No. 6 -  September 22, 2011
The Global Economy No. 6 - September 22, 2011Swedbank
 
Purchasing Managers Index - May 1 2013
Purchasing Managers Index - May 1 2013Purchasing Managers Index - May 1 2013
Purchasing Managers Index - May 1 2013Swedbank
 
The Latvian Economy - No 5, June 29, 2011
The Latvian Economy - No 5, June 29, 2011The Latvian Economy - No 5, June 29, 2011
The Latvian Economy - No 5, June 29, 2011Swedbank
 
Swedbanks first quarter results 2011 CEO presentation
Swedbanks first quarter results 2011 CEO presentation Swedbanks first quarter results 2011 CEO presentation
Swedbanks first quarter results 2011 CEO presentation Swedbank
 
Capital markets day 2008 - Kjell Hedman
Capital markets day 2008 - Kjell HedmanCapital markets day 2008 - Kjell Hedman
Capital markets day 2008 - Kjell HedmanSwedbank
 
Transcript conference call Q4 2009
Transcript conference call Q4 2009Transcript conference call Q4 2009
Transcript conference call Q4 2009Swedbank
 
Purchasing Managers' Index - Services
Purchasing Managers' Index - ServicesPurchasing Managers' Index - Services
Purchasing Managers' Index - ServicesSwedbank
 
Swedbank Analysis Lithuania 2010
Swedbank Analysis Lithuania 2010Swedbank Analysis Lithuania 2010
Swedbank Analysis Lithuania 2010Swedbank
 
Swedbank Economic Outlook 29 September 2009
Swedbank Economic Outlook 29 September 2009Swedbank Economic Outlook 29 September 2009
Swedbank Economic Outlook 29 September 2009Swedbank
 
Swedbank Corporate presentation Q4 2010
Swedbank Corporate presentation Q4 2010Swedbank Corporate presentation Q4 2010
Swedbank Corporate presentation Q4 2010Swedbank
 
Purchasing Managers´ Index Services, October 2011
Purchasing Managers´ Index Services, October 2011Purchasing Managers´ Index Services, October 2011
Purchasing Managers´ Index Services, October 2011Swedbank
 
Roadshow, Lehman Brothers Global Financial Services Conference
Roadshow, Lehman Brothers Global Financial Services ConferenceRoadshow, Lehman Brothers Global Financial Services Conference
Roadshow, Lehman Brothers Global Financial Services ConferenceSwedbank
 
Q1 2008 Transcript Conference Call
Q1 2008 Transcript Conference CallQ1 2008 Transcript Conference Call
Q1 2008 Transcript Conference CallSwedbank
 
Baltic Outlook January 2009
Baltic Outlook January 2009Baltic Outlook January 2009
Baltic Outlook January 2009Swedbank
 
Swedbanks företagspresentation kvartal 1 2013
Swedbanks företagspresentation kvartal 1 2013Swedbanks företagspresentation kvartal 1 2013
Swedbanks företagspresentation kvartal 1 2013Swedbank
 
Handelsbanken - Nordic Large Cap seminar 2010
Handelsbanken - Nordic Large Cap seminar 2010Handelsbanken - Nordic Large Cap seminar 2010
Handelsbanken - Nordic Large Cap seminar 2010Swedbank
 
The Baltic Outlook: Update, July 2009
The Baltic Outlook: Update, July 2009 The Baltic Outlook: Update, July 2009
The Baltic Outlook: Update, July 2009 Swedbank
 
The Baltic Outlook: Update, July 2009
The Baltic Outlook: Update, July 2009The Baltic Outlook: Update, July 2009
The Baltic Outlook: Update, July 2009Swedbank
 
CEO presentation of Q1 2008 results
CEO presentation of Q1 2008 resultsCEO presentation of Q1 2008 results
CEO presentation of Q1 2008 resultsSwedbank
 
Swedbank företagspresentation, mars 2010
Swedbank företagspresentation, mars 2010Swedbank företagspresentation, mars 2010
Swedbank företagspresentation, mars 2010Swedbank
 

Viewers also liked (20)

The Global Economy No. 6 - September 22, 2011
The Global Economy No. 6 -  September 22, 2011The Global Economy No. 6 -  September 22, 2011
The Global Economy No. 6 - September 22, 2011
 
Purchasing Managers Index - May 1 2013
Purchasing Managers Index - May 1 2013Purchasing Managers Index - May 1 2013
Purchasing Managers Index - May 1 2013
 
The Latvian Economy - No 5, June 29, 2011
The Latvian Economy - No 5, June 29, 2011The Latvian Economy - No 5, June 29, 2011
The Latvian Economy - No 5, June 29, 2011
 
Swedbanks first quarter results 2011 CEO presentation
Swedbanks first quarter results 2011 CEO presentation Swedbanks first quarter results 2011 CEO presentation
Swedbanks first quarter results 2011 CEO presentation
 
Capital markets day 2008 - Kjell Hedman
Capital markets day 2008 - Kjell HedmanCapital markets day 2008 - Kjell Hedman
Capital markets day 2008 - Kjell Hedman
 
Transcript conference call Q4 2009
Transcript conference call Q4 2009Transcript conference call Q4 2009
Transcript conference call Q4 2009
 
Purchasing Managers' Index - Services
Purchasing Managers' Index - ServicesPurchasing Managers' Index - Services
Purchasing Managers' Index - Services
 
Swedbank Analysis Lithuania 2010
Swedbank Analysis Lithuania 2010Swedbank Analysis Lithuania 2010
Swedbank Analysis Lithuania 2010
 
Swedbank Economic Outlook 29 September 2009
Swedbank Economic Outlook 29 September 2009Swedbank Economic Outlook 29 September 2009
Swedbank Economic Outlook 29 September 2009
 
Swedbank Corporate presentation Q4 2010
Swedbank Corporate presentation Q4 2010Swedbank Corporate presentation Q4 2010
Swedbank Corporate presentation Q4 2010
 
Purchasing Managers´ Index Services, October 2011
Purchasing Managers´ Index Services, October 2011Purchasing Managers´ Index Services, October 2011
Purchasing Managers´ Index Services, October 2011
 
Roadshow, Lehman Brothers Global Financial Services Conference
Roadshow, Lehman Brothers Global Financial Services ConferenceRoadshow, Lehman Brothers Global Financial Services Conference
Roadshow, Lehman Brothers Global Financial Services Conference
 
Q1 2008 Transcript Conference Call
Q1 2008 Transcript Conference CallQ1 2008 Transcript Conference Call
Q1 2008 Transcript Conference Call
 
Baltic Outlook January 2009
Baltic Outlook January 2009Baltic Outlook January 2009
Baltic Outlook January 2009
 
Swedbanks företagspresentation kvartal 1 2013
Swedbanks företagspresentation kvartal 1 2013Swedbanks företagspresentation kvartal 1 2013
Swedbanks företagspresentation kvartal 1 2013
 
Handelsbanken - Nordic Large Cap seminar 2010
Handelsbanken - Nordic Large Cap seminar 2010Handelsbanken - Nordic Large Cap seminar 2010
Handelsbanken - Nordic Large Cap seminar 2010
 
The Baltic Outlook: Update, July 2009
The Baltic Outlook: Update, July 2009 The Baltic Outlook: Update, July 2009
The Baltic Outlook: Update, July 2009
 
The Baltic Outlook: Update, July 2009
The Baltic Outlook: Update, July 2009The Baltic Outlook: Update, July 2009
The Baltic Outlook: Update, July 2009
 
CEO presentation of Q1 2008 results
CEO presentation of Q1 2008 resultsCEO presentation of Q1 2008 results
CEO presentation of Q1 2008 results
 
Swedbank företagspresentation, mars 2010
Swedbank företagspresentation, mars 2010Swedbank företagspresentation, mars 2010
Swedbank företagspresentation, mars 2010
 

More from Swedbank

Swedbank corporate presentation April 25 2017
Swedbank corporate presentation April 25 2017Swedbank corporate presentation April 25 2017
Swedbank corporate presentation April 25 2017Swedbank
 
Swedbank foretagspresentation 25 april 2017
Swedbank foretagspresentation 25 april 2017Swedbank foretagspresentation 25 april 2017
Swedbank foretagspresentation 25 april 2017Swedbank
 
Delårsrapport kv1 2017
Delårsrapport kv1 2017Delårsrapport kv1 2017
Delårsrapport kv1 2017Swedbank
 
Interim report q1 2017
Interim report q1 2017Interim report q1 2017
Interim report q1 2017Swedbank
 
Year end report 2016
Year end report 2016Year end report 2016
Year end report 2016Swedbank
 
Bokslutskommuniké 2016
Bokslutskommuniké 2016Bokslutskommuniké 2016
Bokslutskommuniké 2016Swedbank
 
Swedbank företagspresentation, 2 februari 2017
Swedbank företagspresentation, 2 februari 2017Swedbank företagspresentation, 2 februari 2017
Swedbank företagspresentation, 2 februari 2017Swedbank
 
Swedbank corporate presentation, February 2 2017
Swedbank corporate presentation, February 2 2017Swedbank corporate presentation, February 2 2017
Swedbank corporate presentation, February 2 2017Swedbank
 
Swedbank Corporate Presentation, October 25 2016
Swedbank Corporate Presentation, October 25 2016Swedbank Corporate Presentation, October 25 2016
Swedbank Corporate Presentation, October 25 2016Swedbank
 
Swedbank företagspresentation, 25 oktober 2016
Swedbank företagspresentation, 25 oktober 2016Swedbank företagspresentation, 25 oktober 2016
Swedbank företagspresentation, 25 oktober 2016Swedbank
 
Swedbank Corporate Presentation, June 30 2016
Swedbank Corporate Presentation, June 30 2016Swedbank Corporate Presentation, June 30 2016
Swedbank Corporate Presentation, June 30 2016Swedbank
 
Swedbank företagspresentation, 30 juni 2016
Swedbank företagspresentation, 30 juni 2016Swedbank företagspresentation, 30 juni 2016
Swedbank företagspresentation, 30 juni 2016Swedbank
 
Swedbank corporate presentation Q1, 2016
Swedbank corporate presentation Q1, 2016Swedbank corporate presentation Q1, 2016
Swedbank corporate presentation Q1, 2016Swedbank
 
Swedbank företagspresentation kvartal 1, 2016.
Swedbank företagspresentation kvartal 1, 2016.Swedbank företagspresentation kvartal 1, 2016.
Swedbank företagspresentation kvartal 1, 2016.Swedbank
 
Swedbank corporate presentation Q4, 2015
Swedbank corporate presentation Q4, 2015Swedbank corporate presentation Q4, 2015
Swedbank corporate presentation Q4, 2015Swedbank
 
Swedbank företagspresentation kvartal 4,2015
Swedbank företagspresentation kvartal 4,2015Swedbank företagspresentation kvartal 4,2015
Swedbank företagspresentation kvartal 4,2015Swedbank
 
Year end report 2015
Year end report 2015Year end report 2015
Year end report 2015Swedbank
 
Bokslutskommuniké 2015
Bokslutskommuniké 2015Bokslutskommuniké 2015
Bokslutskommuniké 2015Swedbank
 
Swedbank Företagspresentation, September 2015
Swedbank Företagspresentation, September 2015Swedbank Företagspresentation, September 2015
Swedbank Företagspresentation, September 2015Swedbank
 
Swedbank Corporate Presentation, September 2015
Swedbank Corporate Presentation, September 2015Swedbank Corporate Presentation, September 2015
Swedbank Corporate Presentation, September 2015Swedbank
 

More from Swedbank (20)

Swedbank corporate presentation April 25 2017
Swedbank corporate presentation April 25 2017Swedbank corporate presentation April 25 2017
Swedbank corporate presentation April 25 2017
 
Swedbank foretagspresentation 25 april 2017
Swedbank foretagspresentation 25 april 2017Swedbank foretagspresentation 25 april 2017
Swedbank foretagspresentation 25 april 2017
 
Delårsrapport kv1 2017
Delårsrapport kv1 2017Delårsrapport kv1 2017
Delårsrapport kv1 2017
 
Interim report q1 2017
Interim report q1 2017Interim report q1 2017
Interim report q1 2017
 
Year end report 2016
Year end report 2016Year end report 2016
Year end report 2016
 
Bokslutskommuniké 2016
Bokslutskommuniké 2016Bokslutskommuniké 2016
Bokslutskommuniké 2016
 
Swedbank företagspresentation, 2 februari 2017
Swedbank företagspresentation, 2 februari 2017Swedbank företagspresentation, 2 februari 2017
Swedbank företagspresentation, 2 februari 2017
 
Swedbank corporate presentation, February 2 2017
Swedbank corporate presentation, February 2 2017Swedbank corporate presentation, February 2 2017
Swedbank corporate presentation, February 2 2017
 
Swedbank Corporate Presentation, October 25 2016
Swedbank Corporate Presentation, October 25 2016Swedbank Corporate Presentation, October 25 2016
Swedbank Corporate Presentation, October 25 2016
 
Swedbank företagspresentation, 25 oktober 2016
Swedbank företagspresentation, 25 oktober 2016Swedbank företagspresentation, 25 oktober 2016
Swedbank företagspresentation, 25 oktober 2016
 
Swedbank Corporate Presentation, June 30 2016
Swedbank Corporate Presentation, June 30 2016Swedbank Corporate Presentation, June 30 2016
Swedbank Corporate Presentation, June 30 2016
 
Swedbank företagspresentation, 30 juni 2016
Swedbank företagspresentation, 30 juni 2016Swedbank företagspresentation, 30 juni 2016
Swedbank företagspresentation, 30 juni 2016
 
Swedbank corporate presentation Q1, 2016
Swedbank corporate presentation Q1, 2016Swedbank corporate presentation Q1, 2016
Swedbank corporate presentation Q1, 2016
 
Swedbank företagspresentation kvartal 1, 2016.
Swedbank företagspresentation kvartal 1, 2016.Swedbank företagspresentation kvartal 1, 2016.
Swedbank företagspresentation kvartal 1, 2016.
 
Swedbank corporate presentation Q4, 2015
Swedbank corporate presentation Q4, 2015Swedbank corporate presentation Q4, 2015
Swedbank corporate presentation Q4, 2015
 
Swedbank företagspresentation kvartal 4,2015
Swedbank företagspresentation kvartal 4,2015Swedbank företagspresentation kvartal 4,2015
Swedbank företagspresentation kvartal 4,2015
 
Year end report 2015
Year end report 2015Year end report 2015
Year end report 2015
 
Bokslutskommuniké 2015
Bokslutskommuniké 2015Bokslutskommuniké 2015
Bokslutskommuniké 2015
 
Swedbank Företagspresentation, September 2015
Swedbank Företagspresentation, September 2015Swedbank Företagspresentation, September 2015
Swedbank Företagspresentation, September 2015
 
Swedbank Corporate Presentation, September 2015
Swedbank Corporate Presentation, September 2015Swedbank Corporate Presentation, September 2015
Swedbank Corporate Presentation, September 2015
 

Recently uploaded

Top Rated Pune Call Girls Viman Nagar ⟟ 6297143586 ⟟ Call Me For Genuine Sex...
Top Rated  Pune Call Girls Viman Nagar ⟟ 6297143586 ⟟ Call Me For Genuine Sex...Top Rated  Pune Call Girls Viman Nagar ⟟ 6297143586 ⟟ Call Me For Genuine Sex...
Top Rated Pune Call Girls Viman Nagar ⟟ 6297143586 ⟟ Call Me For Genuine Sex...Call Girls in Nagpur High Profile
 
Call Girls Koregaon Park Call Me 7737669865 Budget Friendly No Advance Booking
Call Girls Koregaon Park Call Me 7737669865 Budget Friendly No Advance BookingCall Girls Koregaon Park Call Me 7737669865 Budget Friendly No Advance Booking
Call Girls Koregaon Park Call Me 7737669865 Budget Friendly No Advance Bookingroncy bisnoi
 
The Economic History of the U.S. Lecture 30.pdf
The Economic History of the U.S. Lecture 30.pdfThe Economic History of the U.S. Lecture 30.pdf
The Economic History of the U.S. Lecture 30.pdfGale Pooley
 
VVIP Pune Call Girls Katraj (7001035870) Pune Escorts Nearby with Complete Sa...
VVIP Pune Call Girls Katraj (7001035870) Pune Escorts Nearby with Complete Sa...VVIP Pune Call Girls Katraj (7001035870) Pune Escorts Nearby with Complete Sa...
VVIP Pune Call Girls Katraj (7001035870) Pune Escorts Nearby with Complete Sa...Call Girls in Nagpur High Profile
 
20240429 Calibre April 2024 Investor Presentation.pdf
20240429 Calibre April 2024 Investor Presentation.pdf20240429 Calibre April 2024 Investor Presentation.pdf
20240429 Calibre April 2024 Investor Presentation.pdfAdnet Communications
 
The Economic History of the U.S. Lecture 25.pdf
The Economic History of the U.S. Lecture 25.pdfThe Economic History of the U.S. Lecture 25.pdf
The Economic History of the U.S. Lecture 25.pdfGale Pooley
 
WhatsApp 📞 Call : 9892124323 ✅Call Girls In Chembur ( Mumbai ) secure service
WhatsApp 📞 Call : 9892124323  ✅Call Girls In Chembur ( Mumbai ) secure serviceWhatsApp 📞 Call : 9892124323  ✅Call Girls In Chembur ( Mumbai ) secure service
WhatsApp 📞 Call : 9892124323 ✅Call Girls In Chembur ( Mumbai ) secure servicePooja Nehwal
 
Independent Call Girl Number in Kurla Mumbai📲 Pooja Nehwal 9892124323 💞 Full ...
Independent Call Girl Number in Kurla Mumbai📲 Pooja Nehwal 9892124323 💞 Full ...Independent Call Girl Number in Kurla Mumbai📲 Pooja Nehwal 9892124323 💞 Full ...
Independent Call Girl Number in Kurla Mumbai📲 Pooja Nehwal 9892124323 💞 Full ...Pooja Nehwal
 
Call Girls Service Nagpur Maya Call 7001035870 Meet With Nagpur Escorts
Call Girls Service Nagpur Maya Call 7001035870 Meet With Nagpur EscortsCall Girls Service Nagpur Maya Call 7001035870 Meet With Nagpur Escorts
Call Girls Service Nagpur Maya Call 7001035870 Meet With Nagpur Escortsranjana rawat
 
High Class Call Girls Nagpur Grishma Call 7001035870 Meet With Nagpur Escorts
High Class Call Girls Nagpur Grishma Call 7001035870 Meet With Nagpur EscortsHigh Class Call Girls Nagpur Grishma Call 7001035870 Meet With Nagpur Escorts
High Class Call Girls Nagpur Grishma Call 7001035870 Meet With Nagpur Escortsranjana rawat
 
Solution Manual for Financial Accounting, 11th Edition by Robert Libby, Patri...
Solution Manual for Financial Accounting, 11th Edition by Robert Libby, Patri...Solution Manual for Financial Accounting, 11th Edition by Robert Libby, Patri...
Solution Manual for Financial Accounting, 11th Edition by Robert Libby, Patri...ssifa0344
 
The Economic History of the U.S. Lecture 23.pdf
The Economic History of the U.S. Lecture 23.pdfThe Economic History of the U.S. Lecture 23.pdf
The Economic History of the U.S. Lecture 23.pdfGale Pooley
 
Instant Issue Debit Cards - High School Spirit
Instant Issue Debit Cards - High School SpiritInstant Issue Debit Cards - High School Spirit
Instant Issue Debit Cards - High School Spiritegoetzinger
 
Dividend Policy and Dividend Decision Theories.pptx
Dividend Policy and Dividend Decision Theories.pptxDividend Policy and Dividend Decision Theories.pptx
Dividend Policy and Dividend Decision Theories.pptxanshikagoel52
 
Pooja 9892124323 : Call Girl in Juhu Escorts Service Free Home Delivery
Pooja 9892124323 : Call Girl in Juhu Escorts Service Free Home DeliveryPooja 9892124323 : Call Girl in Juhu Escorts Service Free Home Delivery
Pooja 9892124323 : Call Girl in Juhu Escorts Service Free Home DeliveryPooja Nehwal
 
05_Annelore Lenoir_Docbyte_MeetupDora&Cybersecurity.pptx
05_Annelore Lenoir_Docbyte_MeetupDora&Cybersecurity.pptx05_Annelore Lenoir_Docbyte_MeetupDora&Cybersecurity.pptx
05_Annelore Lenoir_Docbyte_MeetupDora&Cybersecurity.pptxFinTech Belgium
 
Solution Manual for Principles of Corporate Finance 14th Edition by Richard B...
Solution Manual for Principles of Corporate Finance 14th Edition by Richard B...Solution Manual for Principles of Corporate Finance 14th Edition by Richard B...
Solution Manual for Principles of Corporate Finance 14th Edition by Richard B...ssifa0344
 
Malad Call Girl in Services 9892124323 | ₹,4500 With Room Free Delivery
Malad Call Girl in Services  9892124323 | ₹,4500 With Room Free DeliveryMalad Call Girl in Services  9892124323 | ₹,4500 With Room Free Delivery
Malad Call Girl in Services 9892124323 | ₹,4500 With Room Free DeliveryPooja Nehwal
 
VIP Call Girls Service Dilsukhnagar Hyderabad Call +91-8250192130
VIP Call Girls Service Dilsukhnagar Hyderabad Call +91-8250192130VIP Call Girls Service Dilsukhnagar Hyderabad Call +91-8250192130
VIP Call Girls Service Dilsukhnagar Hyderabad Call +91-8250192130Suhani Kapoor
 

Recently uploaded (20)

Top Rated Pune Call Girls Viman Nagar ⟟ 6297143586 ⟟ Call Me For Genuine Sex...
Top Rated  Pune Call Girls Viman Nagar ⟟ 6297143586 ⟟ Call Me For Genuine Sex...Top Rated  Pune Call Girls Viman Nagar ⟟ 6297143586 ⟟ Call Me For Genuine Sex...
Top Rated Pune Call Girls Viman Nagar ⟟ 6297143586 ⟟ Call Me For Genuine Sex...
 
Call Girls Koregaon Park Call Me 7737669865 Budget Friendly No Advance Booking
Call Girls Koregaon Park Call Me 7737669865 Budget Friendly No Advance BookingCall Girls Koregaon Park Call Me 7737669865 Budget Friendly No Advance Booking
Call Girls Koregaon Park Call Me 7737669865 Budget Friendly No Advance Booking
 
The Economic History of the U.S. Lecture 30.pdf
The Economic History of the U.S. Lecture 30.pdfThe Economic History of the U.S. Lecture 30.pdf
The Economic History of the U.S. Lecture 30.pdf
 
VVIP Pune Call Girls Katraj (7001035870) Pune Escorts Nearby with Complete Sa...
VVIP Pune Call Girls Katraj (7001035870) Pune Escorts Nearby with Complete Sa...VVIP Pune Call Girls Katraj (7001035870) Pune Escorts Nearby with Complete Sa...
VVIP Pune Call Girls Katraj (7001035870) Pune Escorts Nearby with Complete Sa...
 
20240429 Calibre April 2024 Investor Presentation.pdf
20240429 Calibre April 2024 Investor Presentation.pdf20240429 Calibre April 2024 Investor Presentation.pdf
20240429 Calibre April 2024 Investor Presentation.pdf
 
The Economic History of the U.S. Lecture 25.pdf
The Economic History of the U.S. Lecture 25.pdfThe Economic History of the U.S. Lecture 25.pdf
The Economic History of the U.S. Lecture 25.pdf
 
WhatsApp 📞 Call : 9892124323 ✅Call Girls In Chembur ( Mumbai ) secure service
WhatsApp 📞 Call : 9892124323  ✅Call Girls In Chembur ( Mumbai ) secure serviceWhatsApp 📞 Call : 9892124323  ✅Call Girls In Chembur ( Mumbai ) secure service
WhatsApp 📞 Call : 9892124323 ✅Call Girls In Chembur ( Mumbai ) secure service
 
Independent Call Girl Number in Kurla Mumbai📲 Pooja Nehwal 9892124323 💞 Full ...
Independent Call Girl Number in Kurla Mumbai📲 Pooja Nehwal 9892124323 💞 Full ...Independent Call Girl Number in Kurla Mumbai📲 Pooja Nehwal 9892124323 💞 Full ...
Independent Call Girl Number in Kurla Mumbai📲 Pooja Nehwal 9892124323 💞 Full ...
 
Call Girls Service Nagpur Maya Call 7001035870 Meet With Nagpur Escorts
Call Girls Service Nagpur Maya Call 7001035870 Meet With Nagpur EscortsCall Girls Service Nagpur Maya Call 7001035870 Meet With Nagpur Escorts
Call Girls Service Nagpur Maya Call 7001035870 Meet With Nagpur Escorts
 
High Class Call Girls Nagpur Grishma Call 7001035870 Meet With Nagpur Escorts
High Class Call Girls Nagpur Grishma Call 7001035870 Meet With Nagpur EscortsHigh Class Call Girls Nagpur Grishma Call 7001035870 Meet With Nagpur Escorts
High Class Call Girls Nagpur Grishma Call 7001035870 Meet With Nagpur Escorts
 
Commercial Bank Economic Capsule - April 2024
Commercial Bank Economic Capsule - April 2024Commercial Bank Economic Capsule - April 2024
Commercial Bank Economic Capsule - April 2024
 
Solution Manual for Financial Accounting, 11th Edition by Robert Libby, Patri...
Solution Manual for Financial Accounting, 11th Edition by Robert Libby, Patri...Solution Manual for Financial Accounting, 11th Edition by Robert Libby, Patri...
Solution Manual for Financial Accounting, 11th Edition by Robert Libby, Patri...
 
The Economic History of the U.S. Lecture 23.pdf
The Economic History of the U.S. Lecture 23.pdfThe Economic History of the U.S. Lecture 23.pdf
The Economic History of the U.S. Lecture 23.pdf
 
Instant Issue Debit Cards - High School Spirit
Instant Issue Debit Cards - High School SpiritInstant Issue Debit Cards - High School Spirit
Instant Issue Debit Cards - High School Spirit
 
Dividend Policy and Dividend Decision Theories.pptx
Dividend Policy and Dividend Decision Theories.pptxDividend Policy and Dividend Decision Theories.pptx
Dividend Policy and Dividend Decision Theories.pptx
 
Pooja 9892124323 : Call Girl in Juhu Escorts Service Free Home Delivery
Pooja 9892124323 : Call Girl in Juhu Escorts Service Free Home DeliveryPooja 9892124323 : Call Girl in Juhu Escorts Service Free Home Delivery
Pooja 9892124323 : Call Girl in Juhu Escorts Service Free Home Delivery
 
05_Annelore Lenoir_Docbyte_MeetupDora&Cybersecurity.pptx
05_Annelore Lenoir_Docbyte_MeetupDora&Cybersecurity.pptx05_Annelore Lenoir_Docbyte_MeetupDora&Cybersecurity.pptx
05_Annelore Lenoir_Docbyte_MeetupDora&Cybersecurity.pptx
 
Solution Manual for Principles of Corporate Finance 14th Edition by Richard B...
Solution Manual for Principles of Corporate Finance 14th Edition by Richard B...Solution Manual for Principles of Corporate Finance 14th Edition by Richard B...
Solution Manual for Principles of Corporate Finance 14th Edition by Richard B...
 
Malad Call Girl in Services 9892124323 | ₹,4500 With Room Free Delivery
Malad Call Girl in Services  9892124323 | ₹,4500 With Room Free DeliveryMalad Call Girl in Services  9892124323 | ₹,4500 With Room Free Delivery
Malad Call Girl in Services 9892124323 | ₹,4500 With Room Free Delivery
 
VIP Call Girls Service Dilsukhnagar Hyderabad Call +91-8250192130
VIP Call Girls Service Dilsukhnagar Hyderabad Call +91-8250192130VIP Call Girls Service Dilsukhnagar Hyderabad Call +91-8250192130
VIP Call Girls Service Dilsukhnagar Hyderabad Call +91-8250192130
 

Energy & Commodities

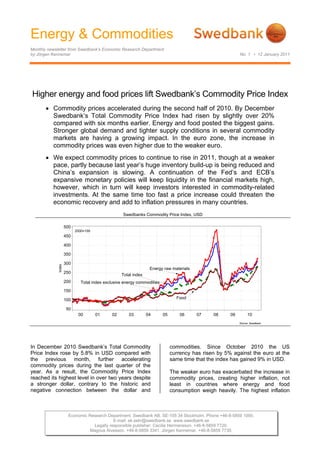
  • 1. Energy & Commodities Monthly newsletter from Swedbank’s Economic Research Department by Jörgen Kennemar No. 1 • 12 January 2011 Higher energy and food prices lift Swedbank’s Commodity Price Index • Commodity prices accelerated during the second half of 2010. By December Swedbank’s Total Commodity Price Index had risen by slightly over 20% compared with six months earlier. Energy and food posted the biggest gains. Stronger global demand and tighter supply conditions in several commodity markets are having a growing impact. In the euro zone, the increase in commodity prices was even higher due to the weaker euro. • We expect commodity prices to continue to rise in 2011, though at a weaker pace, partly because last year’s huge inventory build-up is being reduced and China’s expansion is slowing. A continuation of the Fed’s and ECB’s expansive monetary policies will keep liquidity in the financial markets high, however, which in turn will keep investors interested in commodity-related investments. At the same time too fast a price increase could threaten the economic recovery and add to inflation pressures in many countries. Swedbanks Commodity Price Index, USD 500 2000=100 450 400 350 300 Index Energy raw materials 250 Total index 200 Total index exclusive energy commodities 150 100 Food 50 00 01 02 03 04 05 06 07 08 09 10 Source: Swedbank In December 2010 Swedbank’s Total Commodity commodities. Since October 2010 the US Price Index rose by 5.8% in USD compared with currency has risen by 5% against the euro at the the previous month, further accelerating same time that the index has gained 9% in USD. commodity prices during the last quarter of the year. As a result, the Commodity Price Index The weaker euro has exacerbated the increase in reached its highest level in over two years despite commodity prices, creating higher inflation, not a stronger dollar, contrary to the historic and least in countries where energy and food negative connection between the dollar and consumption weigh heavily. The highest inflation Economic Research Department. Swedbank AB. SE-105 34 Stockholm. Phone +46-8-5859 1000. E-mail: ek.sekr@swedbank.se www.swedbank.se Legally responsible publisher: Cecilia Hermansson. +46-8-5859 7720. Magnus Alvesson. +46-8-5859 3341. Jörgen Kennemar. +46-8-5859 7730.
  • 2. Energy & Commodities Monthly newsletter from Swedbank’s Economic Research Department, continued No. 1 • 12 January 2011 in the EU in November was in Romania (7.7%), 100 dollar, which could jeopardise the global Estonia (5.0%) and Greece (4.8%). recovery. Swedbanks Commodity Price Index in different currencies Oil price and average forecast for 2011-2012 in USD 150 150 140 130 140 120 EUR 110 100 USD/Barrel 130 90 80 120 70 60 SEK 110 50 40 100 USD 30 05 06 07 08 09 10 11 12 Källa: Swedbank, Reuters EcoWin 90 12 10 11 12 1 2 3 4 5 6 7 8 9 m m m m m m m m m The major increase in food prices, which began m m m m 10 10 10 10 10 10 10 10 10 09 10 10 10 20 20 20 20 20 20 20 20 20 20 20 20 20 last summer, continued in December, when the food price index rose by 6.0% compared with Prices of energy commodities again began to November. This means that food prices have accelerate in November and December. On risen by 26% in 12 months. Grain prices, which average, oil rose by 6.5% in December, while the rose significantly in September and October, price of coal climbed by no less than 11.8%. The stabilised temporarily in November before big increase is partly due to the cold winter and accelerating again in December. Other food historic floods in Australia. A substantial drop in products such as coffee, oilseeds and beverages coal production in Australia, which accounts for have become more expensive, which taken around 40% of the world's total coke production, together are putting pressure on household could lead to a coal shortage, which would consumption. Lower food production owing to especially hurt the steel industry – and the energy unfavourable weather conditions is a main reason sector as well. Coal plays a vital role in global why inventories are lower than expected. Political energy production, particularly for emerging Asian decisions such as the export caps in Russia and economies. The fact that global oil consumption Ukraine to ensure domestic food supplies have will rise faster in 2011 not only in emerging further tightened supply conditions, which also economies but also in OECD countries, which tends to lead to increased speculation. We expect account for around 60% of global consumption, is the increase in food commodity prices to slow in also driving prices higher. We expect the average 2011, when global production rises and the price of oil to rise from USD 80 a barrel last year temporary impact of weather conditions fades. to USD 87 in 2011, even though the momentum in The price increase in the latter part of 2010 global GDP growth will be lower than last year. If means, however, that the average increase will be the dollar continues to appreciate, as expected, greater this year than last. Global food supplies the price increase will be higher in euro terms, are proving highly vulnerable to production with the risk of rising inflation, especially in disruptions at the same time that global demand is countries where energy consumption weighs trending higher as the purchasing power of heavily in the consumption basket. population-dense economies strengthens and economic prospects brighten. This probably means that today’s high oil price of just over USD 95 is temporary and that it will fall Price development for different food commodities, in USD when this unusually cold season ends and warmer weather returns. At the same time the oil 180 2008-12-31=100 market is still facing excess supply, even though 170 inventories have dropped in recent months, which 160 150 Sugar, beverages indicates that the price gains have also been the 140 result of increased expectations and speculation. Food prices, total Index 130 Global pressure on OPEC countries, which 120 provide over 35% of global production, to raise 110 production levels is likely to mount if oil prices 100 Cereals should stabilise at current levels or reach USD 90 jan mar maj jul sep nov jan mar maj jul sep nov jan mar maj jul sep nov 08 09 10 Source: Reuters EcoWin 2 (4)
  • 3. Energy & Commodities Monthly newsletter from Swedbank’s Economic Research Department, continued No. 1 • 12 January 2011 Other than foods, metals posted the strongest the debt crisis’s impact on the macro economy price gains in 2010, although there are relatively isn’t over yet. Gold’s status as a safe haven big differences between product groups. Among among financial investors is likely to continue as metals, nickel and copper rose the most (by long as global imbalances remain. Silver’s use in 41.6% and 31.1%, respectively) between an increasing number of commercial applications, December 2009 and December 2010. Zinc and thanks in no small part to its favourable physical lead, on the other hand, have been the weakest in properties, has led to higher price levels. There is the group. Although the price of iron ore has fallen still a long way to go to reach the 1980 level, for two consecutive months in USD, it is still over however, when the price of silver reached USD 48 70% higher than in 2009. We expect metal prices per troy ounce for a short period of time. to continue to rise in 2011, though at a slower Geologists are warning of a future silver shortage pace as global inventories shrink. Ferrous metals if the current increase in consumption continues. rose by 35% in USD last year and are expected to We feel that today’s price increase rests more on increase by an average of 8-12% this year. fundamentals. Metals, where supply conditions are limited, have the biggest potential for further price increases. In addition to changes in supply and demand, Copper and tin inventories have fallen to the commodity prices are increasingly affected by lowest levels since 2008. The expected rise in financial flows. Low nominal interest rates have metal prices is based, however, on the continued led to rapidly expanding liquidity in global financial strong expansion of the Chinese economy, which markets, where an increasing share of investment accounts for slightly over 40% of global metal capital is turning to commodity markets. This consumption. Government concerns about the tends to drive up prices even further, especially high inflation rate (5.1% in November) and rapidly when there are fundamental imbalances. Our rising asset prices have led to several austerity expectation of unchanged benchmark interest packages, and more are likely in the year ahead. rates in the US and in EMU countries in 2011 and The effect of austerity policies on the Chinese further unconventional measures in the form of economy and commodity demand could lead to central banks’ bond purchases would mean increased volatility in global commodity markets. continued high liquidity in the global financial market, which should also drive up commodity Among precious metals, silver continues to rise in prices unless the global economy proves weaker price, while gold has stabilised at a high level of than expected. just under USD 1 400 per troy ounce. Although gold is under pressure from the stronger dollar, Jörgen Kennemar there is still an underlying demand, not least due to growing inflation concerns, the same time that 3 (4)
  • 4. Energy & Commodities Monthly newsletter from Swedbank’s Economic Research Department, continued No. 1 • 12 January 2011 Swedbank Commodity Index - US$ - Swedbank Commodity Index - SKr - Basis 2000 = 1oo 12/01/11 Basis 2000 = 1oo 12/01/11 10.2010 11.2010 12.2010 10.2010 11.2010 12.2010 Total index 288.2 297.1 314.2 Total index 209.0 220.3 233.6 Per cent change month ago 5.5 3.1 5.8 Per cent change month ago -0.2 5.4 6.1 Per cent change year ago 17.8 16.5 25.0 Per cent change year ago 13.1 14.8 19.7 Total index exclusive energy 279.4 283.8 292.7 Total index exclusive energy 202.6 210.4 217.6 Per cent change month ago 2.1 1.6 3.1 Per cent change month ago -3.4 3.9 3.4 Per cent change year ago 35.6 34.3 33.2 Per cent change year ago 30.2 32.3 27.6 Food, tropical beverages 256.7 270.1 286.2 Food, tropical beverages 186.1 200.2 212.8 Per cent change month ago 4.4 5.2 6.0 Per cent change month ago -1.2 7.6 6.3 Per cent change year ago 19.3 23.4 26.1 Per cent change year ago 14.5 21.6 20.8 Cereals 252.5 257.1 278.9 Cereals 183.1 190.6 207.4 Per cent change month ago 5.2 1.8 8.5 Per cent change month ago -0.5 4.1 8.8 Per cent change year ago 34.9 29.7 36.2 Per cent change year ago 29.4 27.8 30.5 Tropical beverages and tobacco 270.9 285.2 301.5 Tropical beverages and tobacco 196.4 211.4 224.2 Per cent change month ago 2.5 5.3 5.7 Per cent change month ago -3.1 7.6 6.0 Per cent change year ago 14.4 21.1 22.5 Per cent change year ago 9.8 19.4 17.4 Coffee 161.6 173.9 183.8 Coffee 117.2 128.9 136.7 Per cent change month ago -1.2 7.6 5.7 Per cent change month ago -6.5 10.0 6.0 Per cent change year ago 33.4 45.3 47.0 Per cent change year ago 28.1 43.2 40.9 Oilseeds and oil 228.7 246.1 258.0 Oilseeds and oil 165.8 182.4 191.8 Per cent change month ago 9.1 7.6 4.8 Per cent change month ago 3.2 10.0 5.1 Per cent change year ago 22.4 25.2 28.7 Per cent change year ago 17.4 23.4 23.3 Industrial raw materials 286.0 287.8 294.6 Industrial raw materials 207.4 213.3 219.0 Per cent change month ago 1.5 0.6 2.3 Per cent change month ago -4.0 2.9 2.6 Per cent change year ago 40.6 37.6 35.4 Per cent change year ago 35.0 35.6 29.7 Agricultural raw materials 185.7 190.7 193.2 Agricultural raw materials 134.6 141.4 143.6 Per cent change month ago 6.1 2.7 1.3 Per cent change month ago 0.4 5.0 1.6 Per cent change year ago 27.4 24.8 23.1 Per cent change year ago 22.2 23.0 18.0 Cotton 112.5 132.0 140.8 Cotton 81.6 97.9 104.7 Per cent change month ago 16.2 17.3 6.7 Per cent change month ago 10.0 20.0 7.0 Per cent change year ago 71.5 92.1 88.5 Per cent change year ago 64.6 89.4 80.6 Softwood 153.5 149.3 144.6 Softwood 111.3 110.7 107.5 Per cent change month ago 2.9 -2.7 -3.1 Per cent change month ago -2.7 -0.5 -2.9 Per cent change year ago 13.5 6.5 3.4 Per cent change year ago 8.9 5.0 -0.9 Woodpulp 966.4 956.9 949.8 Woodpulp 700.6 709.4 706.2 Per cent change month ago -0.6 -1.0 -0.7 Per cent change month ago -6.0 1.2 -0.5 Per cent change year ago 30.4 23.9 19.3 Per cent change year ago 25.1 22.1 14.3 Non-ferrous metals 263.7 264.0 275.6 Non-ferrous metals 191.2 195.7 204.9 Per cent change month ago 8.1 0.1 4.4 Per cent change month ago 2.3 2.4 4.7 Per cent change year ago 28.6 24.4 22.2 Per cent change year ago 23.4 22.6 17.0 Copper 8291.8 8469.1 9130.1 Copper 6011.6 6278.2 6788.0 Per cent change month ago 7.6 2.1 7.8 Per cent change month ago 1.8 4.4 8.1 Per cent change year ago 31.9 26.9 31.1 Per cent change year ago 26.6 25.0 25.6 Aluminium 2346.1 2332.6 2347.4 Aluminium 1700.9 1729.2 1745.2 Per cent change month ago 8.5 -0.6 0.6 Per cent change month ago 2.7 1.7 0.9 Per cent change year ago 24.9 19.7 7.8 Per cent change year ago 19.9 18.0 3.2 Lead 2379.0 2376.1 2404.9 Lead 1724.8 1761.4 1788.0 Per cent change month ago 8.9 -0.1 1.2 Per cent change month ago 3.1 2.1 1.5 Per cent change year ago 6.2 2.9 3.5 Per cent change year ago 1.9 1.5 -0.9 Zinc 2371.8 2291.1 2272.7 Zinc 1719.6 1698.4 1689.7 Per cent change month ago 10.3 -3.4 -0.8 Per cent change month ago 4.3 -1.2 -0.5 Per cent change year ago 14.5 4.5 -3.9 Per cent change year ago 9.9 3.0 -8.0 Nickel 23802.0 22905.5 24055.5 Nickel 17256.5 16979.9 17884.7 Per cent change month ago 5.1 -3.8 5.0 Per cent change month ago -0.5 -1.6 5.3 Per cent change year ago 28.5 34.8 41.6 Per cent change year ago 23.3 32.9 35.6 Iron ore, steel scrap 605.3 603.0 607.0 Iron ore, steel scrap 438.8 447.0 451.3 Per cent change month ago -8.6 -0.4 0.7 Per cent change month ago -13.5 1.9 1.0 Per cent change year ago 75.0 75.0 73.4 Per cent change year ago 68.0 72.5 66.1 Energy raw materials 292.1 303.0 323.8 Energy raw materials 211.8 224.6 240.7 Per cent change month ago 7.1 3.7 6.8 Per cent change month ago 1.3 6.1 7.2 Per cent change year ago 11.6 10.4 21.9 Per cent change year ago 7.1 8.8 16.8 Coking coal 369.2 406.7 454.7 Coking coal 267.7 301.5 338.1 Per cent change month ago 4.1 10.2 11.8 Per cent change month ago -1.6 12.6 12.1 Per cent change year ago 36.8 38.6 48.5 Per cent change year ago 31.3 36.6 42.3 Crude oil 288.6 298.3 317.8 Crude oil 209.2 221.1 236.3 Per cent change month ago 7.2 3.4 6.5 Per cent change month ago 1.5 5.7 6.8 Per cent change year ago 10.4 9.0 20.5 Per cent change year ago 6.0 7.4 15.5 Source : SWEDBANK and HWWA-Institute for Economic Research Hamburg Source : SWEDBANK and HWWA-Institute for Economic Research Hamburg Swedbank Economic Research Department Swedbank’s monthly Energy & Commodities newsletter is published as a service to our customers. We believe that we have used reliable sources and methods in the preparation SE-105 34 Stockholm, Sweden of the analyses reported in this publication. However, we cannot guarantee the accuracy or Phone +46-8-5859 7740 completeness of the report and cannot be held responsible for any error or omission in the ek.sekr@swedbank.se underlying material or its use. Readers are encouraged to base any (investment) decisions www.swedbank.se on other material as well. Neither Swedbank nor its employees may be held responsible for Legally responsible publisher losses or damages, direct or indirect, owing to any errors or omissions in Swedbank’s Cecilia Hermansson, +46-88-5859 7720 monthly Energy & Commodities newsletter. Magnus Alvesson, +46-8-5859 3341 Jörgen Kennemar, +46-8-5859 7730 4 (4)