The time it takes to extract 1.7 million molecules from a database and process them for virtual screening is crucial for the drug discovery pipeline. The workflows used in this project take advantage of LLNL’s high performance computing for molecular descriptor calculations and molecular dynamics simulations. Molecular Descriptors are numerical values that characterize properties of molecules such as Molecular
Weight and Hydrophobicity. These efforts will be able to help shrink the drug discovery pipeline from an average of 6 years to 1.
1. Δ time = 1ns
Temperature = 310 K
Svetlana was supported by CRADA TC02274 on behalf of the American Heart Association. She would like to thank Dr. Felice C. Lightstone, Dr. Brian J. Bennion, Dr. Sergio
Wong, Dr. Drew Bennett and the rest of the BBS group for their constant support and mentoring. She would also like to thank Dr. Miguel Morales-Silva and Tony Baylis for their
constant mentoring at LLNL. She would also like to thank Juanita Ordoñez for help with data preparation and python programming. I would also like to thank Talia Zeppelin and
Li Linqiu for their constructive discussions.
References
• Hechinger M, Leonhard K, & Marquardt W (2012) What is Wrong with Quantitative Structure–Property Relations Models Based on Three-Dimensional Descriptors? Journal of Chemical Information and
Modeling 52(8):1984-1993.
• Labute P (2000) A widely applicable set of descriptors. Journal of Molecular Graphics and Modeling 18(4):464-477.
• Malde AK, et al. (2011) An Automated Force Field Topology Builder (ATB) and Repository: Version 1.0. Journal of Chemical Theory and Computation 7(12):4026-4037.
• Gaulton A, et al. (2017) The ChEMBL database in 2018. Nucleic Acids Research 45(Database issue):D945-D954.
Molecular Descriptors: Understanding Structural Complexity
Svetlana Gelpí-Domínguez1,2, Brian J. Bennion2 , Felice C. Lightstone2
1)Department of Chemistry, University of Connecticut, Storrs, 06269, CT
2)Lawrence Livermore National Laboratory, Livermore, 94550, CA
The time it takes to extract 1.7 million molecules from a database and process them
for virtual screening is crucial for the drug discovery pipeline. The workflows used in
this project take advantage of LLNL’s high performance computing for molecular
descriptor calculations and molecular dynamics simulations. Molecular Descriptors
are numerical values that characterize properties of molecules such as Molecular
Weight and Hydrophobicity. These efforts will be able to help shrink the drug
discovery pipeline from an average of 6 years to 1.
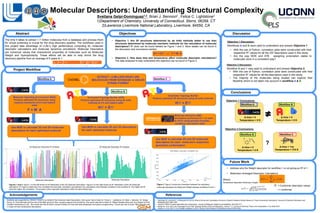
• Objective 1. Are 3D structures determined by ab initio methods better to use than
structures determined by molecular mechanic methods for the calculation of molecular
descriptors? R2 plots can be found labeled as Figure 1 and 2. More details can be found in
the discussion and conclusions section.
• Objective 2. How does time and temperature affect molecular descriptor calculations?
The data analyzed to help understand this objective can be found in Figure 3.
Automated Topology Builder (ATB)
Produce optimized 3D structures using ab initio
methods at 0 K and implicit water
HΨ = EΨ
Molecular Operating Environment (MOE)
Produce optimized 3D structures using
classical mechanics at 0 K and implicit
water
F = M A
2.
a
EXTRACT ~2 MILLION DRUG LIKE
MOLECULES FROM DATABASE in SMILES
STRING FORMAT
W
Use MOE to calculate 2D and 3D molecular
descriptors for each molecule’s respective
geometric conformation
Automated Topology Builder
Produce optimized 3D structures using ab initio methods
HΨ = EΨ
Use MOE to calculate 2D and 3D molecular
descriptors for each optimized molecule
Use MOE to calculate 2D and 3D descriptors
for each optimized molecule
Abstract Objectives
Project Workflow
Discussion
Conclusions
Future Work
Molecular Dynamics (MD)
simulations performed for 1 ns each
at 310 K using periodic boundary
conditions and explicit water
Objective 1 Discussion:
Workflows A and B were used to understand and answer Objective 1.
• With the use of Python, correlation plots were constructed with their
respective R2 values for all the 337 descriptors used in this study.
• Are the way MOE and ATB assigning protonation states to
molecules done in a consistent way?
Objective 2 Discussion:
Workflow B and C was used to understand and answer Objective 2.
• With the use of Python, correlation plots were constructed with their
respective R2 values for all the descriptors used in this study.
• The majority of the molecules being studied can explore their
flexibility which is not taken into account in workflow A & B.
Objective 1 Conclusions:
Objective 2 Conclusions:
Figures 1 and 2. Figure 1 on the left shows an R2 distribution of the 2D molecular descriptors. Figure 2 on the right shows an R2 distribution of the 3D molecular
descriptors. R2 helps us determine how correlated the descriptor calculation was between the calculations done between workflow A and workflow B. The higher the R2
value the higher the correlation. The grouped colors represent descriptors within the same family type.
ReferencesAcknowledgements
HΨ = EΨ vs. F = M A
Workflow A
Workflow B
Workflow C
• Boltzmann-Averaged Descriptor Calculations
!! ! =
!!!"#!!!!(!)/!"
!!
!
! !"#!!!!(!)/!"
Where:
! ! = !!
!
!
(!)!!
∗
= Conformer descriptor values
i = conformer
Temperature-dependent Boltzmann weight:
• Address why the Weight descriptor for workflow C is not giving an R2 of 1.
Figure 3. Figure 3 shows the correlation between the calculated
molecular descriptors for Molecular Weight between workflows B and C.
0
0.5
0.9
Molecular Descriptors Molecular Descriptors
2D Molecular Descriptor R2 Analysis 3D Molecular Descriptor R2 Analysis
R2
0.1
0.6
0.8
Workflow A Workflow B
Workflow C
Δ time = 0
Temperature = 0 K
Δ time = 0
Temperature = 0 K
Workflow B
Δ time = 0
Temperature = 0 K
?