1. EQUITIES –INDIA
Analyst: Sumeesh Thomas
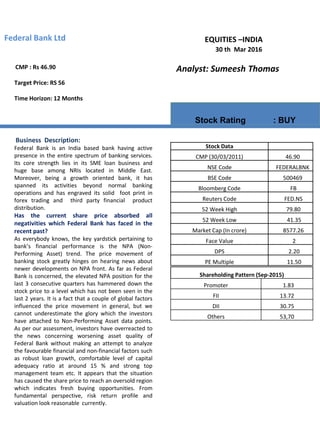
Stock Rating : BUY
Federal Bank Ltd
30 th Mar 2016
Business Description:
Federal Bank is an India based bank having active
presence in the entire spectrum of banking services.
Its core strength lies in its SME loan business and
huge base among NRIs located in Middle East.
Moreover, being a growth oriented bank, it has
spanned its activities beyond normal banking
operations and has engraved its solid foot print in
forex trading and third party financial product
distribution.
Has the current share price absorbed all
negativities which Federal Bank has faced in the
recent past?
As everybody knows, the key yardstick pertaining to
bank’s financial performance is the NPA (Non-
Performing Asset) trend. The price movement of
banking stock greatly hinges on hearing news about
newer developments on NPA front. As far as Federal
Bank is concerned, the elevated NPA position for the
last 3 consecutive quarters has hammered down the
stock price to a level which has not been seen in the
last 2 years. It is a fact that a couple of global factors
influenced the price movement in general, but we
cannot underestimate the glory which the investors
have attached to Non-Performing Asset data points.
As per our assessment, investors have overreacted to
the news concerning worsening asset quality of
Federal Bank without making an attempt to analyze
the favourable financial and non-financial factors such
as robust loan growth, comfortable level of capital
adequacy ratio at around 15 % and strong top
management team etc. It appears that the situation
has caused the share price to reach an oversold region
which indicates fresh buying opportunities. From
fundamental perspective, risk return profile and
valuation look reasonable currently.
CMP : Rs 46.90
Target Price: RS 56
Time Horizon: 12 Months
Shareholding Pattern (Sep-2015)
Promoter 1.83
FII 13.72
DII 30.75
Others 53,70
Stock Data
CMP (30/03/2011) 46.90
NSE Code FEDERALBNK
BSE Code 500469
Bloomberg Code FB
Reuters Code FED.NS
52 Week High 79.80
52 Week Low 41.35
Market Cap (In crore) 8577.26
Face Value 2
DPS 2.20
PE Multiple 11.50
2. Federal Bank Ltd
Mar 2016
Management’s reorientation towards growth:
Management has turned its attention on making the top management formidable in order to
equip them to deal with fast changing banking business environment. Federal Bank had some
recent high profile head count additions towards this end.
Acknowledging the significance of digitalisation, bank has converged major chunk of its efforts
towards rolling out new facilities to render enhanced banking experience for the tech-savvy
customers.
Management has identified that the era of aggressive branch expansion has come to an end and
the banks needs to generate more return in terms of increased productivity from the existing
branches and through branch optimisation efforts by means of relocation of less productive
braches to a different place.
Hitherto, the bank had not mined aggressively big ticket corporate loan market. Ever since the
management recognized the faster pace of corporate loan growth as pillar of banking business
uptick, it has taken steps to achieve this. Federal Bank can now boast of a network of relationship
managers across different geographies to cater to this loan segment.
Bank’s Loan Mix:
Bank maintains an excellent portfolio of loan with emphasis on its traditional stronghold SME
business . Below chart depicts the weightage of each loan vertical relative to its overall business
16392
13876
6137
15272
Loan mix as on Sep '16‘ (Amount in Crores)
Retail
SME
Agri
Corporate
3. Mar 2016
Federal Bank Ltd
Corporate loan segment registered a de-growth of 5 % in 2016 Q2 YOY. In order to address this issue,
there has been a renewed focus and conscious efforts on the part of top management to stimulate
growth by building a team relationship managers who will deal with pipe line and converts.
Acknowledging this as a positive development, we expect a strong credit off take in the next 2 to 3
quarters. As regards SME advances, Federal Bank has witnessed a growth rate of 17 % during the last
2 quarters. This is a very encouraging trend . Management is hopeful that the same will be sustained in
the next few quarters as well. The two factors which may turn in favour of loan growth as a whole will
be the continued low interest rate regime and the expected spending boost consequent to the
implementation of 7 th Central Pay Commission.
NPA movement:
Since Gross & Net NPA and Provision Coverage ratio data were observed to have some degree of
correlation, we have drawn up a comparison chart to gauge the growth trend of these 3 key
parameters during the last 5 quarters. As per the below chart, it is obvious that Gross and Net NPA
have spiked in the first quarter of FY 2016. Hence, since the bank which had already built up a
comfortable PCR during low interest period, it began using the provision coverage as a tool to stem the
huge erosion in net profit. The encouraging facet of the NPA trend is that the spike which was
witnessed during 2016 Q1 has not accelerated further, instead it began showing the sign of retreat
-10%
0%
10%
20%
30%
40%
2015 Q3 2015 Q4 2016 Q1 2016 Q2 2016 Q3
Gross NPAs (%)
Net NPAs (%)
Provision Coverage Ratio
0
0.5
1
1.5
2
2.5
3
3.5
2015 Q3 2015 Q4 2016 Q1 2016 Q2 2016 Q3
Gross NPAs (%)
Net NPAs (%)
4. Federal Bank Ltd- Fundamental Report
PCR diagram indicates that the bank
maintained the highest PCR to the
tune of 85 % during the period of low
NPA and started scaling down the
provision coverage as and when the
asset quality is getting worse. PCR is
hovering around the border of 70 % in
the latest available quarter.
60
65
70
75
80
85
90
2015
Q3
2015
Q4
2016
Q1
2016
Q2
2016
Q3
Provision Coverage Ratio
Provision Coverage
Ratio
0.00
0.50
1.00
1.50
2.00
2.50
3.00
3.50
4.00
4.50
5.00
Retail SME Agri Corporate
Segment wise Gross NPA as on Sep ‘2015’
Segment wise NPA
SME segment topped in the NPA
Category scoring 4.3 % level.
Corporate segment is not far behind
with a 3.58 % score on NPA front.
Out of slippage of Rs. 405 Crores
recorded in 2016 Q2, Large
corporate and SME have contributed
Rs. 170 Crores and 155 Crores of
NPAs respectively. During Q3 FY
2016, three NPA accounts were sold
to ARCs (Asset Reconstruction
Company) . The amounts were Rs.
225, Rs. 109 and Rs. 70 (all in Crores).
It is related to one shipping and 2
metal accounts.
Loan restructuring
Loan restructuring is an essential part of banking operation. Banks resort to loan restructuring as part of 5/25
or Corporate Debt Restructuring (CDR) schemes . It entails easing original terms and conditions of loan like
extending repayment period or reduction in interest rate etc. Major sectors covered are Infrastructure, Power
and Metal. Most of the NPA origination is linked to restructured category for most of the bank . Federal Bank is
also no exception.
While publishing quarterly results, analysts in general are eager to know the amount of fresh restructuring
occurred during the quarter. As regards Federal Bank, it is heartening to note that the fresh rescheduled
category of loan amount came to just 80 Lacks during the past 6 months However, there are a three accounts
for which moratorium on restructuring will be ending in the next 3 quarters. It is a cause of concern for the
bank. As on September 30th last year, bank’s standard restructured loan amount was Rs. 2200 Crores. SEBs
(State Electricity Boards) have 37 % exposure in Standard Restructured loan while Infrastructure and Airline
also had substantial contribution towards loan restructuring exercise.
5. Federal Bank- Fundamental Report
Deposit Profile:
Large chunk of deposits from NRI segment is the differentiating factor for Federal Bank. It appears that NRI
deposit growth reached at its peak to the tune of 27 % during the bygone quarter. However the bank is
cautiously optimistic over the sustained high deposit flow in this segment due to the impending recessionary
fears in the Middle East Countries as a result of crude oil price crash.
29.5
30
30.5
31
31.5
32
32.5
2015 Q3 2015 Q4 2016 Q1 2016 Q2 2016 Q3
CASA (%) growth
CASA (%)
With regard to CASA proportion to overall
deposit, it is registering a steady and
sturdy pace of growth as depicted in the
chart.
Operational Efficiency:
Cost to Income ratio is the one of the main indicators of operational efficiency of the bank. There is a direct
relationship between NPA and Cost to Income Ratio. During the periods of rising NPA, cost to income proportion
will generally shoot up for banks, thanks to non-recognition of income from NPA accounts. In the below chart,
it is obvious that between Annual result of FY 2015 and 2016 Q1 quarterly result, cost to income ratio zoomed
in by around 7 %. On the expenditure side, we can see that era of branch expansion is over and the bank
currently focuses on extracting more productivity from the existing braches, hence we do not see a dramatic rise
in operational expenditure in terms of incremental man power and branch maintenance expenditure Hence
NPA largely accounts for the spike in the ratio. Based on this hypothesis, we have drawn another Cost to Income
ratio projection chart (in next slide)
0%
2%
4%
6%
8%
10%
12%
14%
2012 2013 2014 2015 2016 Q1 2016 Q2
Cost to Income growth (in %)
Cost to Income
6. Federal Bank Ltd – Fundamental Report
We hope that the bank will come
clean most of its NPA woes by FY
2017E. In such a situation, we project
that cost to income ratio will come
down significantly.
0
20
40
60
2015 2016E 2017E 2018E
Projected Cost to Income Ratio
Cost to Income
Non-Interest Income:
Regarding its non-interest income, Forex trading business was impacted due to slow down in Middle
East. However GIFT city initiatives and growth on retail loan front, have boosted fees income. Hence,
we scaled down our expectations on non-interest income and estimated some degree of de-growth in
FY 2016E.Hnowever we forecast that the growth momentum will be restored in full scale in FY 2017E
aided by fee income and third party financial product distribution.
Profitability:
Bank’s bottom line growth depends on the growth in advances, non-interest income and level of NPA.
Spike in NPA witnessed during the first quarter of the Current Financial Year has impacted the interest
income and necessitated higher provisioning, leading to lower profit.NPA level has remained sticky
during the successive 2 quarters as well. In view of these facts, we estimated that in FY 2016, Federal
Bank will register dip in net profit after witnessing a CAGR growth of 17.40 % over the last 5 years.
We are optimistic that bottom line growth will be revived in FY 2017E, buoyed by impressive uptick in
corporate , SME and housing loan growth. We also hope that bank’s NPA overhang will be turned
around by then.
0
500
1000
1500
2000
2011 2012 2013 2014 2015 2016 E 2017 E 2018 E
Projected Net Profit Growth in Crores
Net Profit
7. Federal Bank Ltd- Fundamental Report
0
1
2
3
4
2011 2012 2013 2014 2015 2016E 2017E 2018E
Net Interest Margin
Net Interest
Margin
Net Interest Margin (NIM) is one o the
Key Performance Indicators (KPIs) of the
bank.NIM gives an idea as to how much
net income a bank generates from its
core business. As per our assessment,
Net Interest Margin has hit the rock
bottom in the CY and is poised to rise in
the coming Financial Years. Falling cost
of deposit and rising CASA proportion
will be acting in favour of Net Interest
Margin and make an overall picture
about Federal bank rosy in the near
term.
Share Holder’s wealth:
Maximizing shareholder’s wealth is the core objectives behind existence of every business entities. In
order to gauge the accretion to the wealth, we have ratios like Earning Per Share, Return on Equity, Book
Value Per Share etc.
0
10
20
30
40
50
60
2012 2013 2014 2015 2016 E 2017E 2018E
Book Value Per Share
Book Value Per Share
Book Value per
share has been
steadily rising and
as per our
estimate ,it is
likely to cross Rs.
50 in FY 2018
8. Federal Bank Ltd– Fundamental Report
0.00
5.00
10.00
15.00
20.00
2011 2012 2013 2014 2015 2016 E 2017 E 2018 E
Return on Equity
Return on Net Worth
Liabilities 2011 2012 2013 14 2015 2016 E 2017E 2018 E
Share Capital 171.05 171.05 171.06 171.06 171.33 343.34 344.67 345.2
Total Reserves 4846.65 5421.25 6092.86 6689.65 7528.94 7825 8021.17 8716.61
Shareholder's Funds 5017.7 5592.29 6263.92 6860.71 7700.27 8168.34 8365.84 9061.81
Deposits 42988.45 48934.73 57611.17 59729.04 70822.69 76810.78 83614 93097
Borrowings 1888.36 4266.04 5239.05 5767.54 2392.98 3018 2927 3517
Other Liabilities & Provisions 1448.33 1751.17 1878.82 2287.55 1992.35 2340 2510 2617
Total Liabilities 51343 60544 70993 74645 82908 90337 97417 108292.81
Assets
Cash and Balance with Reserve Bank of
India 2936.35 2429.68 2748.86 3108.37 3381.98 3710 3935 4416
Balances with Banks and Money at Call 813.25 1108.7 977.67 1425.81 1402.46 1812 2216 2357
Investments 14407.9 17102.02 20854.49 23838.59 24189.81 26616 28014 33023
Advances 31957.81 37945.85 44327.42 43703.81 51529.19 55457 60422.03 65117
Net Block 292.92 337.03 412.08 413.84 446.1 471.12 515.81 562.8
Other Assets 934.61 1620.96 1670.03 2131.8 1932.16 2271 2314 2817.01
Total Assets 51343 60544 70993 74645 82908 90337 97417 108292.81
As per our estimate ,barring 2016E, return on equity will be on the path of steady rise . NPA woes and slow
down in non-interest income are likely to cause some amount of erosion in the return generated to Equity
share holders.
Financial Statements Rs. In Crores
9. Federal Bank Ltd– Fundamental Report
Financial Year 2011 2012 2013 2014 2015 2016 E 2017 E 2018 E
Interest Earned 4052.03 5581.72 6246.32 7005.7 7487.77 7633.17 8396.487 9152.171
Interest Expended 2304.49 3606.67 4208.94 4727.76 5056.33 5199.87 5459.864 5808.276
Net Interest Income 1747.54 1975.05 2037.38 2277.94 2431.44 2433.3 2936.624 3343.895
Other Income 518.33 532.2 664.64 685.18 878.54 746.52 903.2892 921.355
Operating Expenses 836.54 1008.06 1228.59 1493.5 1675.21 1718.56 1804.488 1894.712
Provisions and Contingencies 525.44 334.89 263.54 267.87 105.2 343.49 195.2062 235.6642
Profit before Tax 903.89 1164.3 1209.89 1201.75 1529.57 1117.77 1840.219 2134.874
Tax 315.42 392.79 359.68 372.83 517.48 338.38 588.8699 683.1595
Profit after Tax 588.47 771.51 850.21 828.92 1012.09 779.39 1251.349 1451.714
Share of Associate -32 -17.78 2.45 20.83 45.72 54.25 71 86
Consolidated Profit 556.47 753.73 852.66 849.75 1057.81 833.64 1322.349 1537.714
2016 Q3 2016 Q2 2016 Q1 2015 Q4 2015 Q3
Interest Earned 1902.76 1902.26 1913.15 1908.28 1870.1
Interest Expended 1297.56 1293.92 1308.39 1285.05 1282.94
Net Interest Income 605.2 608.34 604.76 623.23 587.16
Other Income 183.31 182.27 193.94 306 219.91
Operating Expenses 463.03 454.04 431.49 460.08 409.72
Provisions and Contingencies 75.11 87.28 153.1 39.78 -0.82
PBT 250.37 249.29 214.11 429.37 398.17
Tax 87.65 88.01 72.72 148.84 133.48
Profit after Tax 162.72 161.28 141.39 280.53 264.69
Quarterly results
Outlook and Valuation:
Banking Industry is going through its worst phase in terms of stressed assets at its peak. The most recent
quarterly financial result of banks unearthed huge amount of bad loan which is far above what industry and
street had expected. Asset quality review which is being conducted by RBI appears to have vowed to clean up
the balance sheet of banks by FY 2017 by flushing out the spiraling NPAs. Global growth concerns and
commodity route have increased stress level in the balance sheet of companies due to weakening realization
and decreased cash flow. These domestic and global scenario have posed huge challenge to Federal Bank
although its exposure to the most stressed iron and steel sector is insignificant. As far as Federal Bank is
concerned, the abrupt surge in bad loan during the current Financial Year has sent a shock wave to investors.
As we come closer to this Financial Year, we can see that bank has not yet been relieved from the grip of bad
loan woes. However, management exudes confidence that worst is behind now and bank is well prepared to
alleviate the concerns of its stakeholders through concerted efforts of the reinforced top management to
address NPA issues, renewed focus on loan growth ,digitalization and branch optimization etc.
10. Federal Bank Ltd-Fundamental
Our target price of Rs. 56 is based on the Gordon multi-stage growth model where we have applied
Residual Income Method of valuation. Our cost of equity is 12.54 % .We have applied a persistency factor
of 0.80 to arrive at a continuing residual value. Key hypothesis used while forecasting the financial
statement is that by FY 2017, the bank will get rid of most of its NPA worries and improve bottom line.
Similarly a sturdy pace of loan growth and a revival in growth momentum on non-banking operations
front will boost the top line.
Investors can accumulate the stock of Federal Bank Ltd on every dip and exit their investment when the
stock price reaches Rs. 56 with a holding period of 1 year.
Risks to Investment:
Below are the probable risk factors which investors have to bear in mind while buying stocks of Federal
Bank
Slower than expected corporate loan growth will impact top line growth which is expected to pick up in
FY 2017
Further slow down in Middle East economies will affect deposit flow from NRI segment and is likely to
cause dip in CASA proportion to over all deposit. This will erode Net Interest Margin of bank
Likelihood of more number of NBFCs obtaining bank license will intensify the competitive landscape
in banking sector. Moreover, the advent of payment banks is likely to pose challenges as far as current
and saving deposit space is concerned
Analyst's Disclaimer: This report reflects my personal opinion based on an in-depth study on some primary reports which
are available in public domain. Please do not make any investment decision purely based on this report. Please read it along
with other reports and make any investment decision after consulting your financial advisor. I will not be responsible in case
any one incurs any loss due to this report