
Recommended
More Related Content
What's hot
What's hot (20)
Similar to RESEARCH.docx
Similar to RESEARCH.docx (20)
Recently uploaded
Recently uploaded (20)
RESEARCH.docx
- 1. A COMPARATIVE ANALYSIS OF FINANCIAL PERFORMANCE INDICATORS BETWEEN PUNJAB NATIONAL BANK AND HDFC BANK After the end of the nationalization the Indian bank system with a big branch net and a wide range of finance instruments has considerably developed. Because the bank branch grows today at rapid speed and competition, it has more than 11.75150 employees and has 1.09811 branches in completely India and 171 branches abroad and has inserts at the rate of 67,504.54 milliards and bank loans of Rs. 52,604.59 milliards administers. The banking sector has a very important place in our Indian economy. The height of the profit indicates the efficiency of the organisation, the greater the profit higher the growth rate. The profitability depends on the actual use of the means to earn maximum profit for the growth. The present research paper is an attempt to make a comparative study between the growth rate in the Punjab Nationwide to bank and the bank HDFC. As a growth analysis of both banks for a period of 5 years, so from 2017 to 2021, it is made. The most important growth parameters at banks are the growth of the clear profit, the growth of the net assets, ROA (Return on Assets) and NPA INTRODUCTION The banking is one single branch which encloses one dozen enterprises, like Corporate Banking, Investment banking, Small business Banking, administration of property, capital markets et cetera. In addition, is the private customer's business which distinguishes itself by a big number of customers, accounts and transactions, a variety of products and services, a high dependence on technology and an excellent cooperation between banks, retail dealers? Enterprises and consumers Banks have more capacities than they can be of use; consumers need a bank account to receive state achievements; and the banks further consolidate to a small number of major banks. This consolidation can be a good one or a bad thing. Absolutely smaller banks will have to develop successful strategies to be able to compete with big banks, and such a competition will be of benefit for the customers. Hope could be that even if we have a handful of banks at the end, they compete at least with each other and do not feel fine, the competition together begin. But this could be a dream. We need a real competition. After the end of the nationalisation the Indian bank system with a big branch net and a wide range of finance instruments has considerably developed. How the bank branch grows 2017. The bank has a paid-up capital of 370.91 crore like in March, 2017, at the age of more than 120 years of purposeful existence, more than 8.9 crore customers by 6200 branches she has grown. What concerns the bank HDFC, it was founded in 2014 by the reserve bank of India. It was the first bank which received the approval from the RBI to be based as private Sector bank. The capital deposited in March, 2016 amounts to Rs. 501.2990,634, the company capital rate amounts to 16.1% and to 3659 branches with 11766 cash machines in March,2017.
- 2. OBJECTIVE OF STUDY To check growth rate of the both to examined banks The growth compare between private (bank HDFC) and the bank of the public sector (PNB) RESEARCH METHODOLOGY With the present study it concerns the secondary data which are collected from different magazines, reports by RBI and business reports of banks, moneycontrol.com. The study time is limited, from 2016-17 to 2020-21 CONCEPT OF GROWTH Growth is to be grown the draught for the banking sector in a profitable manner, in assets, in the number of the branches and networks in the number of the cash machines, in the company capital rate, but less in percent of the NPA. Every year the aims are fixed by the banks to reach them, different kinds of patterns are initiated and the interest is adapted for inserts and loans. The increase of the business per employee of the bank is valued in comparison to the year before. Company profit, clear profit, yields share, dividend share, capital yield, company capital yield, interest cover rates are the other graduations to measure the growth of an enterprise for a longer period. Growth also indicates to compare the clear profit of the current year to the last year's profit. All this depends, primarily, on the factor which is very important in the latest scenario, is the customer satisfaction and the quick services of the banks. Also the technology factor affects very much hardly the growth. The bank which makes available the customer which they grow fast on every growth parameter, the quick services. COMPARISON OF NET ASSETS GROWTH The net property is the sum of the property side of the balance which excludes a regulation for the depreciation fund or the assets stated to the book value less write-off costs or the market value of the property value to disarm, less the expected loss or the transfer to reserve compared with this property value. This sum of the assets side excludes the fictive property if on the assets side of the balance like pre - expenditures, discounts have been reflected paid interest on the issue of shares or debentures, from capital etc. The net property encloses both kinds of assets, i.e., the capital assets, as well as the present property which owns the enterprise which is in the possession of the concerning enterprise. These assets form the basis to enable the enterprises, to carry out her business activity to the proceed and to strengthen her position during the coming years. These assets are provided by the enterprise from different springs in the liability side of the enterprise, i.e. owner fund and borrowed funds or the internal resources of the enterprise from profits.
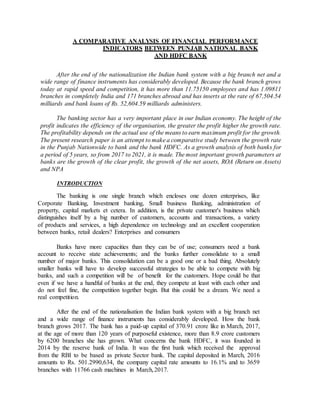
- 3. An indicator of how profitable a bank is relative to its total assets. ROA gives an idea as to how efficient management is at using its assets to generate earnings. Calculated by dividing a company's annual earnings by its total assets. Sometimes this is referred to as "return on investment". The formula for return on assets is: Net Income / Total Assets BANK YEAR Mar’21 Mar’20 Mar’19 Mar’18 Mar’17 AVERAGE PNB 6.40 6.47 6.62 6.26 6.56 6.462 HDFC 6.91 7.50 7.95 7.54 8.02 7.584 In PNB return on assets is 6.56 during the year Mar’17. This ratio represented mixed trend during the study period and decreased up to level of 6.40 in the year Mar’21. This shows net decrease of 0.16 as compared to the year Mar’17. The average of this ratio during the study period is 6.46. 0 1 2 3 4 5 6 7 8 9 Mar’21 Mar’20 Mar’19 Mar’18 Mar’17 AVERAGE RETURN ON ASSETS PNB HDFC
- 4. In HDFC Bank Ltd. Return on assets is 8.02 during the year Mar’17. This ratio represented increasing trend during the study period and reached up to 6.91 in the year Mar’21. The average of this ratio during the study period is 7.58. GROWTH RATE OF NET PROFIT / LOSS The group profit is that what is left from the turnover of an enterprise after deduction of all costs. It becomes called also as a clear profit, profit or, all in all. The net income which is not paid in dividends is added to the profit reserves. The rising (sinking) clear profit is a good (bad) sign for the profitability of an enterprise. Enterprises with consistent and rising group profit in the course of the time are valued by the stockholders very positively. The clear profit is on other base for the comparison of the achievement of these both banks PNB and HDFC. The clear profit growth concerning the Punjab Nationwide bank and the bank HDFC was calculated by the production of the clear profit after taxes to judge the absolute growth of the clear profit by taxes. Net Profit PNB and HDFC Bank Years PNB HDFC Amount Amount Mar’21 2,021.62 31,116.53 Mar’20 336.19 26,257.32 Mar’19 -9975.49 21,078.17 Mar’18 -12282.82 17,486.73 Mar’17 1324.80 14,549.64 The table shows the trends in net profit of PNB and HDFC Bank. Table reveals information about the CAGR of both banks. It presents that CAGR for net profit of HDFC Bank is more than PNB. Gap between CAGR for net profit of PNB is too far from HDFC Bank.
- 5. It shows the trends in AGR of NET Profit of PNB and HDFC Bank. It shows AGR for net profits of HDFC Bank is positive all years but diminishing year on year and CAGR for net profit of bank (13.22) is more than PNB. On other side AGR for net profits of PNB is diminishing and it negative after FY Mar’18 to upto end and CAGR for net profit of PNB (- 17.09) is negative. Table indicates that performance of HDFC Bank in term of net profit is better compare to PNB. -15,000.00 -10,000.00 -5,000.00 0.00 5,000.00 10,000.00 15,000.00 20,000.00 25,000.00 30,000.00 35,000.00 Mar’21 Mar’20 Mar’19 Mar’18 Mar’17 PNB HDFC
- 6. NPA (NON-PERFORMING ASSETS) A debt obligation with which the borrower to the designate credit grantor has paid no before agreed interest and capital repayments for a longer period. The Non-Performing Asset gains to the credit grantor, hence, no yields in the form of capital and interest payments An asset becomes non performing when it ceases to generate income for the bank. In this respect, the RBI has prescribed a standard norm of 5 percent maximum. All the banks in India are required to follow this. Net NPA NPA Ratio = ------------- x 100 Total Advances Where Net NPA = Gross NPA‘s – Provision for NPA‘s And Total Advances = Total Advances are taken as per the amount shown in the assets side of the balance Sheet of the bank. All banks have to make full provisions for NPA‘s as per the prudential norms of RBI. Net NPA Ratio BANK YEAR AVERAGE Mar’21 Mar’20 Mar’19 Mar’18 Mar’17 PNB 6.00 6.00 7.00 11.00 8.00 7.6 HDFC 0.00 0.00 0.00 0.00 0.00 0.00
- 7. In PNB, Net NPA Ratio is 8.00 during the year Mar’17. This ratio represented increasing trend during the study period and increased up to level of 6.00 in the year Mar’21. This shows net decrease of 2.00 as compared to the year Mar’17. The average of this ratio during the study period is 7.6. In HDFC Bank, Net NPA Ratio is 0.00 during the year Mar’17. This ratio represented decreasing trend during the study period and decreased up to level of 0.00 in the year Mar’21. This shows net decrease of 0.00 as compared to the year Mar’17. The average of this ratio during the study period is 0.00. In PNB, Net NPA Ratio is 8.00 during the year Mar’17. This ratio represented increasing trend during the study period and increased up to level of 6.00 in the year Mar’21. This shows net decrease of 2.00 as compared to the year Mar’17. The average of this ratio during the study period is 7.6. In HDFC Bank, Net NPA Ratio is 0.00 during the year Mar’17. This ratio represented decreasing trend during the study period and decreased up to level of 0.00 in the year 0 2 4 6 8 10 12 Mar’21 Mar’20 Mar’19 Mar’18 Mar’17 Average Net NPA Ratio PNB HDFC
- 8. M ar’21. This shows net decrease of 0.00 as compared to the year M ar’17. The average of this ratio during the study period is 0.00.