SlideShare a Scribd company logo
1 of 39
Download to read offline
DISCLOSURE APPENDIX AT THE BACK OF THIS REPORT CONTAINS IMPORTANT DISCLOSURES, ANALYST
CERTIFICATIONS, AND THE STATUS OF NON-US ANALYSTS. US Disclosure: Credit Suisse does and seeks to do
business with companies covered in its research reports. As a result, investors should be aware that the Firm may have a
conflict of interest that could affect the objectivity of this report. Investors should consider this report as only a single factor in
making their investment decision.
CREDIT SUISSE SECURITIES RESEARCH & ANALYTICS BEYOND INFORMATION®
Client-Driven Solutions, Insights, and Access
10 April 2015
Asia Pacific/Indonesia
Equity Research
Regional Banks (Banks ID (Asia)/Banks HK (Asia))
Indonesia Banks Sector
SECTOR REVIEW
Indonesia trip: What worries the banks?
Figure 1: Indonesia—Profit growth of large four and smaller four banks
(Large–BMRI, BBCA, BBRI, BBNI; Smaller–BDMN, BTPN, BBTN, BJBR)
13
25
30
40
32
20 19
14
8 9
51
-11
9
75
23 25
7
-26
24 20
-40
-20
0
20
40
60
80
100
2007 2008 2009 2010 2011 2012 2013 2014 2015E 2016E
Top four banks (YoY, %) Smaller four banks (YoY, %)
Source: Company data, Credit Suisse estimates
■ What are the banks concerned about? (1) Currency, (2) regulatory
intervention, and (3) tax target and government spending. Aside from
depositor behaviour, the bigger concern from currency volatility is the US$162
bn corporate borrowings. On regulatory burden, banks cite eight areas where
regulators are intervening including directed lending (MSME, productive) and
national service (financial inclusion, M&A). Thirdly, government efforts to
achieve 30% target growth in tax revenues may spook banks' customers and
a shortfall would mean a delay in spending boost in the second half.
■ Fortunes of large versus smaller banks to reverse. From 17% CAGR of
past decade, we project large four banks to report high-single-digit earnings
growth in the next two years (see chart above). They are likely to give back
part of the 50-70 bp expansion in margins (thanks to the May-Sep’13 175 bp
rate hike) as BI cuts rates in late 2015/early 2016 (our economists expect
100 bp cuts). And credit costs should continue to normalise higher. On the
other hand, smaller banks saw their margins crushed and asset quality
deteriorate last year and should be turnaround candidates in 2015-16E.
■ Prefer smaller banks, BTPN our top pick: We changed our preference to
smaller banks following the surprise 25 bp rate cut of February. We upgrade
BTPN to OUTPERFORM from Underperform and BJBR to OUTPERFORM
from Neutral. We revise earnings by 2-5% for 2015-16E and target prices go
up on higher ROEs as well as on rolling forward our calculations.
Research Analysts
Sanjay Jain
65 6306 0668
sanjay.jain@credit-suisse.com
10 April 2015
Indonesia Banks Sector 2
Focus charts and table
Figure 2: ROA trends—Large four banks, smaller four banks and aggregate 8 banks (%)
1.8 1.7
1.8
2.1
2.5
2.8 2.9 3.0 2.9
2.8 2.7
1.7
2.1
1.6 1.6
2.3 2.3 2.3
2.1
1.4
1.6
1.71.8 1.8 1.8
2.0
2.5
2.7 2.8 2.8
2.7 2.6 2.6
0.0
0.5
1.0
1.5
2.0
2.5
3.0
3.5
2006 2007 2008 2009 2010 2011 2012 2013 2014 2015E 2016E
ROA - Top four banks (%) ROA - Smaller banks (%) ROA - Overall 8 banks (%)
Source: Company data, Credit Suisse estimates
Figure 3: Asian currencies vs USD (3-years change, %) Figure 4: Proportion of MSME loans to total loans (%)
1
-23
3
-5
-43
-5
-20
-8
0
-4
-12
-35
-44-50.0
-40.0
-30.0
-20.0
-10.0
0.0
10.0
CN IN KR TW ID TH MY SG HK PH PK AU JP
43.8
21.6 20.3
15.5
13.0
9.2 8.7 7.9
0
10
20
30
40
50
BBRI BTPN BBNI BMRI BBTN BDMN BBCA BJBR
Source: Bloomberg, Credit Suisse estimates Source: Company data, Credit Suisse estimates
Figure 5: ID banks' price performance (%) Figure 6: Price/Assets (x) vs. ROA (%)
61
54
39 37 37
20
-8
-18
12
18
-2
12 14 12
4
32
-40
-20
0
20
40
60
80
BBRI BBNI BBTN BMRI BBCA BDMN BTPN BJBR
2014 YTD2015
BRI
BCA
MandiriDanamon BNI
BJBR
BTPN
BBTN
ID
5
15
25
35
45
55
65
0.80 1.30 1.80 2.30 2.80 3.30
Mcap / Assets 2015E (%)
ROA '15E
Source: Bloomberg, Credit Suisse estimates Source: Credit Suisse estimates
Figure 7: Revision in profit forecasts (Rp bn) and consequent impact on ROAs, ROEs, target prices and ratings
Rp bn Revised Old Change % ROA ROE Norm- Tgt Tgt Tgt Curr. Old Rating
% '15E '16E '15E '16E '15E '16E '15E '16E '15E '16E alised P/B P/E Price Price Ups. TP New Old
BMRI 936 1,046 919 1,007 1.9 3.9 2.40 2.37 19.8 19.1 20.3 2.8 13.9 13,700 12,075 13.5 11,800 O O
BBCA 732 767 727 766 0.8 0.2 3.08 2.88 21.2 18.8 25.3 4.1 16.1 13,600 15,025 -9.5 11,500 U U
BBRI 1,053 1,165 988 1,009 6.6 15.4 3.14 3.16 24.3 22.6 26.8 3.2 12.1 14,000 13,100 6.9 11,500 N N
BBNI 607 659 594 632 2.2 4.4 2.56 2.45 18.8 18.5 21.3 2.5 11.5 7,550 7,225 4.5 6,000 N N
BDMN 340 414 424 506 -19.7 -18.2 1.61 1.79 9.6 10.8 16.0 1.4 8.8 4,100 5,050 -18.8 3,050 U U
BTPN 385 449 395 447 -2.7 0.4 2.81 2.89 17.6 17.7 22.8 2.5 11.0 5,050 4,095 23.3 3,950 O U
BBTN 143 177 146 182 -2.3 -3.1 0.97 1.04 11.9 13.3 13.3 1.0 7.2 1,100 1,185 -7.2 950 N N
BJBR 131 156 107 130 22.2 19.5 1.57 1.64 16.9 18.1 17.5 1.5 8.3 1,150 965 19.2 800 O N
Source: Credit Suisse estimates
10 April 2015
Indonesia Banks Sector 3
What worries the banks?
In our Indonesia trip, we met with banks as well as a few infrastructure-related companies.
Top three concerns of banks: (1) Currency, (2)
regulatory intervention, (3) tax target, govt spending
Indonesian Rupiah has depreciated by 43% in past three years, second worst after JPY in
Asia. Ordinary citizens associate falling IDR with a crisis, and could potentially lead to a
capital flight = loss of deposits. Indonesian corporate sector has borrowed US$162 bn
from overseas with majority being unhedged and by companies who are generally
supposed to have a natural hedge but that has been eroded by commodity prices.
Banks cite eight regulations hampering the sector: (1) directed lending such as UMKM
(micro and small enterprise) loans to be 20% of loans by 2018. BCA would struggle on
this; (2) directed lending of 70% to be "productive" loans; (3) national service through
financial inclusion initiatives = higher cost for banks; (4) national service through
consolidation as OJK wants to trim number of bank licences from 118 to 80; (5) 40%
ownership cap on single shareholder; (6) foreign worker restrictions exacerbating talent
shortage; (7) pricing controls such as on time-deposits (against the BI monetary policy)
and potentially on micro lending, and (8) lack of clarity on Basel 3 capital requirements and
improper co-ordination within OJK.
Tax revenues missing government's 30% target would delay spending (particularly on
infrastructure)—our economists forecast GDP to bottom in 2Q on this expectation. Banks'
customers are being alarmed by measures to boost tax revenues such as arbitrary
increases in tax to be paid by each corporate, tax officials trying to obtain the names of
Indonesians who own property or place large deposits with banks (this was abandoned by
government on fears of capital outflows), expanding the scope of luxury (capital gain) tax
on property, etc. Macro backdrop also remains challenging—high real rates are pressuring
the economy while exports fell in 2014 vis-à-vis 2011 despite 43% weaker currency. Our
economists believe that government would let fiscal deficit go higher if tax falls short.
Fortunes of large versus smaller banks to reverse
From 17% CAGR of past decade, we project large four banks to report high-single-digit
earnings growth in the next two years. 2015 is likely to be affected by a modest crimping of
margins and increase in credit costs while 2016 should see a bigger margin compression
from the anticipated 100 bp rate cuts of 4Q15-1Q16E. The smaller banks should enjoy the
opposite trends – they suffered massively in 2014 as their margins were crushed by higher
policy rates and asset quality deteriorated, and should be recovery candidates in 2015-
16E as their credit costs should remain stable while margins expand.
Prefer smaller banks, BTPN top pick
We changed our preference to smaller banks following the surprise 25 bp rate cut of
February. We upgrade BTPN to OUTPERFORM from Underperform and BJBR to
OUTPERFORM from Neutral. We revise earnings by 2-5% for 2015-16E on aggregate for
the eight banks under our coverage on slightly wider margin assumptions slightly lower
credit costs. Our target prices go up on higher ROEs and rolling forward our calculations.
BTPN is our top pick among the Indonesian banks followed by BJBR.
Although Indonesia remains a very nice structural growth story and economy should
accelerate in 2016E, the large four banks are likely to suffer sharp margin compression
from rate cuts. Amidst the single digit EPS growth for the first time in many years,
valuations are fair at best (BCA is clearly expensive and it should see the most margin
squeeze). Among the large banks, Mandiri remains our top pick with its leverage into
infrastructure lending and focus on retail (including micro) that should underpin margins.
IDR down 43% in three
years; corporates have
US$162 bn of foreign
currency borrowings
Directed lending and lack of
clarity the most cited
concerns
Macro backdrop
challenging, could 30% tax
target make it worse?
Margin squeeze for large
banks as rates come down,
credit costs to continue
normalising
Indonesia a 2016 story;
Mandiri top pick among
large banks
10 April 2015
Indonesia Banks Sector 4
Valuation snapshot
Figure 8: Indonesia banks—valuation snapshot
(%) BMRI BBCA BBRI BBNI BDMN BTPN BBTN BJBR CS-Aggr.
Mkt cap Rp bn 277,200 371,674 322,549 132,466 48,156 23,677 12,417 8,495 1,175,722
USD mn 21,463 28,778 24,975 10,257 3,729 1,833 961 658 91,035
Rating O U N N U O N O
Current price Rp 12,000 15,075 13,075 7,175 5,075 4,095 1,175 885
Target price Rp 13,700 13,600 14,000 7,550 4,100 5,050 1,100 1,150
14.2 -9.8 7.1 5.2 -19.2 23.3 -6.4 29.9 2.6
Price performance YTD 11.4 14.9 12.2 17.6 12.2 3.7 -2.5 21.2
2014 37.3 36.7 60.7 54.4 19.9 -8.1 38.5 -18.0
5Y 142 172 221 226 1 193
10Y 610 787 794 349 50
ROA 2014 2.5 3.2 3.4 2.7 1.4 2.6 0.8 1.5 2.8
2015E 2.4 3.1 3.1 2.6 1.6 2.8 1.0 1.6 2.6
2016E 2.4 2.9 3.2 2.4 1.8 2.9 1.0 1.6 2.6
ROE 2014 20.9 23.4 27.4 20.2 8.1 17.1 9.4 16.4 21.2
2015E 19.8 21.2 24.3 18.8 9.6 17.6 11.9 16.9 19.9
2016E 19.1 18.8 22.6 18.5 10.8 17.7 13.3 18.1 19.0
P/B 2014 2.7 4.8 3.3 2.3 1.5 2.0 1.0 1.2 3.1
2015E 2.4 4.0 2.8 2.2 1.4 1.7 0.9 1.1 2.7
2016E 2.0 3.4 2.3 1.9 1.3 1.5 0.8 1.0 2.3
BVPS 2014 4,399 3,151 3,955 3,164 3,420 2,022 1,155 726
2015E 5,081 3,763 4,721 3,279 3,676 2,344 1,254 824
2016E 5,871 4,384 5,570 3,839 3,969 2,716 1,402 901
BVPS growth -3Y CAGR 18.4 22.7 25.1 16.1 5.5 26.8 11.2 9.4 23.8
+2Y CAGR 15.5 18.0 18.7 10.1 7.7 15.9 10.2 11.4 17.1
2014 17.4 21.6 23.2 24.1 4.9 19.2 5.6 5.4 19.5
2015E 15.5 19.4 19.4 3.6 7.5 15.9 8.5 13.4 14.8
PPOP/assets 2014 3.6 4.3 4.5 3.7 4.2 4.6 1.7 2.7 4.1
2015E 3.5 4.3 4.3 3.7 4.2 4.9 1.8 2.7 4.0
PPOP/loans 2014 5.6 6.6 6.6 5.3 5.7 6.7 2.2 3.8 6.1
2015E 5.5 6.4 6.4 5.2 5.8 7.0 2.3 3.8 6.0
PPOP growth 2014 13.7 15.2 13.7 25.1 -10.1 -4.8 -9.8 -12.7 12.6
2015E 13.0 9.7 11.5 9.6 7.1 18.5 20.4 13.3 11.1
2016E 11.4 4.7 11.2 9.4 13.8 17.2 21.4 16.7 10.1
P/PPOP 2014 9.7 16.3 10.1 9.0 6.0 7.2 5.3 4.3 10.7
2015E 8.6 14.9 9.0 8.2 5.6 6.0 4.4 3.8 9.7
EPS (Rp) 2014 852 671 983 578 272 317 106 116
2015E 936 732 1,053 607 340 385 143 131
2016E 1,046 767 1,165 659 414 449 177 156
EPS growth -3Y CAGR 17.5 15.2 17.1 22.8 -10.5 8.7 -6.3 5.3 15.9
+2Y CAGR 10.8 7.0 8.9 6.8 23.4 18.9 29.3 15.9 9.5
2014 9.2 16.0 13.6 19.1 -35.6 -13.0 -28.6 -18.1 8.6
2015E 10.0 9.2 7.2 5.1 25.3 21.3 35.2 13.0 9.4
2016E 11.7 4.8 10.6 8.6 21.5 16.7 23.7 18.9 10.3
P/E 2014 14.1 22.5 13.3 12.4 18.7 12.9 11.1 7.6 15.5
2015E 12.8 20.6 12.4 11.8 14.9 10.6 8.2 6.8 14.2
2016E 11.5 19.6 11.2 10.9 12.3 9.1 6.7 5.7 12.9
Dividend yield 2015E 2.2 1.0 2.7 2.3 2.3 1.9 2.4 10.6 2.0
Mkt cap/assets Avg'15E % 28.7 60.2 37.8 28.3 22.8 27.9 7.5 9.9 36.7
Mkt cap/loans Avg'15E % 44.6 90.5 54.2 40.2 31.0 40.3 9.3 13.8 54.2
Mkt cap/deposits Avg'15E % 38.1 74.8 49.3 37.2 38.3 39.7 10.0 12.8 48.6
Source: Company data, Credit Suisse estimates
10 April 2015
Indonesia Banks Sector 5
Operational snapshot
Figure 9: Indonesia banks—Operational snapshot
(%) BMRI BBCA BBRI BBNI BDMN BTPN BBTN BJBR CS-Aggr.
Loan Corporate 33.0 34.0 26.8 46.8 12.6 0.0 0.0 0.0 28.6
composition Comm'l/SME 37.0 37.9 25.6 27.9 30.9 0.0 9.0 13.9 29.5
Micro 6.8 0.0 31.3 0.0 13.6 29.3 0.0 9.1 11.4
Personal 12.2 28.1 16.4 19.9 42.8 66.8 91.0 77.0 26.8
Deposit Current 20.1 24.0 14.4 26.4 18.4 1.8 21.8 37.9 20.2
composition Saving 39.7 51.1 40.1 41.0 29.7 13.0 30.8 22.5 40.2
CASA 59.8 75.1 54.5 67.3 48.1 14.8 52.6 60.4 60.4
Time 40.2 24.9 45.5 32.7 51.9 85.2 47.4 39.6 39.6
Loan growth -3Y CAGR 19.2 19.7 20.4 19.2 11.9 19.9 22.2 23.3 23.2
2014 12.5 11.7 14.4 10.6 4.7 13.1 15.4 10.4 12.1
2015E 14.5 12.8 15.0 13.8 8.0 12.2 15.4 14.2 13.8
2016E 15.5 13.4 15.4 15.2 10.3 12.9 15.9 15.9 14.7
Deposit growth -3Y CAGR 14.7 11.5 17.4 10.7 10.7 14.4 19.8 13.9 14.7
2014 14.4 9.4 23.4 7.5 6.7 2.2 10.7 15.5 13.8
2015E 14.2 11.0 5.2 13.6 7.9 11.9 16.6 14.6 10.9
2016E 14.3 12.7 13.0 14.9 10.0 12.2 16.7 15.2 13.6
Loan/dep ratio 2014 85.3 81.3 83.1 92.4 123.2 98.3 108.9 93.6 88.3
2015E 85.5 82.6 90.9 92.5 123.4 98.6 107.8 93.3 90.6
Yield on IEAs 2014 8.5 8.8 11.4 8.7 12.7 18.3 11.0 12.1 10.2
2015E 8.5 8.7 11.3 8.8 12.5 18.0 10.9 12.0 10.2
Cost of IBLs 2014 3.6 2.6 4.1 3.3 6.1 8.9 6.5 6.5 4.0
2015E 3.6 2.6 4.2 3.4 5.7 8.3 6.3 6.1 4.0
NIM 4Q14 5.5 6.5 7.4 6.1 7.6 10.5 4.7 6.4 6.5
2014 5.3 6.5 7.8 5.9 7.9 10.5 4.5 6.1 6.6
2015E 5.3 6.4 7.6 5.8 8.0 10.7 4.6 6.3 6.6
2016E 5.1 6.2 7.5 5.7 8.2 11.0 4.7 6.5 6.5
Non int inc growth -3Y CAGR 12.7 7.7 21.8 17.9 3.4 58.8 21.5 30.8 15.4
2014 7.2 13.5 12.6 16.1 -15.6 90.7 16.0 63.5 9.0
2015E 12.7 10.8 13.0 12.5 12.2 27.8 11.3 13.2 12.5
2016E 12.8 9.3 14.3 12.9 12.8 21.7 13.6 12.2 12.6
Fee/revenue Avg'15E % 27.7 21.9 12.4 27.8 26.3 10.8 13.8 8.9 21.6
Fee/Assets Avg'15E % 1.9 1.7 1.0 2.2 2.6 1.2 0.7 0.6 1.7
Operating exp. -3Y CAGR 14.4 18.8 16.1 13.9 8.8 20.2 14.4 19.8 16.2
growth 2014 12.7 25.2 19.1 10.5 2.0 13.1 5.8 4.7 14.1
2015E 14.1 12.4 13.3 12.7 10.1 13.4 14.7 14.7 12.9
2016E 12.2 13.0 14.2 13.2 11.5 13.5 15.1 15.0 13.0
Cost/income Avg'15E % 47.5 45.2 45.9 52.9 57.6 56.6 62.4 60.4 48.6
Cost/Assets Avg'15E % 3.2 3.5 3.7 4.1 5.8 6.4 3.0 4.2 3.8
NPL ratio 2014 2.2 0.8 1.9 2.0 2.4 0.6 4.0 4.4 1.9
2015E 2.4 1.0 2.1 2.1 2.6 0.8 3.7 3.9 2.0
2016E 2.6 1.0 2.2 2.2 2.6 0.9 3.5 3.7 2.1
Credit cost (bp) 10Y avg 115 72 152 176 246 159 29 96 147
3Y avg 37 51 46 39 278 142 51 130 56
2014 51 65 75 65 284 155 73 129 84
2015E 67 66 89 72 274 151 60 130 90
2016E 70 60 89 72 266 160 60 125 89
LLR/Loans 2014 3.6 2.0 3.1 2.3 2.0 1.0 1.4 3.1 2.7
LLR/NPLs 2014 175 220 164 132 106 154 34 72 143
Core T1 CAR 2014 14.8 16.2 17.1 15.2 17.3 22.4 14.1 15.1 16.1
2015E 14.9 16.6 17.2 13.9 17.4 22.8 13.5 14.7 16.0
Source: Company data, Credit Suisse estimates
10 April 2015
Indonesia Banks Sector 6
The main concerns of banks
In our meetings, banks cited currency, regulatory intervention and government tax revenue
targets (and weak macro backdrop) as the main concerns.
(1) Currency
Indonesian rupiah has depreciated 43% in past three years (4 April 2012 to 4 April 2015)
vis-à-vis the USD, neck-and-neck with JPY's 44%.
Figure 10: USDIDR versus IDR REER Figure 11: Asian currencies vs US$ (3-years change, %)
80
85
90
95
100
105
1108,000
9,000
10,000
11,000
12,000
13,000
Jan-08 Dec-08 Nov-09 Oct-10 Sep-11 Aug-12 Jul-13 Jun-14
USDIDR REER (RHS)
1
-23
3
-5
-43
-5
-20
-8
0
-4
-12
-35
-44
-50
-40
-30
-20
-10
0
10
CN IN KR TW ID TH MY SG HK PH PK AU JP
Source: the BLOOMBERG PROFESSIONAL™ service, BIS Source: the BLOOMBERG PROFESSIONAL™ service, CS estimates
In the past, currency fluctuation in Indonesia has been associated with periods of stress
(1998 Asian Financial Crisis, 2008 Global Financial Crisis). Although this time it has had
more to do with USD strength rather than IDR weakness, banks are concerned that the
expectation could become self-feeding and potentially lead to deposit outflows. While
liquidity situation has eased lately on account of subdued loan demand, there is a risk to that.
Figure 12: Indonesia banking system loan growth, deposit growth and loan-to-deposit ratio (%)
20.5 19.5
27.3
25.8
14.0
26.0
30.8
10.1
23.3
24.7
23.1
21.4
11.6
4.4
7.6 8.7
16.8
14.2
19.0
15.0 13.8
20.4
18.7
15.6
13.0 12.2
46.4
51.5
60.2
64.9 64.8
68.6
78.1
75.6 77.4
81.3
86.6
92.9 92.4
0
20
40
60
80
100
0
10
20
30
40
50
60
2002 2003 2004 2005 2006 2007 2008 2009 2010 2011 2012 2013 2014
Loan growth (%) Deposit growth (%) Loan-deposit ratio (RHS, %)
Source: CEIC, Credit Suisse estimates
10 April 2015
Indonesia Banks Sector 7
Indonesia is unique in a way from some other emerging markets such as China, India,
Thailand in that it allows its citizens to keep assets/cash in foreign currency (in addition to
that, some wealthy Indonesians also keep undeclared sums overseas).
Figure 13: Asia: Banking system loan and deposit growth (10Y CAGR) and 2014 loan-to-deposit ratio (%)
16.4
19.8
8.3
4.0
20.9
8.1
10.1
12.2 13.0 12.9
9.8
17.4 17.4
7.2
5.3
15.9
7.6
10.2 10.9 10.3 10.1
10.7
66.7
76.1
115.7
76.3
92.4
96.0
81.6
62.8
110.5
72.2
115.3
0.0
20.0
40.0
60.0
80.0
100.0
120.0
140.0
0.0
5.0
10.0
15.0
20.0
25.0
30.0
35.0
40.0
45.0
50.0
CN IN KR TW ID TH MY PH SG HK AU
Loans 10Y CAGR (%) Deposits 10Y CAGR (%) Loan-deposit ratio, 2014 (RHS, %)
Source: CEIC, Credit Suisse estimates
One problem cited by banks was that the monetary authority BI has embarked on the rate
cut cycle prematurely when it was forced to trim policy rate by 25 bp in February. At that
time, BI's take on currency was that controlled depreciation is good for Indonesian exports
and leads to a natural adjustment in current account through imported inflation. Now the
problem is that, if required, BI cannot use interest rates as a tool to defend the currency
since it would appear to be flip-flopping. Kindly note that two-fifths of IDR government
bonds are owned by foreigners.
Figure 14: Indonesia—CPI vs BI rate (%) Figure 15: ID—Real policy rate using CPI and GDP deflator
0.0
2.0
4.0
6.0
8.0
10.0
12.0
14.0
16.0
18.0
20.0
Mar-01 Mar-03 Mar-05 Mar-07 Mar-09 Mar-11 Mar-13 Mar-15
CPI (%) BI rate (%)
-20.0
-15.0
-10.0
-5.0
0.0
5.0
10.0
15.0
Mar-01 Mar-03 Mar-05 Mar-07 Mar-09 Mar-11 Mar-13 Mar-15
Real policy rate using CPI Real policy rate using GDP deflator
Source: the BLOOMBERG PROFESSIONAL™ service, CEIC, Credit
Suisse research
Source: the BLOOMBERG PROFESSIONAL™ service, CEIC, Credit
Suisse research
One of the biggest risks of currency depreciation is unhedged borrowings of the corporate
sector. As per BI, Indonesian corporate foreign currency borrowings are US$162 bn.
10 April 2015
Indonesia Banks Sector 8
Concerned about this, BI has imposed a requirement of 20-30% compulsory hedging on
corporate sector on the portion of debt coming due in three to six months.
Figure 16: Indonesia—External debt (US$ mn) 2005-14 and as % of GDP
50,580 52,927 56,032
68,480 73,606
83,789
106,732
126,245
142,572
162,843
16.5
13.2
12.1
14.7
11.6
11.0
12.3
14.1
17.6
19.0
0.0
2.0
4.0
6.0
8.0
10.0
12.0
14.0
16.0
18.0
20.0
0
40,000
80,000
120,000
160,000
200,000
240,000
2005 2006 2007 2008 2009 2010 2011 2012 2013 2014
Indonesia's external debt (USDmn) Ext. debt to nominal GDP (RHS, %)
Source: Bank Indonesia, CEIC, Credit Suisse estimates
This increase in value of foreign currency debt comes at a time when Indonesian
corporate sector is facing a sharp slowdown in revenue as well as EBITDA growth, both
running at roughly half the decade-average levels, hence may not find it easy to bear (or to
pass on to the customers).
Figure 17: Indonesian corporate sector sales growth (CS
coverage, ex-financials), 2005-15E
Figure 18: Indonesian corporate sector EBITDA growth
(CS coverage, ex-financials), 2005-15E
14%
17%
26%
6%
15%
12%
20%
13%
7%
10% 10%
0%
5%
10%
15%
20%
25%
30%
'05 '06 '07 '08 '09 '10 '11 '12 '13 '14E '15E
21%
9%
30%
23%
21%
6%
14%
7%
-1%
10%
11%
-5%
0%
5%
10%
15%
20%
25%
30%
35%
'05 '06 '07 '08 '09 '10 '11 '12 '13 '14E '15E
Source: Credit Suisse estimates Source: Credit Suisse estimates
Not only growth, profitability of Indonesian corporate sector had also come under pressure
by 2013 (we do not have data for 2014 yet). And despite the 43% currency decline in past
three years, Indonesia is one of the rare countries to be suffering smaller export value
(partly due to sharp fall in prices of coal/CPO and partly due to commodity demand
slowdown in China) – a boom in exports could have helped the borrowers repay their
USD loans.
10 April 2015
Indonesia Banks Sector 9
Figure 19: Indonesian corporate (ex-financials) ROIC (%) Figure 20: Asia: Exports 2011 vs 2014 (US$ bn)
10.2
12.1
13.3
12.5
17.6
13.4 13.4
14.5
16.1
14.1
11.2
0
2
4
6
8
10
12
14
16
18
20
'03 '04 '05 '06 '07 '08 '09 '10 '11 '12 '13
303
555
292
203
219 228 224
429
48
321
573
296
176
225 234
216
474
62
0
100
200
300
400
500
600
CN IN KR TW ID TH MY SG HK PH
Export 2011 Export 2014
2,343
1,899
Source: HOLT, Credit Suisse estimates Source: CEIC, Credit Suisse research
(2) Regulatory intervention
The BI a few years ago was seen as having a bent of socialist, populist and nationalist
tendencies. For instance, Indonesia used to be the only country in Asia imposing a penalty
on banks with loan-deposit ratio below 78%. As Indonesia kept doing well through the past
decade and weathered the Global Financial Crisis, the confidence of authorities expanded
and led to regulation such as a 40% cap on ownership by a single shareholder even if that
happens to be a proper bank.
That BI had also announced a requirement of 20% of loans to be UMKM (or MSME –
micro, small and medium enterprises) starting from 2015 (5%) and to be complied with
fully by 2018 (20%). So far, the OJK, which has taken over bank regulation from BI, has
yet to announce the penalties for non-compliance. There is another regulation being
imposed that requires banks to maintain 70% of loans being towards productive purposes
– consumption or mortgage loans are not considered productive.
Figure 21: MSME to total loans, end-2014 Figure 22: Productive loans to total loans, end-2014
43.8
21.6
20.3
15.5
13.0
9.2 8.7 7.9
0.0
5.0
10.0
15.0
20.0
25.0
30.0
35.0
40.0
45.0
50.0
BBRI BTPN BBNI BMRI BBTN BDMN BBCA BJBR
UMKM (MSME) loan to total loan (%)
78.9 78.2
74.1 72.8 72.2
26.5
22.6 22.1
0.0
10.0
20.0
30.0
40.0
50.0
60.0
70.0
80.0
90.0
BMRI BBNI BBRI BBCA BDMN BJBR BTPN BBTN
Productive loan to total loan (%)
Source: Company data, Credit Suisse estimates Source: Company data, Credit Suisse estimates
The above two regulations play with the lending strategies of banks and veers them
towards areas that may not be their strength. More importantly, it has proven time and
again that such directed lending always leads to asset quality issues in future—India being
a prime example of this on agricultural lending. In Indonesia, the key question will be
UMKM loans to be 20% and
productive 70%
Directed lending always
ends in tears—just ask the
Indian banks
10 April 2015
Indonesia Banks Sector 10
whether the addressable market will be big enough for the MSME segment, especially
when infrastructure lending takes off and banks will need to find 20% of that as MSME
(one chunky infrastructure loan could be equal to thousands of smaller MSME loans).
The new initiative that banks are being involved in is financial inclusion. Indonesia has 152
mn bank accounts but far fewer individual account holders. Authorities believe some 120
mn Indonesians, four-fifths of the adult population, do not have a bank account. Their total
savings are estimated to be Rp200 tn = 5% of the current system deposits. As of now, we
hope banks will only be asked to facilitate opening of saving deposit accounts and not be
forced to lend to those customers. Except for BTPN, we believe most banks will treat this
as a cost initiative in the interests of national service. The four banks identified by the
government to kick start this are BRI, BCA, Mandiri and BTPN. Please note cost efficiency
of Indonesian banks at 48% is broadly in line with the Asian average but their cost/asset
ratio is the highest among Asian bank sectors, i.e. their cost/income appears in line
because their revenues are boosted by lofty net interest margins.
Figure 23: Asia banks—Cost-to-income ratio 2015E (%) Figure 24: Asia banks—Cost-to- asset ratio 2015E (%)
36
38
43 43 43 43
46 46
48 48 49
54
56 57
59
0
10
20
30
40
50
60
HK CN IN-P SG AU TW MY IN PK ID IN-G TH KR PH JP
0.8 0.8 0.8
1.0
1.1
1.2
1.4 1.4
1.7
1.9
2.4
2.5 2.5
2.8
3.7
0.0
0.5
1.0
1.5
2.0
2.5
3.0
3.5
4.0
HK TW JP SG AU CN MY KR IN-G IN IN-P PH PK TH ID
Note: Aggregated for CS coverage banks in each market; IN-P
denotes Indian private sector banks, IN-G government owned
Source: Company data, Credit Suisse estimates
Note: Aggregated for CS coverage banks in each market; IN-P
denotes Indian private sector banks, IN-G government owned
Source: Company data, Credit Suisse estimates
There are three product prices that are controlled by the government:
(1) Time deposits: From 1 October 2014, pricing is linked to the BI rate and banks are
allowed to pay 200-225 bp over that;
(2) Credit cards: It is capped at 3% per month and all of the banks under our coverage are
well within that (generally they are charging around 2% per month); and
(3) Subsidised mortgage: Aimed at promoting home ownership in the low-income
population, the rate is currently set at 7.25%. Government provides 70% financing as a
demand deposit and also underwrites the credit risk.
Under the previous government (which changed in 4Q14), some ministers had talked
about limiting the micro lending rate. The authorities had explained that some smaller
banks were lending at usurious rates of 40-50% to micro customers and the move was
aimed at curbing them. Therefore, it would not have affected the banks in our coverage
(where the average yield on micro is 20-28%) except for the new product of BTPN that it
calls "productive loan". It is an even smaller loan of Rp2-3 mn (US$200-300) aimed at
lower income segment and is largely unsecured. If the micro lending rate is capped at, say,
3% per month, BTPN might be able to scrape by on its productive loans, and capping it
lower would have the opposite effect of pushing such customers towards loan sharks who
are their only alternative.
Financial inclusion—national
service
Pricing caps—micro next?
10 April 2015
Indonesia Banks Sector 11
Banks are also apprehensive about a nationalist streak with foreign employees being
actively discouraged and their contracts not being renewed, including for senior positions
where local talent is not abundantly available. This is being felt particularly by the foreign
owned banks or even the private sector banks in general. In addition, the foreign owned
banks are still concerned about the 40% single shareholding limit being applied
retroactively.
OJK is acutely aware of the tail risk from having 118 bank licences and has a target to
reduce the number of licences to 80. It is asking the large banks to absorb a small bank in
order to improve the stability of the system. Hence, every bank has pencilled in an
acquisition this year without knowing how government would incentivise them to purchase
another bank, whether they could find a compatible bank with clean loan books and good
technology/systems, synergistic customers/branches.
After the directed lending, perhaps the biggest concern of banks from the regulatory angle
is lack of clarity on aspects such as Basel 3, and improper co-ordination within OJK. On
the lack of clarity, banks are still awaiting guidance on Common Equity Tier 1 requirement
that would allow them to declare a dividend policy. They complain that regulators still talk
about total capital ratio while the post-GFC world has moved on to CET1 and other loss
absorbing capital. As regards improper co-ordination, banks say that one part of OJK asks
them to carry more capital or report more NPLs while another part prompts them to set
more aggressive loan growth targets, etc.
There is no denying that globally the regulatory backdrop has become far more
burdensome following the Global Financial Crisis. However, the actions internationally are
aimed at ensuring no public support is to be needed in the next crisis, forcing banks to
prepare living wills, carry more capital, avoid gaming of risk weight models, etc. The
difference in Indonesia is that banks are already well capitalised but the interference with
their lending practices and the regulators pursuing various objectives (other than simply
ensuring a healthy financial system) always have unintended consequences.
(3) Tax receipts, govt spending and broader economy
Banks are concerned that government efforts to increase tax collections might end up
having the opposite effect—that of alarming some of the wealthy Indonesians into taking
some of their money overseas and/or frightening corporates into inaction, i.e. delaying
their decisions making on capital investment plans.
Figure 25: Indonesia—EBITDA growth of corporate sector (ex-financials) vs. nominal GDP
23%
21%
6%
14%
7%
-1%
10%
11%
25%
11%
14% 14%
10% 11% 11% 11%
-5%
0%
5%
10%
15%
20%
25%
30%
'08 '09 '10 '11 '12 '13 '14E '15E
ID EBITDA YoY growth ID nominal GDP YoY growth
Source: CEIC, Credit Suisse estimates
Nationalistic streak
Consolidation a lofty
objective, but how to ease
the cost?
Need clarity on Basel 3;
being pulled in different
directions
Globally, regulatory burden
rising but Indonesia is going
on the pre-GFC path
trodden by other countries
with not-so-happy
consequences
10 April 2015
Indonesia Banks Sector 12
It is rare in the annals of history for a country to be able to expand tax collections by 30%
in a year, and the chart below shows that Indonesia did achieve this remarkable feat in
2008. However, that was the year when fuel price hike had led to a spike in inflation and
the nominal GDP expanded a whopping 25% (real GDP still grew 6%). For 2015E, our
economists are forecasting nominal GDP of 11%, which may be at risk if the anticipated
government spending of second half does not come through. In that backdrop, it appears
very difficult for government to achieve its 30% growth target in tax collections, especially
when it keeps diluting its efforts of widening the tax base—it has dropped the requirement
for banks to disclose the names of large depositors and there is re-thinking on the luxury
tax, etc.
Figure 26: Indonesia—Nominal GDP growth versus tax revenue growth (%)
21 20
18
25
11
14 14
10 11 11 11
24
18
20
34
(6)
17
21
12
14
2
30
-10.0
-5.0
0.0
5.0
10.0
15.0
20.0
25.0
30.0
35.0
40.0
2005 2006 2007 2008 2009 2010 2011 2012 2013 2014 2015E
Nominal GDP growth (%) Govt tax revenue growth (%)
Source: Company data, Credit Suisse estimates
Of course, the projected government spending is based on projected tax revenue. We
understand the government has increased the infrastructure spending budget to Rp290 tn
in 2015, one-fifth of total budgetary revenue and 2.5% of GDP. If there is a shortfall in
government revenue, one possible casualty would be capital expenditure. However, our
economists believe that government will likely spend a majority of the budgeted amount
even if tax revenues fall short, which would mean higher fiscal deficit. The government's
current estimate of fiscal deficit is 1.9% which leaves some headroom to rise.
Figure 27: Government capital expenditure—planned versus actual (Rp tn)
43
63
73
102
72
82
136
152
184
230
281
33
55
64 73 76 80
118
145
181
198
-
50
100
150
200
250
300
2005 2006 2007 2008 2009 2010 2011 2012 2013 2014 2015
Budgeted Spent
?
Source: Credit Suisse economics team
Previous administration
used to miss its capex
targets. We expect the
current one to do far better
10 April 2015
Indonesia Banks Sector 13
Why is government spending so important? Because Indonesia is facing some of the
feeblest growth in a decade, with real GDP projected to slip below 5% level in 1H15 and
anticipated to recover in 2H on the back of government spending.
Figure 28: Projected real GDP growth—YoY and sequential QoQ SAAR (%)
5.1 5.0 4.9 5.0
5.3
5.1 5.2
5.0
2.0
5.8
4.9
7.0
3.2
4.9
5.2
6.3
0
1
2
3
4
5
6
7
8
1Q14 2Q14 3Q14 4Q14 1Q15E 2Q15E 3Q15E 4Q15E
YoY growth (%) Sequential QoQ SAAR (%)
Source: Credit Suisse economics team
Currently the indicators of domestic consumption as well as capex demand are shaping up
to be relatively sluggish.
Figure 29: Slowing 4W and 2W auto sales Figure 30: Slowing demand on cement
-60.0
-40.0
-20.0
0.0
20.0
40.0
60.0
80.0
100.0
Jan-10 Jan-11 Jan-12 Jan-13 Jan-14 Jan-15
4W monthly sales growth (YoY, %) 2W monthly sales growth (YoY, %)
-2.0
0.0
2.0
4.0
6.0
8.0
10.0
12.0
14.0
16.0
1Q10 3Q10 1Q11 3Q11 1Q12 3Q12 1Q13 3Q13 1Q14 3Q14 2M15
Quarterly Cement sales (YoY, %)
Source: GAIKINDO, Credit Suisse estimates Source: ASI, Credit Suisse estimates
We do believe that infrastructure lending will pick up, possibly with some lag, in 2016. It is
the key in attracting FDI in Indonesia and increasing the share of manufacturing.
On a sequential basis, CS
economists expect GDP to
bottom in 1Q15 and
accelerate in 2H on the back
of government spending
10 April 2015
Indonesia Banks Sector 14
Fortunes of large and smaller banks
to reverse
Looking at the 2015-16 forecasts, our observations are:
(1) Profit growth trajectory of large banks remains sluggish, pulled down by anticipated
NIM pressure, particularly in 2016, as BI cuts policy rates aggressively in 4Q15-1Q16. The
reverse will be true for second-tier banks, in our estimate, as they enjoy margin recovery
and should report very strong earnings rebound.
(2) The overall earnings growth for the eight banks in our coverage is likely to be in the
9-10% range for the next two to three years on account of margin compression in large
banks. This is a far cry from the 16% CAGR of earnings over the past decade, and would
imply that overall bank sector may not participate as much as we would like in the 2016E
economic rebound.
(3) Profitability (ROA) of the top four Indonesian banks is likely to decline in 2015 as credit
costs probably rise while margins feel some pressure, and further in 2016 when margins
compress even more.
These are shown pictorially below:
Figure 31: Net profit growth for top four banks, smaller four banks and aggregate eight banks
46
-38
36
13
25
30
40
32
20 19
14
8 9
88
-11
-26
51
-11
9
75
23 25
7
-26
24 20
52
-33
22 19 19
27
44
31
21 17
9 9 10
-60
-40
-20
0
20
40
60
80
100
2004 2005 2006 2007 2008 2009 2010 2011 2012 2013 2014 2015E 2016E
Top four banks (YoY, %) Smaller banks (YoY, %) Aggregate (YoY, %)
Figure 32: Return on asset for top four, smaller four and aggregate eight banks (%)
1.8 1.7
1.8
2.1
2.5
2.8 2.9
3.0 2.9
2.8 2.7
1.7
2.1
1.6 1.6
2.3 2.3 2.3
2.1
1.4
1.6
1.71.8 1.8 1.8
2.0
2.5
2.7 2.8 2.8
2.7 2.6 2.6
0.0
0.5
1.0
1.5
2.0
2.5
3.0
3.5
2006 2007 2008 2009 2010 2011 2012 2013 2014 2015E 2016E
ROA - Top four banks (%) ROA - Smaller banks (%) ROA - Overall 8 banks (%)
Source for both the charts above: Company data, Credit Suisse estimates
10 April 2015
Indonesia Banks Sector 15
Figure 33: Return on equity for top four, smaller four and aggregate eight banks (%)
18.3 17.9
20.5
23.6
26.1 26.1
24.9 24.5
23.2
21.3
20.0
16.2
20.9
16.5
14.3
18.3
17.5 17.7
16.3
10.9
12.4
13.5
18.0 18.4
19.9
22.0
24.6 24.5
23.5 23.0
21.2
19.9
19.0
0
5
10
15
20
25
30
2006 2007 2008 2009 2010 2011 2012 2013 2014 2015E 2016E
ROE - Top four banks (%) ROE - Smaller banks (%) ROE - Overall 8 banks (%)
Source: Company data, Credit Suisse estimates
Figure 34: Net interest margin for top four, smaller four and aggregate eight banks (%)
6.1 6.1
6.4 6.2
6.5
6.1 6.0
6.4 6.5 6.5 6.3
7.2
7.8
8.2
8.5
9.1
8.3 8.4 8.1
7.0 7.1 7.3
6.3 6.3
6.7 6.5
6.9
6.4 6.4 6.6 6.6 6.6 6.5
0
1
2
3
4
5
6
7
8
9
10
2006 2007 2008 2009 2010 2011 2012 2013 2014 2015E 2016E
NIM - Top four banks (%) NIM - Smaller banks (%) NIM - Overall 8 banks (%)
Source: Company data, Credit Suisse estimates
Figure 35: Credit cost for top four, smaller four and aggregate eight banks (bp of loans)
219
168
227 225
131
38
20
45
64
74 74
169
140
178
236
198
127
168 164
178
166 161
210
163
218
227
143
55
47
66
84 90 89
0
50
100
150
200
250
2006 2007 2008 2009 2010 2011 2012 2013 2014 2015E 2016E
Credit cost - Top four banks (%) Credit cost - Smaller banks (%) Credit cost - Overall 8 banks (%)
Source: Company data, Credit Suisse estimates
10 April 2015
Indonesia Banks Sector 16
Figure 36: Top four banks—ROA peaked in 2013. Margin
expansion of 2014 was offset by credit costs (%)
Figure 37: Top four banks—ROEs peaked in 2011 and are
expected to decline in 2015-16E (%)
1.4
1.8 1.7
1.8
2.1
2.5
2.8
2.9
3.0 2.9
2.8
2.7
0.0
0.5
1.0
1.5
2.0
2.5
3.0
3.5
2005 2006 2007 2008 2009 2010 2011 2012 2013 2014 2015E2016E
ROA - Top four banks (%)
14.7
18.3 17.9
20.5
23.6
26.1 26.1
24.9 24.5
23.2
21.3
19.9
0.0
5.0
10.0
15.0
20.0
25.0
30.0
35.0
2005 2006 2007 2008 2009 2010 2011 2012 2013 2014 2015E2016E
ROE - Top four banks (%)
Source: Credit Suisse estimates Source: Credit Suisse estimates
Figure 38: Top four banks—Dupont analysis (% of average assets)
(%) 2005 2006 2007 2008 2009 2010 2011 2012 2013 2014 2015E 2016E
Interest Income 9.44 10.68 8.99 8.95 9.40 8.91 8.38 7.84 8.11 8.83 8.76 8.61
Interest expense -4.22 -5.30 -3.76 -3.45 -3.86 -3.05 -2.82 -2.30 -2.24 -2.87 -2.88 -2.78
Net interest income 5.22 5.38 5.23 5.50 5.54 5.87 5.56 5.54 5.87 5.96 5.88 5.83
Other Operating Income 1.30 1.55 1.70 1.75 1.85 1.82 1.72 1.66 1.70 1.64 1.62 1.62
Fees & commissions 0.94 1.03 1.15 1.27 1.31 1.09 1.08 1.07 1.14 1.13 1.12 1.15
Foreign exchange gains 0.07 0.10 0.12 0.28 0.19 0.13 0.10 0.12 0.16 0.12 0.11 0.11
Trading income -0.05 0.19 0.17 -0.03 0.08 0.30 0.25 0.19 0.19 0.18 0.16 0.14
Others 0.34 0.22 0.26 0.23 0.27 0.30 0.29 0.28 0.22 0.21 0.23 0.23
Total Income 6.53 6.93 6.93 7.25 7.39 7.69 7.28 7.20 7.57 7.60 7.50 7.45
Operating Expense -3.63 -3.56 -3.63 -3.47 -3.43 -3.63 -3.58 -3.52 -3.54 -3.57 -3.55 -3.59
Pre-prov optg profit 2.90 3.36 3.30 3.78 3.96 4.06 3.70 3.68 4.03 4.03 3.95 3.86
Loan loss provisions -0.82 -1.00 -0.78 -1.17 -1.24 -0.73 -0.22 -0.12 -0.30 -0.42 -0.49 -0.52
Income from operations 2.08 2.36 2.52 2.61 2.72 3.33 3.48 3.56 3.74 3.61 3.45 3.34
Non-operating income 0.06 0.07 0.07 0.08 0.19 0.07 0.12 0.15 0.12 0.14 0.13 0.14
Extraordinary income 0.00 0.00 0.00 0.00 0.00 0.00 0.00 0.00 0.00 0.00 0.00 0.00
Income before tax 2.15 2.43 2.60 2.69 2.91 3.40 3.60 3.71 3.86 3.74 3.58 3.48
Tax -0.72 -0.66 -0.88 -0.84 -0.82 -0.88 -0.76 -0.79 -0.84 -0.78 -0.75 -0.73
Minority Interests 0.00 0.00 0.00 0.00 0.00 -0.01 -0.03 -0.03 -0.03 -0.03 -0.03 -0.03
Net profit = ROA 1.42 1.77 1.72 1.85 2.09 2.51 2.81 2.89 2.99 2.93 2.79 2.71
Gearing (x) 10.33 10.35 10.42 11.11 11.31 10.39 9.29 8.61 8.20 7.92 7.62 7.35
ROE 14.70 18.30 17.94 20.54 23.64 26.11 26.12 24.86 24.52 23.23 21.27 19.93
Ratios (%)
Loan growth 18.2 11.3 25.8 32.1 15.9 20.0 24.2 24.4 22.3 12.6 14.2 15.0
Net interest margin 5.86 6.14 6.06 6.39 6.16 6.45 6.08 6.00 6.36 6.53 6.46 6.32
Loan-dep ratio 57.1 56.3 58.6 67.1 66.5 69.0 73.5 79.7 86.4 84.8 87.6 88.6
Cost-income ratio 55.6 51.4 52.3 47.9 46.4 47.2 49.1 48.9 46.7 46.9 47.4 48.2
Non-int income / revenue 20.0 22.3 24.5 24.1 25.1 23.6 23.7 23.0 22.5 21.5 21.6 21.8
Credit cost (bp of loans) 187 219 168 227 225 131 38 20 45 64 74 76
Gross NPL ratio 12.8 9.0 5.5 3.4 3.0 2.5 2.1 1.7 1.5 1.7 1.9 2.0
Loan loss coverage 57 85 113 141 175 187 191 198 199 169 152 143
LLR to loan ratio 7.3 7.6 6.2 4.9 5.2 4.7 4.1 3.3 3.0 2.9 2.9 2.9
Tier-I CAR 14.5 16.5 15.2 12.6 11.9 12.3 13.2 14.2 14.4 15.8 15.7 15.9
Source: Credit Suisse estimates
10 April 2015
Indonesia Banks Sector 17
Figure 39: Smaller four banks—ROA peaked in 2012,
plummeted in 2014 on margins as well as credit costs
Figure 40: Smaller four banks—ROEs have been high
teens post-GFC but plunged to low-teens in 2014
2.6
1.7
2.1
1.6 1.6
2.3 2.3 2.3
2.1
1.4
1.6
1.7
0.0
0.5
1.0
1.5
2.0
2.5
3.0
3.5
2005 2006 2007 2008 2009 2010 2011 2012 2013 2014 2015E2016E
ROA - Smaller banks (%)
24.6
16.2
20.9
16.5
14.3
18.3
17.5 17.7
16.3
10.9
12.4
13.6
0.0
5.0
10.0
15.0
20.0
25.0
30.0
35.0
2005 2006 2007 2008 2009 2010 2011 2012 2013 2014 2015E2016E
ROE - Smaller banks (%)
Source: Credit Suisse estimates Source: Credit Suisse estimates
Figure 41: Smaller four banks—Dupont analysis (% of average assets)
(%) 2005 2006 2007 2008 2009 2010 2011 2012 2013 2014 2015E 2016E
Interest Income 12.70 14.03 13.23 13.68 14.26 13.24 12.77 12.08 11.81 12.13 12.06 11.89
Interest expense -5.60 -7.29 -5.88 -6.07 -6.48 -5.03 -5.23 -4.52 -4.50 -5.61 -5.40 -5.10
Net interest income 7.09 6.75 7.34 7.61 7.78 8.21 7.54 7.55 7.31 6.52 6.65 6.79
Other Operating Income 1.77 1.89 1.91 1.50 1.55 1.67 1.75 1.71 1.67 1.46 1.51 1.54
Fees & commissions 0.65 0.87 0.89 0.97 1.02 0.85 0.81 0.71 0.67 0.64 0.64 0.66
Foreign exchange gains 0.12 0.00 0.00 0.02 0.13 0.00 0.00 0.00 0.00 0.00 0.00 0.00
Trading income 0.00 0.02 0.02 0.00 0.00 0.12 -0.10 0.04 0.03 0.00 0.03 0.03
Others 0.99 1.00 1.00 0.51 0.39 0.70 1.04 0.96 0.97 0.81 0.84 0.85
Total Income 8.86 8.64 9.25 9.11 9.33 9.88 9.29 9.26 8.97 7.98 8.17 8.33
Operating Expense -4.98 -4.78 -4.99 -5.33 -5.33 -5.08 -5.12 -5.01 -4.93 -4.68 -4.79 -4.83
Pre-prov optg profit 3.89 3.86 4.27 3.78 3.99 4.80 4.17 4.25 4.04 3.30 3.38 3.50
Loan loss provisions 0.08 -0.95 -0.82 -1.14 -1.56 -1.34 -0.87 -1.16 -1.17 -1.31 -1.24 -1.21
Income from operations 3.97 2.91 3.45 2.64 2.43 3.46 3.30 3.09 2.87 1.99 2.14 2.30
Non-operating income -0.20 -0.31 -0.11 0.08 -0.09 -0.27 -0.20 0.02 0.01 -0.08 0.01 0.01
Extraordinary income 0.00 0.00 0.00 0.00 -0.01 0.00 0.00 0.00 0.00 0.00 0.00 0.00
Income before tax 3.77 2.61 3.34 2.73 2.33 3.19 3.09 3.11 2.88 1.91 2.15 2.31
Tax -1.04 -0.86 -1.09 -0.93 -0.73 -0.83 -0.77 -0.74 -0.72 -0.48 -0.54 -0.58
Minority Interests -0.11 -0.10 -0.10 -0.15 -0.04 -0.04 -0.04 -0.03 -0.03 -0.02 -0.02 -0.02
Net profit = ROA 2.62 1.65 2.15 1.64 1.56 2.32 2.28 2.34 2.13 1.41 1.60 1.71
Gearing (x) 9.39 9.83 9.73 10.09 9.15 7.87 7.65 7.57 7.63 7.69 7.77 7.92
ROE 24.64 16.24 20.89 16.54 14.28 18.27 17.47 17.73 16.28 10.87 12.40 13.56
Ratios (%)
Loan growth 20.4 18.8 23.9 30.2 10.9 29.0 23.9 22.7 20.5 9.9 11.9 13.3
Net interest margin 7.60 7.21 7.81 8.23 8.51 9.11 8.32 8.36 8.10 7.05 7.15 7.30
Loan-dep ratio 84.1 81.7 91.0 94.0 94.2 98.4 101.2 103.8 108.2 109.5 109.0 108.9
Cost-income ratio 56.1 55.3 53.9 58.5 57.2 51.5 55.2 54.1 55.0 58.6 58.6 57.9
Non-int income / revenue 20.0 21.9 20.7 16.5 16.6 16.9 18.8 18.4 18.6 18.2 18.5 18.5
Credit cost (bp of loans) -15 169 140 178 236 198 127 168 164 178 166 161
Gross NPL ratio 2.2 2.4 2.1 2.0 2.9 2.7 2.1 2.5 2.4 2.7 2.7 2.6
Loan loss coverage 126 120 119 107 88 94 85 63 63 66 70 77
LLR to loan ratio 2.8 2.9 2.5 2.1 2.6 2.5 1.8 1.6 1.5 1.8 1.9 2.0
Tier-I CAR 16.1 15.8 15.8 14.2 21.5 16.8 16.9 18.2 17.2 17.0 16.9 16.7
Source: Credit Suisse estimates
10 April 2015
Indonesia Banks Sector 18
Figure 42: Aggregate eight banks—ROA peaked in 2013
despite the margin expansion of 2014
Figure 43: Aggregate eight banks—ROEs peaked in 2010;
gearing is quite low at <8.0x
1.6
1.8 1.8 1.8
2.0
2.5
2.7 2.8 2.8
2.7
2.6 2.6
0.0
0.5
1.0
1.5
2.0
2.5
3.0
3.5
2005 2006 2007 2008 2009 2010 2011 2012 2013 2014 2015E2016E
ROA - Overall 8 banks (%)
16.2
18.0 18.4
19.9
22.0
24.6 24.5
23.5 23.0
21.2
19.9
19.0
0.0
5.0
10.0
15.0
20.0
25.0
30.0
35.0
2005 2006 2007 2008 2009 2010 2011 2012 2013 2014 2015E2016E
ROE - Overall 8 banks (%)
Source: Credit Suisse estimates Source: Credit Suisse estimates
Figure 44: Indonesia banks—Overall eight banks' Dupont analysis (% of assets)
(%) 2005 2006 2007 2008 2009 2010 2011 2012 2013 2014 2015E 2016E
Interest Income 9.90 11.19 9.63 9.66 10.13 9.57 9.08 8.54 8.73 9.37 9.28 9.13
Interest expense -4.41 -5.60 -4.08 -3.85 -4.25 -3.35 -3.21 -2.67 -2.62 -3.32 -3.28 -3.15
Net interest income 5.49 5.59 5.55 5.82 5.88 6.23 5.88 5.88 6.11 6.05 6.00 5.98
Other Operating Income 1.37 1.60 1.73 1.71 1.81 1.79 1.73 1.67 1.70 1.61 1.60 1.61
Fees & commissions 0.90 1.01 1.11 1.23 1.27 1.05 1.04 1.01 1.06 1.05 1.04 1.07
Foreign exchange gains 0.07 0.09 0.10 0.24 0.19 0.11 0.08 0.10 0.13 0.10 0.09 0.09
Trading income -0.04 0.17 0.15 -0.03 0.07 0.27 0.20 0.17 0.16 0.15 0.14 0.12
Others 0.43 0.34 0.37 0.27 0.28 0.36 0.41 0.39 0.34 0.31 0.32 0.33
Total Income 6.86 7.18 7.28 7.53 7.68 8.02 7.60 7.54 7.81 7.66 7.60 7.59
Operating Expense -3.82 -3.75 -3.83 -3.75 -3.72 -3.85 -3.83 -3.77 -3.77 -3.75 -3.75 -3.79
Pre-prov optg profit 3.04 3.44 3.45 3.78 3.96 4.17 3.78 3.77 4.04 3.91 3.86 3.80
Loan loss provisions -0.69 -0.99 -0.79 -1.16 -1.29 -0.82 -0.32 -0.29 -0.44 -0.57 -0.61 -0.63
Income from operations 2.35 2.45 2.66 2.62 2.67 3.35 3.45 3.48 3.59 3.34 3.25 3.17
Non-operating income 0.03 0.01 0.05 0.08 0.15 0.02 0.07 0.13 0.10 0.10 0.11 0.12
Extraordinary income 0.00 0.00 0.00 0.00 0.00 0.00 0.00 0.00 0.00 0.00 0.00 0.00
Income before tax 2.38 2.46 2.71 2.69 2.82 3.37 3.52 3.61 3.69 3.45 3.35 3.29
Tax -0.77 -0.69 -0.91 -0.85 -0.81 -0.87 -0.76 -0.78 -0.82 -0.73 -0.72 -0.71
Minority Interests -0.02 -0.02 -0.02 -0.02 -0.01 -0.02 -0.03 -0.03 -0.03 -0.03 -0.03 -0.03
Net profit = ROA 1.59 1.75 1.79 1.82 2.01 2.48 2.73 2.80 2.85 2.69 2.60 2.55
Gearing (x) 10.19 10.27 10.31 10.94 10.92 9.91 8.98 8.41 8.10 7.88 7.64 7.43
ROE 16.23 17.98 18.42 19.88 21.96 24.61 24.49 23.54 23.04 21.17 19.89 18.99
Ratios (%)
Loan growth 18.6 12.6 25.5 31.7 15.0 21.5 24.1 24.1 22.0 12.1 13.8 14.7
Net interest margin 6.12 6.31 6.34 6.69 6.52 6.86 6.43 6.38 6.65 6.62 6.57 6.48
Loan-dep ratio 60.5 59.8 62.7 70.8 70.1 73.0 77.4 83.2 89.6 88.3 90.6 91.5
Cost-income ratio 55.7 52.1 52.6 49.8 48.4 48.0 50.3 50.0 48.3 48.9 49.3 49.9
Non-int income / revenue 20.0 22.3 23.8 22.7 23.5 22.4 22.7 22.1 21.7 21.0 21.1 21.2
Credit cost (bp of loans) 152 210 163 218 227 143 55 47 66 84 90 91
Gross NPL ratio 10.9 7.8 4.9 3.2 3.0 2.6 2.1 1.8 1.7 1.9 2.0 2.1
Loan loss coverage 60 87 113 138 160 169 171 164 164 143 133 130
LLR to loan ratio 6.5 6.8 5.5 4.4 4.7 4.3 3.6 3.0 2.8 2.7 2.7 2.8
Tier-I CAR 14.8 16.3 15.3 12.8 13.3 13.1 13.8 14.8 14.8 16.0 15.9 16.0
Source: Credit Suisse estimates
10 April 2015
Indonesia Banks Sector 19
Prefer smaller banks, top pick BTPN
As the detailed disclosures have become available following the 2014 full year results, we
revise our earnings forecasts. Our forecasts go up by 2-5% as slightly softer loan growth is
more than offset by higher net interest margins and lower credit losses. The changes in
2016 are larger than that for 2015. The upward revisions are driven by banks setting
ambitious targets for margins (especially the large four banks) and following the first rate
cut in February, seem to be demonstrating greater ability to manage NIMs. As regards
asset quality, banks are still guiding for flat credit losses in 2015E (we keep credit costs
broadly stable for 2016E).
Figure 45: Revision in earnings forecasts
Revised Old Change (%)
(Rp bn, %) 2015E 2016E 2015E 2016E 2015E 2016E
Net int inc 197 220 194 213 1.5 3.5
Non-int inc 53 59 54 62 -2.1 -5.0
Revenue 250 279 248 275 0.7 1.5
Optg exp -123 -139 -118 -132 4.1 5.4
Pre-prov profit 127 140 130 143 -2.3 -2.0
Provisions -20 -23 -25 -31 -18.1 -26.1
PBT 110 122 108 116 1.6 4.7
Net profit 85 94 84 90 2.1 5.1
Growth in
Revenue 12.2 11.8 10.9 10.9 1.2 0.9
Optg exp 13.0 13.1 12.4 11.7 0.6 1.4
Pre-prov profit 11.4 10.4 9.6 10.1 1.7 0.3
Provisions 22 13 25 25 -3.5 -12.1
Net profit 9.4 10.3 7.0 7.1 2.4 3.2
Loan growth 13.8 14.7 15.2 15.3 -1.4 -0.6
Deposit growth 10.9 13.6 14.1 14.4 -3.3 -0.8
Net int margin 6.57 6.48 6.48 6.26 0.09 0.21
NPL ratio 2.0 2.1 2.1 2.2 -0.1 -0.1
Credit cost (bp) 90 89 108 117 -18 -28
LLR coverage 133 128 156 167 -22.7 -38.3
LLR to loans 2.7 2.7 3.3 3.6 -0.6 -0.9
ROA 2.60 2.56 2.61 2.47 -0.01 0.10
ROE 19.9 19.0 19.4 18.1 0.5 0.9
Source: Credit Suisse estimates
The table below shows that we remain conservative vis-à-vis consensus (Bloomberg) on
the four large banks and BDMN and BTPN among the smaller banks.
Figure 46: Net profit forecast—CS versus consensus (Bloomberg)
CS CS Consensus Consensus CS to cons. CS to cons. CS CS Consensus Consensus
2015E 2016E 2015E 2016E (%) 2015E (%) 2016E YoY'15E YoY'16E YoY'15E YoY'16E
BMRI 21,849 24,406 22,632 25,863 96.5 94.4 10.0 11.7 13.9 14.3
BBCA 18,051 18,920 18,856 21,489 95.7 88.0 9.2 4.8 14.3 14.0
BBRI 25,976 28,733 27,001 30,821 96.2 93.2 7.2 10.6 11.6 14.1
BBNI 11,332 12,307 12,021 13,633 94.3 90.3 5.1 8.6 11.5 13.4
BDMN 3,263 3,965 3,531 4,294 92.4 92.3 25.3 21.5 35.6 21.6
BTPN 2,247 2,622 2,305 2,719 97.5 96.4 21.3 16.7 24.4 17.9
BBTN 1,508 1,865 1,446 1,773 104.3 105.2 35.2 23.7 29.6 22.7
BJBR 1,270 1,511 1,251 1,469 101.6 102.9 13.0 19.0 12.0 17.5
Source: the BLOOMBERG PROFESSIONAL™ service, Credit Suisse estimates
10 April 2015
Indonesia Banks Sector 20
Loan demand sluggish, expected to pick up in 2H15
Last year, all the banks were targeting 15-17% loan growth (in line with OJK guidance) but
ended up with 12%. This year, all the banks are targeting 14-16% but the loan demand
has been weak so far in 1Q15. We expect loan growth of 13.8% in 2015 on second half
economic rebound and to 14.7% in 2016E as infrastructure investment starts.
Figure 47: Loan growth trends
(%) 2009 2010 2011 2012 2013 2014 5Y CAGR 2015E 2016E 2017E
BMRI 13.4 21.4 28.3 23.6 21.6 12.5 21.4 14.5 15.5 15.6
BBCA 9.0 25.0 31.5 27.4 20.5 11.7 23.0 12.8 13.4 13.5
BBRI 28.9 19.9 17.0 23.8 23.2 14.4 19.6 15.0 15.4 15.5
BBNI 8.4 12.4 21.4 23.0 24.3 10.6 18.2 13.8 15.2 15.2
BDMN -5.0 29.3 23.1 14.5 16.9 4.7 17.4 8.0 10.3 11.8
BTPN 50.8 48.5 30.1 28.5 18.7 13.1 27.2 12.2 12.9 12.8
BBTN 26.9 25.0 23.3 28.1 23.4 15.4 23.0 15.4 15.9 16.1
BJBR 19.5 20.6 21.8 33.7 26.9 10.4 22.4 14.2 15.9 16.6
Aggregate 15.0 21.5 24.1 24.1 22.0 12.1 20.7 13.8 14.7 14.9
Bkg system 10.1 23.3 24.7 23.1 21.4 11.6 20.7
Source: Company data, Credit Suisse estimates
Loans for consumption as well as for investment have decelerated.
Figure 48: Loan growth by type of loans (YoY, %) Figure 49: Deposit growth by type of deposits (YoY, %)
0.0
5.0
10.0
15.0
20.0
25.0
30.0
35.0
40.0
45.0
50.0
Jan-05 Jan-06 Jan-07 Jan-08 Jan-09 Jan-10 Jan-11 Jan-12 Jan-13 Jan-14 Jan-15
Investment Working capital Consumption Total loans
-10.0
0.0
10.0
20.0
30.0
40.0
Jan-05 Jan-06 Jan-07 Jan-08 Jan-09 Jan-10 Jan-11 Jan-12 Jan-13 Jan-14 Jan-15
Demand Saving Time Total deposits
Source: CEIC, Credit Suisse estimates Source: CEIC, Credit Suisse estimates
Liquidity has improved lately as loan demand remains soft while real rates are high.
Figure 50: Deposit growth trends
(%) 2009 2010 2011 2012 2013 2014 5Y CAGR 2015E 2016E 2017E
BMRI 10.5 13.4 16.6 14.4 15.2 14.4 14.8 14.2 14.3 15.0
BBCA 17.0 13.2 16.5 14.5 10.6 9.4 12.8 11.0 12.7 12.9
BBRI 27.0 30.4 15.2 17.2 12.0 23.4 19.4 5.2 13.0 14.6
BBNI 15.5 3.1 19.0 11.4 13.3 7.5 10.7 13.6 14.9 14.7
BDMN -9.1 18.5 8.0 4.6 21.4 6.7 11.6 7.9 10.0 11.0
BTPN 62.7 37.9 39.5 26.5 15.8 2.2 23.6 11.9 12.2 12.2
BBTN 27.9 18.2 30.3 30.2 19.2 10.7 21.5 16.6 16.7 16.8
BJBR 29.3 34.7 22.2 29.6 -1.2 15.5 19.5 14.6 15.2 15.3
Aggregate 16.1 16.7 17.1 15.4 13.3 13.8 15.2 10.9 13.6 14.3
Bkg system 13.8 20.4 18.7 15.6 13.0 12.2 16.0
Source: Company data, Credit Suisse estimates
Loan growth missed targets
in 2014, likely to miss in
2015 again
Deposit inflows better on
high real rates
10 April 2015
Indonesia Banks Sector 21
Is it possible that the recent currency volatility has again led to some local wealth leaking
overseas? Hard to say although we note that foreign exchange reserves have fallen to
US$111 bn in March from US$115 bn in February.
Figure 51: Loans show greater correlation with nominal GDP while deposits closely track money supply
Indonesia: Growth in nominal GDP, loans, deposits and broad money supply (%)
18.3
25.3
11.0
14.2 14.1
10.0 10.6 10.7
27.5
30.8
10.1
23.3
24.7
23.1
21.4
11.6
19.0
15.0
13.8
20.4
18.7
15.6
13.1
12.2
19.4
14.9
13.0
15.4
16.4
15.0
12.8
11.9
0.0
5.0
10.0
15.0
20.0
25.0
30.0
35.0
2007 2008 2009 2010 2011 2012 2013 2014
Nominal GDP (YoY, %) System loan (YoY, %) System deposit (YoY, %) M2 money supply (YoY, %)
Source: CEIC, Bank Indonesia, Credit Suisse estimates
As a result of improving liquidity situation, loan-deposit ratio has come down to 88.3% as
of 4Q14 from the peak of 94.7% in 1Q14. Please note the government has announced it
will allow banks to issue long-term bonds to fund infrastructure lending although the
regulators have yet to issue norms for loan-financing ratio (it will include deposits and
some other types of financing in the denominator).
Figure 52: Loan-deposit ratio
(%) 2009 2010 2011 2012 2013 2014 2015E 2016E 2017E
BMRI 64.5 69.1 76.0 82.2 86.7 85.3 85.5 86.4 86.9
BBCA 52.6 58.1 65.6 73.0 79.5 81.3 82.6 83.2 83.7
BBRI 82.4 75.8 77.0 81.4 89.6 83.1 90.9 92.8 93.5
BBNI 66.6 72.6 74.1 81.8 89.8 92.4 92.5 92.8 93.2
BDMN 95.7 104.5 119.1 130.4 125.6 123.2 123.4 123.7 124.6
BTPN 84.9 91.5 85.3 86.7 88.8 98.3 98.6 99.2 99.8
BBTN 102.6 108.4 102.6 100.9 104.4 108.9 107.8 107.1 106.4
BJBR 82.8 74.1 73.9 76.2 97.9 93.6 93.3 93.9 94.9
Aggregate 70.1 73.0 77.4 83.2 89.6 88.3 90.6 91.5 92.0
Source: Company data, Credit Suisse estimates
Net interest margins—divergence on the opposite
side now, to continue further in 2015-16E
Following the BI directive of mid-2013 restricting loan-deposit ratios to 92% combined with
the 175 bp rate hikes of May-Sep'13 caused a panic in 4Q13 among banks in their
scramble to raise deposits and time-deposit rates went into double digit. In that sense, the
new administration is dismantling the 2013 BI initiative (when OJK was still a part of BI) of
restricting the LDR of banks to 92%.
10 April 2015
Indonesia Banks Sector 22
Figure 53: Banking system lending rates by loan type (%) Figure 54: Banking system deposit cost by type of
deposits (%)
10.0
11.0
12.0
13.0
14.0
15.0
16.0
17.0
18.0
19.0
20.0
Jan-03 Jan-05 Jan-07 Jan-09 Jan-11 Jan-13 Jan-15
Invt loans WC loans Cons loans Average
0.00
2.00
4.00
6.00
8.00
10.00
12.00
14.00
Jan-03 Jan-05 Jan-07 Jan-09 Jan-11 Jan-13 Jan-15
Current Savings Time Average
Source: CEIC, Credit Suisse estimates Source: CEIC, Credit Suisse estimates
The higher rate environment boosted margins of large four banks while crushing the
margins of smaller four banks in our sample. The OJK action of capping time deposit rates
to 200-225 bp over BI policy rate (200 bp for the large four banks, 225 bp for next 15
banks) from 1st
October 2014 and weakening loan demand helped calm the panic on
deposit pricing and brought relief to the margins of smaller banks in late 4Q14.
Figure 55: Net interest margin trends
(%) 2009 2010 2011 2012 2013 2Q13 3Q13 4Q13 1Q14 2Q14 3Q14 4Q14 2014 2015E 2016E 2017E
BMRI 5.12 5.16 4.80 5.11 5.22 5.03 5.20 5.63 5.31 5.26 5.20 5.51 5.30 5.28 5.15 5.03
BBCA 6.27 4.54 5.05 5.37 5.95 5.80 6.04 6.27 6.43 6.39 6.45 6.54 6.46 6.40 6.20 5.98
BBRI 8.98 9.99 8.54 7.63 7.90 7.57 7.95 8.74 8.21 8.25 7.86 7.36 7.79 7.63 7.54 7.46
BBNI 5.73 5.32 5.15 5.13 5.65 5.73 5.76 5.80 5.81 5.85 5.76 6.06 5.86 5.79 5.66 5.52
Large 4 6.16 6.45 6.08 6.00 6.36 6.38 6.38 6.38 6.38 6.38 6.38 6.38 6.53 6.46 6.32 6.18
BDMN 11.17 10.61 9.30 9.50 9.00 9.10 8.77 8.14 7.86 7.61 7.67 7.63 7.91 7.97 8.16 8.31
BTPN 12.14 13.53 12.08 12.23 11.57 11.87 11.92 11.02 10.70 10.98 10.05 10.46 10.49 10.74 10.97 11.05
BBTN 4.86 5.91 5.79 5.86 5.49 5.39 5.68 5.42 4.95 4.12 4.22 4.66 4.49 4.61 4.74 4.85
BJBR 7.77 7.16 6.43 6.02 7.04 7.40 6.67 6.98 6.09 5.54 6.13 6.44 6.12 6.33 6.46 6.59
Smaller 4 8.51 9.11 8.32 8.36 8.10 7.03 7.03 7.03 7.03 7.03 7.03 7.03 7.05 7.15 7.30 7.40
Aggregate 6.52 6.86 6.43 6.38 6.65 6.39 6.55 6.84 6.59 6.51 6.41 6.48 6.62 6.57 6.48 6.38
Source: Company data, Credit Suisse estimates
Figure 56: Change in net interest margin from 2Q13 to 2H14 (%)
0.7 0.7
0.5 0.4
0.3
0.1
-0.7
-0.9 -1.0
-1.2
-1.4
-2.0
-1.5
-1.0
-0.5
0.0
0.5
1.0
BBCA BBRI BMRI Large 4 BBNI Aggr BBTN BTPN BJBR Small 4 BDMN
Source: Company data, Credit Suisse estimates
Margins of large banks were
boosted by higher policy
rate while those of smaller
banks were crushed
10 April 2015
Indonesia Banks Sector 23
The reason for the divergence in margin performance since the May-Sep'13 rate hikes
was the low-cost current-and-saving (CASA) deposit franchise of large versus the smaller
banks. Despite the fact that current and saving deposits did not grow much in 2014 for the
banking system (6% each for current and saving deposits, 20% for time deposits), the
larger banks still benefited as they were able to keep CASA rates unchanged at around
2.00% while the time deposit rates took the entire brunt by rising around 350 bp, i.e.
double of the 175 bp policy rate hikes of May-Sep'13. Please note current deposits are
21% of system deposits, saving 31% and time-deposits are 48% of system.
Figure 57: CASA deposits cost 2% vs ~9% for time …
ID banks – proportion of CASA deposits (%)
Figure 58: … leading to a substantial advantage
ID banks – Average cost of deposits 2014 (%)
2
20 18 22
14
20 20
38
20
26 24
13
26 30
31
40
40 40
23
43
41
51
15
46 48
53
54
60 60 60
63
67
75
0
10
20
30
40
50
60
70
80
Current account Saving account 8.9
6.7 6.5 6.5
6.1
4.1 4.0
3.6 3.5 3.3
2.6
0.0
1.0
2.0
3.0
4.0
5.0
6.0
7.0
8.0
9.0
10.0
Source: Company data, Credit Suisse estimates Source: Company data, Credit Suisse estimates
Figure 59: Deposit breakdown and growth
2014 (Rp bn) 2014 YoY (%) 5Y CAGR (%)
Saving Current Time Total Saving Current Time Total Saving Current Time Total
BMRI 252,445 128,067 255,870 636,382 6.7 3.7 30.3 14.4 17.3 12.0 14.0 14.8
BBCA 228,993 107,419 111,494 447,906 4.2 4.1 28.8 9.4 12.3 15.8 11.3 12.8
BBRI 249,434 89,430 283,458 622,322 11.3 13.7 40.6 23.4 19.0 12.3 22.8 19.4
BBNI 128,598 82,743 102,552 313,893 10.2 (6.2) 17.8 7.5 16.9 12.9 3.9 10.7
Large 4 859,470 407,660 753,373 2,020,503 7.8 3.6 31.8 14.7 16.2 13.2 14.4 14.9
BDMN 34,625 21,437 60,434 116,495 9.5 9.7 4.2 6.7 17.6 25.6 6.1 11.6
BTPN 6,917 21,437 60,434 88,788 7.0 60.4 0.7 2.2 32.4 61.9 22.1 23.6
BBTN 32,748 23,231 50,499 106,479 12.8 22.9 4.6 10.7 29.6 25.8 16.1 21.5
BJBR 13,004 21,898 22,840 57,741 6.5 30.8 8.5 15.5 27.9 21.5 14.4 19.5
Smaller 4 87,294 88,003 194,206 369,503 10.0 21.1 3.9 8.6 24.0 24.5 13.0 17.4
Aggregate 946,764 495,663 947,580 2,390,006 8.0 5.8 25.3 13.8 16.8 14.4 14.1 15.2
Bkg system 1,235,855 844,934 1,925,423 4,006,212 6.1 6.2 19.9 12.2 16.2 15.7 15.9 16.0
Source: Company data, Credit Suisse estimates
Our economists are forecasting BI to cut policy rate by 50 bp in Nov-Dec 2015 and
another 50 bp in 1Q16, i.e. a total of 125 bp in this cycle (there was a 25 bp rate cut on 17
February 2015) vis-à-vis the 200 bp rate hikes during 2013-14. If this comes true, the
narrowing of gap between interest rate paid on CASA (around 2.0%) and time-deposits
(around 9.0% as of now) combined with the cap on time-deposit rate (to 200-225 bp over
BI rate) should lead to a more balanced growth in deposits in 2015-16, in our view.
10 April 2015
Indonesia Banks Sector 24
(around 9.0% as of now) combined with the cap on time-deposit rate (to 200-225 bp over
BI rate) should lead to a more balanced growth in deposits in 2015-16, in our view.
Figure 60: CPI and policy rate—Historical and projected
until 1Q16E (%)
Figure 61: Indonesia—Real policy rates using CPI and
GDP deflator (%)
0.0
2.0
4.0
6.0
8.0
10.0
12.0
14.0
16.0
18.0
20.0
1Q04 1Q06 1Q08 1Q10 1Q12 1Q14 1Q16
CPI (YoY, %) Policy rate (YoY, %)
-20.0
-15.0
-10.0
-5.0
0.0
5.0
10.0
15.0
Mar-01 Mar-03 Mar-05 Mar-07 Mar-09 Mar-11 Mar-13 Mar-15
Real policy rate using CPI Real policy rate using GDP deflator
Source: CEIC, Credit Suisse economics team Source: Credit Suisse estimates
The full impact of the projected 100 bp rate cuts in 4Q15-1Q16E on margins of banks will
be felt in 2016 and large banks will suffer while the smaller banks will enjoy further
recovery.
Figure 62: If BI cuts 100 bp by 1Q16E, then smaller banks would enjoy a margin rebound (large banks opposite)
Net interest margin of each bank, 2014 and 2016E (%)
Source: Company data, Credit Suisse estimates
The dynamics of movement in asset yields versus cost of funding are tabulated below.
10 April 2015
Indonesia Banks Sector 25
Figure 63: Yield on interest earning assets (CS estimate)
(%) 2009 2010 2011 2012 2013 2Q13 3Q13 4Q13 1Q14 2Q14 3Q14 4Q14 2014 2015E 2016E 2017E
BMRI 9.3 8.7 8.0 7.6 7.8 7.4 7.7 8.4 8.2 8.4 8.6 8.8 8.5 8.5 8.2 7.9
BBCA 9.3 7.2 7.4 7.3 7.7 7.4 7.9 8.3 8.7 8.7 8.9 9.0 8.8 8.7 8.4 8.1
BBRI 13.3 13.6 11.9 10.4 10.6 10.2 10.7 11.8 11.3 11.7 11.8 11.3 11.4 11.3 11.0 10.8
BBNI 9.7 8.5 8.1 7.5 7.8 7.8 8.0 8.2 8.3 8.7 8.9 9.1 8.7 8.8 8.5 8.2
Large 4 10.4 9.8 9.2 8.5 8.8 8.3 8.6 9.3 9.2 9.5 9.6 9.6 9.7 9.6 9.3 9.0
BDMN 16.5 14.7 13.7 13.2 12.7 13.1 12.9 12.6 12.7 12.8 12.8 12.6 12.7 12.5 12.4 12.2
BTPN 22.3 21.4 19.5 18.7 18.0 18.0 18.2 18.0 18.5 18.9 18.3 18.0 18.3 18.0 17.8 17.6
BBTN 12.1 11.8 11.9 11.3 10.9 10.6 10.8 11.3 11.2 10.7 10.8 11.1 11.0 10.9 10.8 10.6
BJBR 14.2 13.3 12.6 11.2 12.0 12.2 11.7 12.4 12.0 11.8 11.6 12.2 12.1 12.0 11.8 11.6
Smaller 4 15.6 14.7 14.1 13.4 13.1 13.1 12.9 13.0 13.0 13.0 12.9 12.9 13.1 13.0 12.8 12.6
Aggregate 11.2 10.5 9.9 9.3 9.5 9.1 9.3 9.9 9.8 10.0 10.2 10.2 10.2 10.2 9.9 9.6
Source: Company data, Credit Suisse estimates
Figure 64: Cost of funding (CS estimate)
(%) 2009 2010 2011 2012 2013 2Q13 3Q13 4Q13 1Q14 2Q14 3Q14 4Q14 2014 2015E 2016E 2017E
BMRI 4.6 3.9 3.6 2.9 2.9 2.7 2.8 3.1 3.3 3.6 3.8 3.7 3.6 3.6 3.4 3.2
BBCA 3.4 2.9 2.5 2.1 2.0 1.8 2.1 2.2 2.5 2.7 2.8 2.7 2.6 2.6 2.5 2.4
BBRI 5.1 4.0 3.9 3.2 3.2 3.1 3.2 3.5 3.6 4.0 4.6 4.5 4.1 4.2 4.0 3.8
BBNI 4.5 3.6 3.4 2.8 2.5 2.4 2.5 2.7 2.8 3.3 3.7 3.5 3.3 3.4 3.2 3.0
Large 4 4.5 3.6 3.4 2.8 2.7 2.6 2.7 3.0 3.1 3.4 3.8 3.7 3.5 3.5 3.3 3.2
BDMN 7.2 5.3 5.7 4.9 5.0 5.0 5.0 5.4 5.8 6.3 6.1 6.0 6.1 5.7 5.3 4.9
BTPN 10.5 8.6 8.3 7.2 7.2 6.9 7.0 7.9 8.8 9.1 9.4 8.7 8.9 8.3 7.8 7.4
BBTN 7.9 6.2 6.1 5.1 5.2 5.0 5.2 5.8 6.1 6.6 6.7 6.5 6.5 6.3 6.0 5.7
BJBR 7.0 6.7 6.7 5.5 5.2 5.1 5.3 5.8 6.4 6.7 5.9 6.2 6.5 6.1 5.8 5.4
Smaller 4 7.6 6.2 6.3 5.4 5.5 5.3 5.4 5.9 6.5 6.9 6.7 6.6 6.7 6.3 5.9 5.5
Aggregate 5.0 4.0 3.9 3.2 3.2 3.0 3.2 3.5 3.7 4.0 4.3 4.2 4.0 4.0 3.7 3.5
Source: Company data, Credit Suisse estimates
Non-interest income: Slower lately
Pre-GFC, non-interest income used to grow faster than net interest income.
Figure 65: Indonesia banks (CS 8 banks): Net interest income and non-interest income growth
12.8
15.8
22.3
16.2
23.6
12.6
18.0
19.7
13.8
12.1 11.5
29.4
26.1
15.4
21.3
15.9
14.7
13.8
17.1
9.0
12.5 12.6
0.0
5.0
10.0
15.0
20.0
25.0
30.0
35.0
2006 2007 2008 2009 2010 2011 2012 2013 2014 2015E 2016E
Net interest income (YoY, %) Non interest income (YoY,%)
Source: Company data, Credit Suisse estimates (aggregated for CS coverage universe)
10 April 2015
Indonesia Banks Sector 26
Post-GFC, the momentum in non-interest income has waned (9% in 2014) hence their
contribution to revenue has fallen (peaked in 2007 at 23.8%). For 2015-16E, we expect a
similar low-to-mid-teens growth in non-interest income and a stable proportion.
Figure 66: Non-interest income to revenue ratio Figure 67: Non-interest income to average asset ratio
22.3
23.8
22.7
23.5
22.4
22.7
22.1
21.7
21.0 21.1
21.2
19.5
20.0
20.5
21.0
21.5
22.0
22.5
23.0
23.5
24.0
2006 2007 2008 2009 2010 2011 2012 2013 2014 2015E 2016E
Non-interest income to revenue (%)
1.6
1.7
1.7
1.8
1.8
1.7
1.7
1.7
1.6 1.6 1.6
1.5
1.5
1.6
1.6
1.7
1.7
1.8
1.8
1.9
2006 2007 2008 2009 2010 2011 2012 2013 2014 2015E 2016E
Non-interest income to avg asset (%)
Source: Company data, Credit Suisse estimates Source: Company data, Credit Suisse estimates
Not only deposit franchise, the smaller banks are inferior on non-interest income as well.
Figure 68: Non-interest income snapshot
(Rp bn, %) BMRI BBCA BBRI BBNI Large 4 BDMN BTPN BBTN BJBR Smaller 4 Aggr.
Total non int inc 15,142 9,006 7,211 8,480 39,840 4,763 764 926 439 6,892 46,732
2014 YoY 7.2 13.5 12.6 16.1 11.4 -15.6 90.7 16.0 63.5 -3.1 9.0
5Y CAGR 18.0 11.6 10.4 11.9 13.6 19.7 15.1 16.2 3.5 17.1 14.1
% of revenue 27.9 21.9 12.3 27.5 21.5 25.5 9.8 14.5 9.0 18.2 21
% of avg assets 1.9 1.7 1.0 2.1 1.6 2.5 1.1 0.7 0.6 1.5 1.6
Source: Company data, Credit Suisse estimates
Operating expenses: Relatively inelastic?
The 10Y CAGR of operating costs of Indonesian banks (aggregated for CS eight banks) is
15.9% vis-à-vis 15.4% for revenue, and the chart below shows that revenue has been a bit
more variable than costs. Banks have been investing in new branches, ATMs, EDC
machines, technology, etc. Combined with the mid-teen salary increases which are
commonplace (not least due to similar or higher jumps in minimum salaries), the operating
costs have been rising at that pace as well. For 2015-16E, we anticipate banks will try to
rein in costs to some extent leading to around 13% increase annually.
10 April 2015
Indonesia Banks Sector 27
Figure 69: Indonesia banks (CS 8 banks): Revenue and operating expenses growth
16.1
18.1
20.7
17.4
21.8
13.1
17.0
19.2
12.7
12.2 11.8
8.7
19.2
14.2 14.1
20.9
18.5
16.2
15.3
14.1
13.0 13.1
0.0
5.0
10.0
15.0
20.0
25.0
2006 2007 2008 2009 2010 2011 2012 2013 2014 2015E 2016E
Revenue (YoY, %) Operating expenses (YoY,%)
Source: Company data, Credit Suisse estimates (aggregated for eight banks in CS coverage)
The cost-income ratio of Indonesian banks does not appear as out of place (net interest
margins lift the revenue base) in the Asian context but the cost/asset ratio is the highest. A
large part of the reason is low penetration of loans as well as deposits, leading to the costs
being spread over a smaller base. Put another way, the Indonesian banks should be able
to run a far bigger loan book with the current cost base.
Figure 70: Aggregated cost to income ratio (%) Figure 71: Operating expense to average asset ratio (%)
52.1
52.6
49.8
48.4
48.0
50.3
50.0
48.3
48.9
49.3
49.9
45.0
46.0
47.0
48.0
49.0
50.0
51.0
52.0
53.0
2006 2007 2008 2009 2010 2011 2012 2013 2014 2015E 2016E
Cost to income ratio
3.7
3.8
3.7
3.7
3.9
3.8
3.8
3.8
3.7 3.7
3.8
3.7
3.7
3.8
3.8
3.9
3.9
2006 2007 2008 2009 2010 2011 2012 2013 2014 2015E 2016E
Opex to avg asset (%)
Source: Company data, Credit Suisse estimates Source: Company data, Credit Suisse estimates
Figure 72: Operating expense snapshot
(Rp bn, %) BMRI BBCA BBRI BBNI Large 4 BDMN BTPN BBTN BJBR Smaller 4 Aggregate
Total opex 25,667 18,305 26,705 16,103 86,780 10,625 4,501 4,072 2,946 22,144 108,924
2014 YoY 12.7 25.2 19.1 10.5 16.6 2.0 13.1 5.8 4.7 5.2 14.1
5Y CAGR 19.4 16.7 17.4 15.0 17.3 11.8 21.9 18.0 18.8 15.5 17.0
% of revenue 47.3 44.6 45.5 52.2 46.9 56.9 57.7 63.6 60.1 58.6 48.9
% of avg. assets 3.2 3.5 3.7 4.0 3.6 5.6 6.2 3.0 4.0 4.7 3.7
Source: Company data, Credit Suisse estimates
10 April 2015
Indonesia Banks Sector 28
Asset quality—divergence here as well, surprisingly
Although NPLs did not rise much even in 2014, credit costs did increase towards being
closer to through-a-cycle average from extremely low levels of 2011-13. The smaller four
banks were particularly hit last year and we hope that incrementally things will not
deteriorate further in 2015-16E. In general, we do not expect big jump in NPL ratio but
modest increases over the next couple of years.
Figure 73: NPL ratio trends
(%) 2009 2010 2011 1Q12 2Q12 2012 1Q13 2Q13 2013 1Q14 2Q14 2014 2015E 2016E 2017E
BMRI 3.1 2.5 2.2 2.2 2.0 1.9 2.1 1.9 1.9 2.1 2.3 2.2 2.4 2.6 2.4
BBCA 0.7 0.7 0.6 0.7 0.6 0.4 0.5 0.5 0.5 0.5 0.6 0.8 1.0 1.0 1.0
BBRI 3.5 2.9 2.5 2.9 2.5 1.9 2.1 1.9 1.6 1.9 2.1 1.9 2.1 2.2 2.1
BBNI 4.8 4.3 3.7 3.6 3.4 2.8 2.8 2.6 2.2 2.3 2.2 2.0 2.1 2.2 2.1
BDMN 4.3 3.2 2.7 2.8 2.8 2.7 2.8 2.6 2.0 2.0 2.2 2.4 2.6 2.6 2.5
BTPN 0.5 1.1 0.7 0.7 0.7 0.6 0.7 0.6 0.7 0.7 0.8 0.6 0.8 0.9 1.0
BBTN 3.3 3.3 2.8 3.2 3.5 4.1 4.8 4.6 4.0 4.7 5.1 4.0 3.7 3.5 3.1
BJBR 2.0 2.1 1.6 1.1 2.1 2.3 2.3 2.5 3.1 4.1 4.2 4.4 3.9 3.7 3.4
Aggregate 3.0 2.6 2.1 2.2 2.0 1.8 2.0 1.8 1.7 1.9 2.0 1.9 2.0 2.1 2.0
Bkg system 3.8 2.9 2.6 2.8 2.5 2.2 2.3 2.2 1.9 2.1 2.2 2.2
Source: Company data, Credit Suisse estimates
Figure 74: Special mention ratio trends
(%) 2009 2010 2011 1Q12 2Q12 2012 1Q13 2Q13 2013 1Q14 2Q14 2014
BMRI 9.1 6.7 4.0 3.6 3.4 3.7 3.8 3.8 3.6 3.9 4.3 4.2
BBCA 1.4 1.5 1.3 1.5 1.5 1.4 1.7 1.4 1.5 1.9 1.9 1.6
BBRI 5.2 5.1 6.7 6.8 6.4 5.4 6.3 5.8 5.2 7.5 6.9 7.1
BBNI 7.4 5.3 4.3 5.0 3.9 3.1 4.2 3.1 2.6 3.1 3.1 2.4
BDMN 7.3 8.8 7.3 7.3 6.9 6.1 6.2 5.8 4.3 5.0 5.1 4.9
BTPN 1.3 2.0 1.3 1.7 1.6 1.6 2.3 1.9 1.8 2.3 2.2 1.6
BBTN 12.2 12.9 12.2 14.3 13.5 11.9 13.2 13.2 12.0 14.0 14.6 13.8
BJBR 0.9 1.3 2.4 3.3 3.4 3.3 4.4 4.3 4.4 4.6 4.8 4.2
Aggregate 6.3 5.5 4.8 5.0 4.6 4.2 4.8 4.4 4.0 4.9 4.9 4.7
Source: Company data, Credit Suisse estimates
Figure 75: Restructured loan ratio trends
(%) 2009 2010 2011 1Q12 2Q12 2012 1Q13 2Q13 2013 1Q14 2Q14 2014
BMRI 0.1 0.2 0.1 0.1 0.2 0.1 0.1 0.0 0.0 0.0 0.0 0.1
BBCA 0.3 0.3 0.2 0.5 0.5 0.4 0.4 0.4 0.4 0.3 0.3 0.3
BBRI 2.7 3.1 2.7 2.6 2.7 2.1 2.2 1.9 1.6 1.4 1.4 3.1
BBNI 9.5 5.6 4.6 4.5 4.0 3.5 3.2 2.7 2.6 2.7 2.2 2.1
BDMN 2.3 2.7 1.5 1.5 1.5 1.4 1.5 1.5 1.5 1.4 1.5 2.0
BTPN 0.0 0.0 1.3 1.3 1.2 1.3 1.4 1.4 1.8 2.0 2.1 2.3
BBTN 0.3 0.3 0.5 0.5 0.5 0.6 0.7 1.0 1.1 0.9 1.0 1.2
BJBR 0.4 0.3 0.3 0.3 0.3 0.5 0.4 0.4 0.3 0.3 0.3 0.3
Aggregate 2.4 2.0 1.5 1.5 1.5 1.3 1.3 1.1 1.0 1.0 0.9 1.4
Source: Company data, Credit Suisse estimates
10 April 2015
Indonesia Banks Sector 29
Figure 76: NPL + Special mention + Restructured loan ratio trends
(%) 2009 2010 2011 1Q12 2Q12 2012 1Q13 2Q13 2013 1Q14 2Q14 2014
BMRI 12.2 9.3 6.2 5.6 5.2 5.6 6.0 5.7 5.5 6.0 6.4 6.3
BBCA 2.4 2.5 2.1 2.8 2.7 2.3 2.5 2.4 2.5 2.8 2.8 2.9
BBRI 11.4 11.2 11.8 12.2 11.6 9.3 10.5 9.5 8.4 10.8 10.3 12.0
BBNI 21.4 15.0 12.3 12.8 11.0 9.2 10.0 8.2 7.1 7.9 7.3 6.3
BDMN 13.1 14.5 11.2 11.1 10.7 9.6 9.9 9.3 7.4 8.0 8.4 8.8
BTPN 1.8 3.1 3.4 3.7 3.5 3.5 4.3 4.0 4.3 5.0 5.2 4.5
BBTN 15.9 16.5 15.5 18.0 17.5 16.6 18.7 18.8 17.2 19.6 20.8 19.0
BJBR 3.3 3.7 4.4 4.8 5.7 6.1 7.1 7.2 7.8 9.0 9.3 8.9
Aggregate 11.7 10.0 8.5 8.7 8.1 7.3 8.0 7.4 6.7 7.8 7.9 8.0
Source: Company data, Credit Suisse estimates
We have included the first quarter and second quarter data in the tables above because
there seems to be some seasonality in the first half of the year when NPLs spike, and then
banks work them down in the second half (not to forget that there is a fair bit of write-offs
in the fourth quarter so as to bring down the NPL ratio).
Why do we expect modest-but-continued increase in NPLs? Due to the structurally slower
economy and strains in corporate cash flows (for which we use EBITDA as proxy). The
high real interest rates do not suggest there is any let up on the corporate sector. Please
note corporate loans account for three-quarter of bank loans hence their cash flow is
critical in repayment of the loans, i.e. in banks' asset quality.
Credit cost—differences to narrow
Credit costs fell sharply since 2011 when Indonesian banks changed their accounting
method by separating out the NPL-related recoveries and taking them to non-interest
income instead of deducting from new loan loss provisions in P&L (the only bank who is
still use the old accounting method are Danamon). Hence, the P&L provision line in the
P&L of banks now shows the gross provisions rather than net of recoveries. This
accounting policy is different from the one used by most other banking sectors in Asia. We
have adjusted for this and our figures below are based on the old method.
Figure 77: Credit cost trends (bp of loans)
(bp) 2004 2005 2006 2007 2008 Pre-GFC
avg
2009 2010 2011 2012 2013 2014 2015E 2016E 2017E
BMRI 3 318 297 130 159 187 103 50 -13 23 36 51 67 70 77
BBCA 61 73 97 28 170 65 182 22 -9 21 68 65 66 60 55
BBRI 234 57 219 187 203 174 310 276 136 13 49 75 89 89 89
BBNI 396 200 195 337 422 282 336 136 15 27 24 65 72 72 72
Large 4 140 187 219 168 227 178 225 131 38 20 45 64 74 74 75
BDMN -147 -62 254 209 299 64 439 289 198 286 263 284 274 266 259
BTPN 37 165 308 267 50 194 24 189 164 131 138 155 151 160 160
BBTN -181 1 41 -1 2 -35 17 71 10 30 50 73 60 60 64
BJBR 17 74 6 41 88 35 93 165 100 120 141 129 130 125 125
Smaller 4 -90 -15 169 140 178 51 236 198 127 168 164 178 166 161 158
Aggregate 100 152 210 163 218 156 227 143 55 47 66 84 90 89 89
Source: Company data, Credit Suisse estimates
10 April 2015
Indonesia Banks Sector 30
Figure 78: Loan loss coverage of NPLs (%)
(%) 2004 2005 2006 2007 2008 2009 2010 2011 2012 2013 2014 2015E 2016E 2017E
BMRI 129 44 75 109 127 201 217 193 212 205 175 152 136 145
BBCA 209 146 217 252 409 481 352 314 315 308 220 202 212 215
BBRI 196 153 155 178 177 157 185 221 218 211 164 144 134 138
BBNI 118 51 56 72 103 120 122 121 126 131 132 130 128 138
Large 4 144 57 85 113 141 175 187 191 198 199 169 152 142 150
BDMN 288 148 144 154 119 98 113 97 95 110 106 104 108 111
BTPN 137 86 137 269 467 336 128 141 171 158 154 130 125 109
BBTN 146 96 74 54 54 51 52 54 29 28 34 38 40 46
BJBR 259 332 317 238 239 113 120 119 78 73 72 81 90 101
Smaller 4 224 126 120 119 107 88 94 85 63 63 66 70 74 80
Aggregate 150 60 87 113 138 160 169 171 164 164 143 133 128 135
Source: Company data, Credit Suisse estimates
Figure 79: LLR to Loan ratio (%)
(%) 2004 2005 2006 2007 2008 2009 2010 2011 2012 2013 2014 2015E 2016E 2017E
BMRI 8.7 10.4 11.7 9.0 6.5 6.0 5.2 4.2 3.9 3.8 3.6 3.6 3.4 3.4
BBCA 2.6 2.4 2.7 2.0 2.3 3.3 2.6 1.9 1.5 1.8 2.0 2.2 2.3 2.4
BBRI 8.0 7.0 7.3 6.0 4.9 5.4 5.5 5.4 4.0 3.4 3.1 3.0 2.9 2.8
BBNI 5.2 6.5 5.5 5.9 4.8 5.4 4.9 4.1 3.3 2.6 2.3 2.5 2.6 2.6
Large 4 6.8 7.3 7.6 6.2 4.9 5.2 4.7 4.1 3.3 3.0 2.9 2.9 2.9 2.9
BDMN 5.4 2.7 3.2 2.7 2.3 3.4 3.3 2.2 2.0 1.7 2.0 2.1 2.1 2.1
BTPN 3.3 3.0 3.3 3.5 2.8 1.7 1.5 1.0 1.0 1.0 1.0 1.0 1.1 1.0
BBTN 4.9 3.9 3.0 2.1 1.7 1.7 1.7 1.5 1.2 1.1 1.4 1.4 1.4 1.4
BJBR 1.1 1.5 1.3 1.7 1.9 2.2 2.6 1.9 1.8 2.2 3.1 3.1 3.3 3.4
Smaller 4 4.5 2.8 2.9 2.5 2.1 2.6 2.5 1.8 1.6 1.5 1.8 1.9 1.9 2.0
Aggregate 6.4 6.5 6.8 5.5 4.4 4.7 4.3 3.6 3.0 2.8 2.7 2.7 2.7 2.7
Source: Company data, Credit Suisse estimates
Revision in target prices
Following the changes in earnings forecasts, we take this opportunity to roll forward the
target price calculation to end-2015 which leads to higher target prices.
Figure 80: Target price calculation
ROA ROE Target Target Target Current Old TP New Old
2015E 2016E 2015E 2016E Normalized COE P/B P/E Price Price Upside Rating Rating
BMRI 2.40 2.37 19.8 19.1 20.3 13.0 2.8 13.9 13,700 12,075 13.5 11,800 O O
BBCA 3.08 2.88 21.2 18.8 25.3 13.0 4.1 16.1 13,600 15,025 -9.5 11,500 U U
BBRI 3.14 3.16 24.3 22.6 26.8 14.5 3.2 12.1 14,000 13,100 6.9 11,500 N N
BBNI 2.56 2.45 18.8 18.5 21.3 14.0 2.5 11.5 7,550 7,225 4.5 6,000 N N
BDMN 1.61 1.79 9.6 10.8 16.0 14.0 1.4 8.8 4,100 5,050 -18.8 3,050 U U
BTPN 2.81 2.89 17.6 17.7 22.8 14.5 2.5 11.0 5,050 4,095 23.3 3,950 O U
BBTN 0.97 1.04 11.9 13.3 13.3 13.5 1.0 7.2 1,100 1,185 -7.2 950 N N
BJBR 1.57 1.64 16.9 18.1 17.5 14.5 1.5 8.3 1,150 965 19.2 800 O N
Source: Company data, Credit Suisse estimates
Prefer smaller banks, BTPN top pick
Based on the upside, we upgrade BTPN to OUTPERFORM from Underperform and BJBR
to OUTPERFORM from Neutral and make BTPN our top pick. Among the large four,
Mandiri is our only OUTPERFORM-rated stock and remains our preferred pick.
10 April 2015
Indonesia Banks Sector 31
Valuations are fair
Despite the turn in fortunes since 17 February when BI trimmed the policy rate by 25 bp to
7.50%, the larger banks still seem to be outperforming the smaller banks (which follows a
significant outperformance last year). We believe this is partly due to large bank stocks
more liquid (and automatically benefit from inflows into ETFs) in addition to their superior
franchises in deposits and fee income.
Figure 81: Price performance, 2014 (%) Figure 82: Price performance since 17 February (%)
60.7
54.4
38.5 37.3 36.7
19.9
-8.1
-18.0
-30.0
-20.0
-10.0
0.0
10.0
20.0
30.0
40.0
50.0
60.0
70.0
BBRI BBNI BBTN BMRI BBCA BDMN BTPN BJBR
24.7
13.1
10.7
7.2 7.1
2.8 2.8
-13.3
-20.0
-15.0
-10.0
-5.0
0.0
5.0
10.0
15.0
20.0
25.0
30.0
BJBR BBNI BMRI BBCA BBRI BTPN BDMN BBTN
Source: the BLOOMBERG PROFESSIONAL™ service, Credit Suisse Source: the BLOOMBERG PROFESSIONAL™ service, Credit Suisse
To a large extent, the top four banks have been doing well in profit terms over the years
which justifies the investor interest in them.
Figure 83: Large banks' profits are five-fold of pre-GFC…
ID banks – Net profit 2014 vs. 2007 (x)
Figure 84: … and their stock prices have trebled
ID banks - 5Y cumulative price performance (%)
4.6
3.7
5.0
5.6
1.2
5.3
2.8
3.0
4.1
0.0
1.0
2.0
3.0
4.0
5.0
6.0
BMRI BBCA BBRI BBNI BDMN BTPN BBTN BJBR Aggr
143
166
216
228
0
193
135
92
0
50
100
150
200
250
BMRI BBCA BBRI BBNI BDMN BTPN JK Fin JKSE
5Y
Note: For BNI, 2006 profit used as the denominator
Source: Company data, Credit Suisse estimates
Source: Thomson Reuters, Credit Suisse estimates
All the above has led to valuations being generally in line with their historical averages.
10 April 2015
Indonesia Banks Sector 32
Figure 85: ID banks: P/B (x) versus ROE (%) Figure 86: ID banks: Price/Assets (%) vs. ROA (%)
BRI
BCA
Mandiri
BNI
BJBR
BTPN
BBTN
ID
0.0
0.5
1.0
1.5
2.0
2.5
3.0
3.5
4.0
4.5
10.0 12.0 14.0 16.0 18.0 20.0 22.0 24.0 26.0
ROE '15E
P/B 2015E
BRI
BCA
Mandiri
Danamon BNI
BJBR
BTPN
BBTN
ID
5
15
25
35
45
55
65
0.80 1.30 1.80 2.30 2.80 3.30
Mcap / Assets 2015E (%)
ROA '15E
Source: Company data, Credit Suisse estimates Source: Company data, Credit Suisse estimates
10 April 2015
Indonesia Banks Sector 33
Companies Mentioned (Price as of 10-Apr-2015)
PT Bank Central Asia Tbk (BBCA.JK, Rp15,075, UNDERPERFORM, TP Rp13,600)
PT Bank Danamon Indonesia Tbk (BDMN.JK, Rp5,075, UNDERPERFORM, TP Rp4,100)
PT Bank Mandiri (Persero) Tbk (BMRI.JK, Rp12,000, OUTPERFORM, TP Rp13,700)
PT Bank Negara Indonesia (Persero) Tbk (BBNI.JK, Rp7,175, NEUTRAL, TP Rp7,550)
PT Bank Pembangunan Daerah Jawa Barat dan Banten T (BJBR.JK, Rp885, OUTPERFORM, TP Rp1,150)
PT Bank Rakyat Indonesia (Persero) Tbk (BBRI.JK, Rp13,075, NEUTRAL, TP Rp14,000)
PT Bank Tabungan Negara Persero Tbk (BBTN.JK, Rp1,175, NEUTRAL[V], TP Rp1,100)
PT Bank Tabungan Pensiunan Nasional Tbk (BTPN.JK, Rp4,095, OUTPERFORM, TP Rp5,050)
Disclosure Appendix
Important Global Disclosures
I, Sanjay Jain, certify that (1) the views expressed in this report accurately reflect my personal views about all of the subject companies and
securities and (2) no part of my compensation was, is or will be directly or indirectly related to the specific recommendations or views expressed in
this report.
3-Year Price and Rating History for PT Bank Central Asia Tbk (BBCA.JK)
BBCA.JK Closing Price Target Price
Date (Rp) (Rp) Rating
30-Jul-12 7,950 10,000 O
06-Aug-12 7,700 R
09-Aug-12 8,000 10,000 O
29-Oct-12 8,100 11,000
28-Mar-13 11,400 11,000 N
16-Sep-13 10,050 10,000
30-Oct-13 10,700 10,600
10-Feb-14 10,050 *
10-Mar-14 10,500 11,800 N
15-Apr-14 11,100 11,700
14-Oct-14 12,625 11,600 U
17-Nov-14 12,900 11,500
* Asterisk signifies initiation or assumption of coverage.
O UT PERFO RM
REST RICT ED
N EUT RAL
UN D ERPERFO RM
3-Year Price and Rating History for PT Bank Danamon Indonesia Tbk (BDMN.JK)
BDMN.JK Closing Price Target Price
Date (Rp) (Rp) Rating
08-Jul-12 6,100 R
16-Sep-13 4,100 3,600 U
19-Nov-13 3,850 3,000
10-Feb-14 4,470 *
10-Mar-14 4,175 3,500 U
15-Apr-14 4,550 3,700
14-Oct-14 3,900 3,400
17-Nov-14 4,215 3,050
* Asterisk signifies initiation or assumption of coverage.
REST RICT ED
UN D ERPERFO RM
10 April 2015
Indonesia Banks Sector 34
3-Year Price and Rating History for PT Bank Mandiri (Persero) Tbk (BMRI.JK)
BMRI.JK Closing Price Target Price
Date (Rp) (Rp) Rating
25-Apr-12 7,000 8,800 O
30-Jul-12 7,850 9,500
29-Oct-12 8,200 11,000
25-Feb-13 9,750 12,150
29-Apr-13 10,600 12,750
16-Sep-13 8,950 9,800
30-Oct-13 8,750 10,500
10-Feb-14 8,750 *
11-Feb-14 8,950 10,500 O
10-Mar-14 9,200 11,700
15-Apr-14 9,750 11,400
14-Oct-14 9,450 11,100
17-Nov-14 10,475 11,800
* Asterisk signifies initiation or assumption of coverage.
O UT PERFO RM
3-Year Price and Rating History for PT Bank Negara Indonesia (Persero) Tbk (BBNI.JK)
BBNI.JK Closing Price Target Price
Date (Rp) (Rp) Rating
29-May-12 3,675 4,500 O
31-Jul-12 3,975 4,700
23-Oct-12 3,900 5,000
01-Mar-13 4,850 5,790
29-Apr-13 5,300 6,300
16-Sep-13 4,400 4,275 N
21-Oct-13 4,650 4,700
10-Feb-14 4,280 *
10-Mar-14 4,840 5,100 N
15-Apr-14 4,995 5,000
14-Oct-14 5,275 5,550
17-Nov-14 5,825 6,000
* Asterisk signifies initiation or assumption of coverage.
O UT PERFO RM
N EUT RAL
3-Year Price and Rating History for PT Bank Pembangunan Daerah Jawa Barat dan Banten T (BJBR.JK)
BJBR.JK Closing Price Target Price
Date (Rp) (Rp) Rating
30-Jul-12 940 1,200 O
25-Oct-12 1,120 1,420
26-Mar-13 1,280 1,350 N
16-Sep-13 920 975
10-Feb-14 935 *
31-Mar-14 1,045 1,050 N
15-Apr-14 1,140 1,100
14-Oct-14 745 800
* Asterisk signifies initiation or assumption of coverage.
O UT PERFO RM
N EUT RAL
10 April 2015
Indonesia Banks Sector 35
3-Year Price and Rating History for PT Bank Rakyat Indonesia (Persero) Tbk (BBRI.JK)
BBRI.JK Closing Price Target Price
Date (Rp) (Rp) Rating
14-Aug-12 7,100 8,700 O
31-Oct-12 7,400 9,100
01-Feb-13 8,000 9,000 N
16-Sep-13 8,200 10,000 O
24-Oct-13 8,350 10,250
10-Feb-14 8,700 *
17-Feb-14 8,950 10,250 O
10-Mar-14 9,075 11,900
15-Apr-14 9,850 11,500
14-Oct-14 10,100 11,100 N
17-Nov-14 11,075 11,500
* Asterisk signifies initiation or assumption of coverage.
O UT PERFO RM
N EUT RAL
3-Year Price and Rating History for PT Bank Tabungan Negara Persero Tbk (BBTN.JK)
BBTN.JK Closing Price Target Price
Date (Rp) (Rp) Rating
25-Apr-12 1,332 1,246 N
04-Oct-12 1,342 R
13-Dec-12 1,580 1,300 N
14-Dec-12 1,580 1,600
28-Feb-13 1,630 1,700
16-Sep-13 1,010 900 U
29-Oct-13 950 880
10-Mar-14 1,165 1,200 N *
03-Jul-14 1,050 1,100
14-Oct-14 1,100 1,050
17-Nov-14 1,115 950
* Asterisk signifies initiation or assumption of coverage.
N EUT RAL
REST RICT ED
UN D ERPERFO RM
3-Year Price and Rating History for PT Bank Tabungan Pensiunan Nasional Tbk (BTPN.JK)
BTPN.JK Closing Price Target Price
Date (Rp) (Rp) Rating
25-Apr-12 3,550 4,000 N
19-Jul-12 4,200 4,700
22-Oct-12 5,100 5,800
20-Feb-13 4,900 6,000 O
16-Sep-13 4,050 4,350 N
10-Feb-14 4,500 *
10-Mar-14 4,310 3,800 U
14-Oct-14 4,400 3,850
17-Nov-14 4,150 3,950
* Asterisk signifies initiation or assumption of coverage. N EUT RAL
O UT PERFO RM
UN D ERPERFO RM
The analyst(s) responsible for preparing this research report received Compensation that is based upon various factors including Credit Suisse's
total revenues, a portion of which are generated by Credit Suisse's investment banking activities
As of December 10, 2012 Analysts’ stock rating are defined as follows:
Outperform (O) : The stock’s total return is expected to outperform the relevant benchmark*over the next 12 months.
Neutral (N) : The stock’s total return is expected to be in line with the relevant benchmark* over the next 12 months.
Underperform (U) : The stock’s total return is expected to underperform the relevant benchmark* over the next 12 months.
10 April 2015
Indonesia Banks Sector 36
*Relevant benchmark by region: As of 10th December 2012, Japanese ratings are based on a stock’s total return relative to the analyst's coverage universe which
consists of all companies covered by the analyst within the relevant sector, with Outperforms representing the most attractive, Neutrals the less attrac tive, and
Underperforms the least attractive investment opportunities. As of 2nd October 2012, U.S. and Canadian as well as Europea n ratings are based on a stock’s total
return relative to the analyst's coverage universe which consists of all companies covered by the analyst within the relevant sector, with Outperforms representing the
most attractive, Neutrals the less attractive, and Underperforms the least attractive investment opportunities. For Latin American and non-Japan Asia stocks, ratings
are based on a stock’s total return relative to the average total return of the relevant country or regional benchmark; prior to 2nd October 2012 U.S. and Canadian
ratings were based on (1) a stock’s absolute total return potential to its current share price and (2) the relative attractiveness of a stock’s total return potential within
an analyst’s coverage universe. For Australian and New Zealand stocks, 12-month rolling yield is incorporated in the absolute total return calculation and a 15% and
a 7.5% threshold replace the 10-15% level in the Outperform and Underperform stock rating definitions, respectively. The 15% and 7.5% thresholds replace the +10-
15% and -10-15% levels in the Neutral stock rating definition, respectively. Prior to 10th December 2012, Japanese ratings were based on a stock’s total return
relative to the average total return of the relevant country or regional benchmark.
Restricted (R) : In certain circumstances, Credit Suisse policy and/or applicable law and regulations preclude certain types of communications,
including an investment recommendation, during the course of Credit Suisse's engagement in an investment banking transaction and in certain other
circumstances.
Volatility Indicator [V] : A stock is defined as volatile if the stock price has moved up or down by 20% or more in a month in at least 8 of the past 24
months or the analyst expects significant volatility going forward.
Analysts’ sector weightings are distinct from analysts’ stock ratings and are based on the analyst’s expectations for the fundamentals and/or
valuation of the sector* relative to the group’s historic fundamentals and/or valuation:
Overweight : The analyst’s expectation for the sector’s fundamentals and/or valuation is favorable over the next 12 months.
Market Weight : The analyst’s expectation for the sector’s fundamentals and/or valuation is neutral over the next 12 months.
Underweight : The analyst’s expectation for the sector’s fundamentals and/or valuation is cautious over the next 12 months.
*An analyst’s coverage sector consists of all companies covered by the analyst within the relevant sector. An analyst may cov er multiple sectors.
Credit Suisse's distribution of stock ratings (and banking clients) is:
Global Ratings Distribution
Rating Versus universe (%) Of which banking clients (%)
Outperform/Buy* 44% (53% banking clients)
Neutral/Hold* 38% (51% banking clients)
Underperform/Sell* 16% (43% banking clients)
Restricted 3%
*For purposes of the NYSE and NASD ratings distribution disclosure requirements, our stock ratings of Outperform, Neutral, an d Underperform most closely
correspond to Buy, Hold, and Sell, respectively; however, the meanings are not the same, as our stock ratings are determined on a relative basis. (Please refer to
definitions above.) An investor's decision to buy or sell a security should be based on investment objectives, current holdin gs, and other individual factors.
Credit Suisse’s policy is to update research reports as it deems appropriate, based on developments with the subject company, the sector or the
market that may have a material impact on the research views or opinions stated herein.
Credit Suisse's policy is only to publish investment research that is impartial, independent, clear, fair and not misleading. For more detail please refer
to Credit Suisse's Policies for Managing Conflicts of Interest in connection with Investment Research: http://www.csfb.com/research-and-
analytics/disclaimer/managing_conflicts_disclaimer.html
Credit Suisse does not provide any tax advice. Any statement herein regarding any US federal tax is not intended or written to be used, and cannot
be used, by any taxpayer for the purposes of avoiding any penalties.
Price Target: (12 months) for PT Bank Central Asia Tbk (BBCA.JK)
Method: Our target price for BBCA of Rp13,600/share is derived based on Gordon's growth assuming sustainable return on equity (ROE) of 18-
21%, beta of 0.8-0.9x, risk free rate of 8.5% and market risk premium of 5.0%. Our target price for BBCA implies 3.8x 2015E P/B and
18.8x 2015E P/E.
Risk: Risks to our estimates and target price of Rp13,600/share for BBCA include: (1) longer-than-anticipated tight liquidity conditions in
Indonesia as well as a faster-than-expected recovery of the currently tight liquidity conditions; (2) significant changes in global sentiment;
(3) significant changes in the public's confidence in the bank; (4) risks relating to Indonesia, including macroeconomic, political and social
risks; (5) risks of major changes in the bank's current management team; and (6) currency risks.
Price Target: (12 months) for PT Bank Negara Indonesia (Persero) Tbk (BBNI.JK)
Method: Our target price of Rp7,550/share for BBNI is derived based on Gordon's growth model, assuming normalized return of equity (ROE) of
18-19%, beta of 1.0x, risk-free rate of 8.5% and market risk premium of 5.0%, implying 2.5x 2015E price-to-book ratio (P/B) and 11.5x
2014E price-to-earnings ratio (P/E).
10 April 2015
Indonesia Banks Sector 37
Risk: Risks to our estimates and target price of Rp7,550/share for BBNI include: (1) longer-than-anticipated tight liquidity conditions in Indonesia
as well as faster-than-expected recovery of the currently tight liquidity conditions; (2) significant changes in global sentiment; (3) significant
changes in the public's confidence in the bank; (4) risks relating to Indonesia, including macroeconomic, political and social risks; (5) risks
of major changes in the bank's current management team; and (6) currency risks.
Price Target: (12 months) for PT Bank Rakyat Indonesia (Persero) Tbk (BBRI.JK)
Method: Our target price of Rp14,000/share for BBRI is derived based on Gordon's growth model, assuming normalized return of equity (ROE) of
22-24%, beta of 1.1-1.2x, risk-free rate of 8.5% and market risk premium of 5.0%, implying a 3.1x 2014E price-to-book ratio (P/B) and
14.3x 2014E price-to-earnings ratio (P/E).
Risk: Risks to our estimates and target price of Rp14,000/share for BBRI include: (1) longer-than-anticipated tight liquidity conditions in
Indonesia as well as faster-than-expected recovery of the currently tight liquidity conditions; (2) significant changes in global sentiment; (3)
significant changes in the public's confidence in the bank; (4) risks relating to Indonesia, including macroeconomic, political and social
risks; (5) risks of major changes in the bank's current management team; and (6) currency risks.
Price Target: (12 months) for PT Bank Tabungan Negara Persero Tbk (BBTN.JK)
Method: Our target price of Rp1,100/share for BBTN is derived based on Gordon's growth model, a normalised return of equity (ROE) of 12.0-
13.0%, beta of 1.1-1.2x, a risk-free rate of 8.5% and market risk premium of 5.0%, implying 1.0x 2015E price-to-book ratio (P/B) and 7.2x
2015E price-to-earnings ratio (P/E).
Risk: Risks to our estimates and target price of Rp1,100/share for BBTN include: (1) an earlier-than-expected pick-up in competition for funding;
(2) irrational competition from new entrants to the mortgage sector; and (3) Indonesia's sovereign and political risks.
Price Target: (12 months) for PT Bank Danamon Indonesia Tbk (BDMN.JK)
Method: Our target price of Rp4,100/share for BDMN is derived based on Gordon's growth model, assuming a sustainable return of equity (ROE)
of 10-11, beta of 1.1-1.2x, risk-free rate of 8.5% and market risk premium of 5.0%, implying 1.4x 2015E price-to-book ratio (P/B) and 8.8x
2015E price-to-earnings ratio (P/E).
Risk: Risks to our estimates and target price of Rp4,100/share for Bank Danamon include: (1) challanges in tight liquidity conditions to sustain
longer than our initial expectation; (2) significant changes in global sentiment; (3) unexpected deterioration in public's confidence in
Indonesian banks; (4) risks relating to Indonesia including macroeconomics, geopolitics and social risks; (5) risks relating to changes in
the management team; (6) currency risks; and (7) lower-than-expected expansion on micro segments.
Price Target: (12 months) for PT Bank Pembangunan Daerah Jawa Barat dan Banten T (BJBR.JK)
Method: Our target price of Rp1,150/share for BJBR is derived based on Gordon's growth model, assuming: a normalized Return on Equity (ROE)
of 17-18%, beta of 1.3x, risk free rate of 8.5% and market risk premium of 5.0%, implying 8.3x 15E Price to Earning Ratio (P/E) and 1.5x
15E Price to Book Ratio (P/B).
Risk: Risks to our estimates and target price of Rp1,150/share for BJBR include: (1) longer-than- anticipated tight liquidity conditions in
Indonesia as well as a faster-than-expected recovery of the currently tight liquidity conditions; (2) significant changes in global sentiment;
(3) significant changes in public's confidence in the bank; (4) risks relating to Indonesia, including macroeconomic, political and social
risks; and (5) currency risks
Price Target: (12 months) for PT Bank Mandiri (Persero) Tbk (BMRI.JK)
Method: Our target price of Rp13,700/share for BMRI is derived based on Gordon's growth model, assuming: (1) a sustainable return of equity
(ROE) of 19-20%; (2) a beta of 0.9x; and (3) cost of equity of 13.0%, implying 14.6x 2015E price to earnings ratio (P/E) and 2.7x 2015E
price to book ratio (P/B).
Risk: Risks to our estimates and target price of Rp13,700/share for BMRI include: (1) longer-than-anticipated tight liquidity conditions in
Indonesia as well as faster-than-expected recovery of the currently tight liquidity conditions; (2) significant changes in global sentiment; (3)
significant changes in the public's confidence in the bank; (4) risks relating to Indonesia, including macroeconomic, political and social
risks; (5) risks of major changes in the bank's current management team; and (6) currency risks.
Price Target: (12 months) for PT Bank Tabungan Pensiunan Nasional Tbk (BTPN.JK)
Method: Our target price of Rp5,050/share for BTPN is derived based on Gordon's growth model, assuming a normalised return of equity (ROE) of
18%, beta of 1.3x, risk-free rate of 8.5% and market risk premium of 5.0%, implying 2.5x 2015E price-to-book ratio (P/B) and 11.0x 2015E
price-to-earnings ratio (P/E).
Risk: Risks to our estimates and target price of Rp5,050/share for BTPN include: (1) challenges in tight liquidity conditions sustaining longer
than our initial expectation; (2) significant changes in global sentiment; (3) an unexpected deterioration in the public's confidence in
10 April 2015
Indonesia Banks Sector 38
Indonesian banks; (4) risks relating to Indonesia including macroeconomics, geopolitics and social risks; (5) risks relating to changes in
the management team; (6) currency risks; and (7) a slower-than-expected expansion in micro segments.
Please refer to the firm's disclosure website at https://rave.credit-suisse.com/disclosures for the definitions of abbreviations typically used in the
target price method and risk sections.
See the Companies Mentioned section for full company names
The subject company (BBCA.JK, BBNI.JK, BBRI.JK, BDMN.JK, BMRI.JK, BTPN.JK) currently is, or was during the 12-month period preceding the
date of distribution of this report, a client of Credit Suisse.
Credit Suisse provided investment banking services to the subject company (BBNI.JK, BBRI.JK, BMRI.JK, BTPN.JK) within the past 12 months.
Credit Suisse has managed or co-managed a public offering of securities for the subject company (BBRI.JK, BMRI.JK) within the past 12 months.
Credit Suisse has received investment banking related compensation from the subject company (BBNI.JK, BBRI.JK, BMRI.JK, BTPN.JK) within the
past 12 months
Credit Suisse expects to receive or intends to seek investment banking related compensation from the subject company (BBCA.JK, BBNI.JK,
BBRI.JK, BDMN.JK, BMRI.JK, BTPN.JK) within the next 3 months.
Credit Suisse may have interest in (BBCA.JK, BBNI.JK, BBRI.JK, BBTN.JK, BDMN.JK, BJBR.JK, BMRI.JK, BTPN.JK)
Credit Suisse has a material conflict of interest with the subject company (BDMN.JK) . Credit Suisse is one of the joint financial advisors to DBS
Group Holdings Limited in relation to the proposed acquisition of PT Bank Danamon Indonesia Tbk.
Important Regional Disclosures
Singapore recipients should contact Credit Suisse AG, Singapore Branch for any matters arising from this research report.
The analyst(s) involved in the preparation of this report have not visited the material operations of the subject company (BBCA.JK, BBNI.JK,
BBRI.JK, BBTN.JK, BDMN.JK, BJBR.JK, BMRI.JK, BTPN.JK) within the past 12 months
Restrictions on certain Canadian securities are indicated by the following abbreviations: NVS--Non-Voting shares; RVS--Restricted Voting Shares;
SVS--Subordinate Voting Shares.
Individuals receiving this report from a Canadian investment dealer that is not affiliated with Credit Suisse should be advised that this report may not
contain regulatory disclosures the non-affiliated Canadian investment dealer would be required to make if this were its own report.
For Credit Suisse Securities (Canada), Inc.'s policies and procedures regarding the dissemination of equity research, please visit
http://www.csfb.com/legal_terms/canada_research_policy.shtml.
Credit Suisse has acted as lead manager or syndicate member in a public offering of securities for the subject company (BBCA.JK, BBNI.JK,
BBRI.JK, BBTN.JK, BDMN.JK, BMRI.JK, BTPN.JK) within the past 3 years.
As of the date of this report, Credit Suisse acts as a market maker or liquidity provider in the equities securities that are the subject of this report.
Principal is not guaranteed in the case of equities because equity prices are variable.
Commission is the commission rate or the amount agreed with a customer when setting up an account or at any time after that.
To the extent this is a report authored in whole or in part by a non-U.S. analyst and is made available in the U.S., the following are important
disclosures regarding any non-U.S. analyst contributors: The non-U.S. research analysts listed below (if any) are not registered/qualified as research
analysts with FINRA. The non-U.S. research analysts listed below may not be associated persons of CSSU and therefore may not be subject to the
NASD Rule 2711 and NYSE Rule 472 restrictions on communications with a subject company, public appearances and trading securities held by a
research analyst account.
Credit Suisse AG, Singapore Branch..................................................................................................................................................... Sanjay Jain
For Credit Suisse disclosure information on other companies mentioned in this report, please visit the website at https://rave.credit-
suisse.com/disclosures or call +1 (877) 291-2683.
Indonesia Banking Review (April 2015)

More Related Content

What's hot

YESBAN 2 Mar 2015 Final Memo
YESBAN 2 Mar 2015 Final MemoYESBAN 2 Mar 2015 Final Memo
YESBAN 2 Mar 2015 Final MemoPawan Kaul
 
Empowering MSMEs - Role of Banks - part - 2
Empowering MSMEs - Role of Banks - part - 2Empowering MSMEs - Role of Banks - part - 2
Empowering MSMEs - Role of Banks - part - 2Resurgent India
 
Australia’s Big 4 Banks Reviewed Plus RBA Interest Rate Discussion
Australia’s Big 4 Banks Reviewed Plus RBA Interest Rate DiscussionAustralia’s Big 4 Banks Reviewed Plus RBA Interest Rate Discussion
Australia’s Big 4 Banks Reviewed Plus RBA Interest Rate DiscussionInvast Financial Services
 
Consumer Finance Market Customer Survey 2015_Demo
Consumer Finance Market Customer Survey 2015_DemoConsumer Finance Market Customer Survey 2015_Demo
Consumer Finance Market Customer Survey 2015_DemoHang Pham.M
 
India: A Nation In Stress
India: A Nation In StressIndia: A Nation In Stress
India: A Nation In StressRayan Dalal
 
Factors Affecting Return on Assets (ROA) in Banking Companies Listed in Indon...
Factors Affecting Return on Assets (ROA) in Banking Companies Listed in Indon...Factors Affecting Return on Assets (ROA) in Banking Companies Listed in Indon...
Factors Affecting Return on Assets (ROA) in Banking Companies Listed in Indon...AJSSMTJournal
 
Growing NPA load to bring more pain for PSU Banks
Growing NPA load to bring more pain for PSU BanksGrowing NPA load to bring more pain for PSU Banks
Growing NPA load to bring more pain for PSU BanksProglobalcorp India
 
PBBANK – Fundamental Analysis FY14
PBBANK – Fundamental Analysis FY14PBBANK – Fundamental Analysis FY14
PBBANK – Fundamental Analysis FY14lcchong76
 
20140513-Vietnam-Consumer_Finance_2014_Demo_20140811143029
20140513-Vietnam-Consumer_Finance_2014_Demo_2014081114302920140513-Vietnam-Consumer_Finance_2014_Demo_20140811143029
20140513-Vietnam-Consumer_Finance_2014_Demo_20140811143029Hang Pham.M
 
The World This Week -21st to 26th Sept, 2015
The World This Week -21st to 26th Sept, 2015The World This Week -21st to 26th Sept, 2015
The World This Week -21st to 26th Sept, 2015Karvy Private Wealth
 
Hyundai card ir material (fy 2014 3 q) en
Hyundai card ir material (fy 2014 3 q) enHyundai card ir material (fy 2014 3 q) en
Hyundai card ir material (fy 2014 3 q) enHyundai Finance
 
현대카드 Ir 자료 (2014 3 q) en
현대카드 Ir 자료 (2014 3 q) en현대카드 Ir 자료 (2014 3 q) en
현대카드 Ir 자료 (2014 3 q) enHyundai Finance
 

What's hot (20)

YESBAN 2 Mar 2015 Final Memo
YESBAN 2 Mar 2015 Final MemoYESBAN 2 Mar 2015 Final Memo
YESBAN 2 Mar 2015 Final Memo
 
Portfolio study latest
Portfolio study latestPortfolio study latest
Portfolio study latest
 
Empowering MSMEs - Role of Banks - part - 2
Empowering MSMEs - Role of Banks - part - 2Empowering MSMEs - Role of Banks - part - 2
Empowering MSMEs - Role of Banks - part - 2
 
research report
research reportresearch report
research report
 
SME Financing Singapore Guide
SME Financing Singapore GuideSME Financing Singapore Guide
SME Financing Singapore Guide
 
Australia’s Big 4 Banks Reviewed Plus RBA Interest Rate Discussion
Australia’s Big 4 Banks Reviewed Plus RBA Interest Rate DiscussionAustralia’s Big 4 Banks Reviewed Plus RBA Interest Rate Discussion
Australia’s Big 4 Banks Reviewed Plus RBA Interest Rate Discussion
 
Consumer Finance Market Customer Survey 2015_Demo
Consumer Finance Market Customer Survey 2015_DemoConsumer Finance Market Customer Survey 2015_Demo
Consumer Finance Market Customer Survey 2015_Demo
 
India: A Nation In Stress
India: A Nation In StressIndia: A Nation In Stress
India: A Nation In Stress
 
research report
research reportresearch report
research report
 
Factors Affecting Return on Assets (ROA) in Banking Companies Listed in Indon...
Factors Affecting Return on Assets (ROA) in Banking Companies Listed in Indon...Factors Affecting Return on Assets (ROA) in Banking Companies Listed in Indon...
Factors Affecting Return on Assets (ROA) in Banking Companies Listed in Indon...
 
Economic Capsule March 2010
Economic Capsule March 2010Economic Capsule March 2010
Economic Capsule March 2010
 
Growing NPA load to bring more pain for PSU Banks
Growing NPA load to bring more pain for PSU BanksGrowing NPA load to bring more pain for PSU Banks
Growing NPA load to bring more pain for PSU Banks
 
PBBANK – Fundamental Analysis FY14
PBBANK – Fundamental Analysis FY14PBBANK – Fundamental Analysis FY14
PBBANK – Fundamental Analysis FY14
 
20140513-Vietnam-Consumer_Finance_2014_Demo_20140811143029
20140513-Vietnam-Consumer_Finance_2014_Demo_2014081114302920140513-Vietnam-Consumer_Finance_2014_Demo_20140811143029
20140513-Vietnam-Consumer_Finance_2014_Demo_20140811143029
 
The World This Week -21st to 26th Sept, 2015
The World This Week -21st to 26th Sept, 2015The World This Week -21st to 26th Sept, 2015
The World This Week -21st to 26th Sept, 2015
 
634891048388871123
634891048388871123634891048388871123
634891048388871123
 
Hyundai card ir material (fy 2014 3 q) en
Hyundai card ir material (fy 2014 3 q) enHyundai card ir material (fy 2014 3 q) en
Hyundai card ir material (fy 2014 3 q) en
 
634824334331315452
634824334331315452634824334331315452
634824334331315452
 
Economic Capsule - September 2012
Economic Capsule - September 2012Economic Capsule - September 2012
Economic Capsule - September 2012
 
현대카드 Ir 자료 (2014 3 q) en
현대카드 Ir 자료 (2014 3 q) en현대카드 Ir 자료 (2014 3 q) en
현대카드 Ir 자료 (2014 3 q) en
 

Viewers also liked

Financial institution in indonesia
Financial institution in indonesiaFinancial institution in indonesia
Financial institution in indonesiaHafizah Samanal
 
Indonesia Financial Market
Indonesia Financial MarketIndonesia Financial Market
Indonesia Financial Marketguest61291a3a
 
Indonesia State Owned Power Company PLN - May 2015
Indonesia State Owned Power Company PLN - May 2015Indonesia State Owned Power Company PLN - May 2015
Indonesia State Owned Power Company PLN - May 2015Mohammad Syahrial
 
Proposition for a Definition of Sustainable Finance in Indonesia GIZ PRIME 12...
Proposition for a Definition of Sustainable Finance in Indonesia GIZ PRIME 12...Proposition for a Definition of Sustainable Finance in Indonesia GIZ PRIME 12...
Proposition for a Definition of Sustainable Finance in Indonesia GIZ PRIME 12...Volker Bromund
 
121010_Mobile Banking & Payments for Emerging Asia Summit 2012_Next Generatio...
121010_Mobile Banking & Payments for Emerging Asia Summit 2012_Next Generatio...121010_Mobile Banking & Payments for Emerging Asia Summit 2012_Next Generatio...
121010_Mobile Banking & Payments for Emerging Asia Summit 2012_Next Generatio...spirecorporate
 

Viewers also liked (6)

Financial institution in indonesia
Financial institution in indonesiaFinancial institution in indonesia
Financial institution in indonesia
 
Indonesia Financial Market
Indonesia Financial MarketIndonesia Financial Market
Indonesia Financial Market
 
Indonesia State Owned Power Company PLN - May 2015
Indonesia State Owned Power Company PLN - May 2015Indonesia State Owned Power Company PLN - May 2015
Indonesia State Owned Power Company PLN - May 2015
 
Proposition for a Definition of Sustainable Finance in Indonesia GIZ PRIME 12...
Proposition for a Definition of Sustainable Finance in Indonesia GIZ PRIME 12...Proposition for a Definition of Sustainable Finance in Indonesia GIZ PRIME 12...
Proposition for a Definition of Sustainable Finance in Indonesia GIZ PRIME 12...
 
Infrastructure Finance in Indonesia
Infrastructure Finance in IndonesiaInfrastructure Finance in Indonesia
Infrastructure Finance in Indonesia
 
121010_Mobile Banking & Payments for Emerging Asia Summit 2012_Next Generatio...
121010_Mobile Banking & Payments for Emerging Asia Summit 2012_Next Generatio...121010_Mobile Banking & Payments for Emerging Asia Summit 2012_Next Generatio...
121010_Mobile Banking & Payments for Emerging Asia Summit 2012_Next Generatio...
 

Similar to Indonesia Banking Review (April 2015)

Banking sector in bangladesh moving from diagnosis to action
Banking sector in bangladesh moving from diagnosis to actionBanking sector in bangladesh moving from diagnosis to action
Banking sector in bangladesh moving from diagnosis to actionCentre for Policy Dialogue (CPD)
 
RBL Bank Strategy analysis and formulation
RBL Bank Strategy analysis and formulationRBL Bank Strategy analysis and formulation
RBL Bank Strategy analysis and formulationKorivi Sravan Kumar
 
Banking challenges IE MBA Ardyan Gumanti
Banking challenges   IE MBA Ardyan GumantiBanking challenges   IE MBA Ardyan Gumanti
Banking challenges IE MBA Ardyan GumantiArdyan Humala Gumanti
 
Federal Bank Fundamental Report
Federal Bank Fundamental ReportFederal Bank Fundamental Report
Federal Bank Fundamental ReportSumeesh Thomas
 
Impact of Covid-19 on banking sector
Impact of Covid-19 on banking sectorImpact of Covid-19 on banking sector
Impact of Covid-19 on banking sectorSaumya Srivastava
 
2015-PA-en-Lower down payment regulation to boost loan growth in exchange of ...
2015-PA-en-Lower down payment regulation to boost loan growth in exchange of ...2015-PA-en-Lower down payment regulation to boost loan growth in exchange of ...
2015-PA-en-Lower down payment regulation to boost loan growth in exchange of ...Putri Amanda Mardiatiwi
 
Financial services banking
Financial services bankingFinancial services banking
Financial services bankingSourav Mishra
 
RBSA Advisors Research Report - The Big Bank Theory
RBSA Advisors Research Report - The Big Bank TheoryRBSA Advisors Research Report - The Big Bank Theory
RBSA Advisors Research Report - The Big Bank TheoryRBSA Advisors
 
Banking industry analysis report
Banking industry analysis reportBanking industry analysis report
Banking industry analysis reportDeepak Kasturi
 
Current trends in banking sector (2015) Edition
Current trends in banking sector (2015) EditionCurrent trends in banking sector (2015) Edition
Current trends in banking sector (2015) EditionIsha Desai
 
Consumer lending in vietnam
Consumer lending in vietnamConsumer lending in vietnam
Consumer lending in vietnamTrnHoQuang1
 
analysis of sbi
analysis of sbianalysis of sbi
analysis of sbiAllad1990
 
Increasing NPA In PSU Banks And Its Management
Increasing NPA  In PSU Banks And Its Management Increasing NPA  In PSU Banks And Its Management
Increasing NPA In PSU Banks And Its Management Amit Sharma
 

Similar to Indonesia Banking Review (April 2015) (20)

The npa story
The npa storyThe npa story
The npa story
 
Banking sector in bangladesh moving from diagnosis to action
Banking sector in bangladesh moving from diagnosis to actionBanking sector in bangladesh moving from diagnosis to action
Banking sector in bangladesh moving from diagnosis to action
 
Non performing assets
Non performing assetsNon performing assets
Non performing assets
 
RBL Bank Strategy analysis and formulation
RBL Bank Strategy analysis and formulationRBL Bank Strategy analysis and formulation
RBL Bank Strategy analysis and formulation
 
Banking challenges IE MBA Ardyan Gumanti
Banking challenges   IE MBA Ardyan GumantiBanking challenges   IE MBA Ardyan Gumanti
Banking challenges IE MBA Ardyan Gumanti
 
Federal Bank Fundamental Report
Federal Bank Fundamental ReportFederal Bank Fundamental Report
Federal Bank Fundamental Report
 
Impact of Covid-19 on banking sector
Impact of Covid-19 on banking sectorImpact of Covid-19 on banking sector
Impact of Covid-19 on banking sector
 
634923128569929457
634923128569929457634923128569929457
634923128569929457
 
2015-PA-en-Lower down payment regulation to boost loan growth in exchange of ...
2015-PA-en-Lower down payment regulation to boost loan growth in exchange of ...2015-PA-en-Lower down payment regulation to boost loan growth in exchange of ...
2015-PA-en-Lower down payment regulation to boost loan growth in exchange of ...
 
Financial services banking
Financial services bankingFinancial services banking
Financial services banking
 
RBSA Advisors Research Report - The Big Bank Theory
RBSA Advisors Research Report - The Big Bank TheoryRBSA Advisors Research Report - The Big Bank Theory
RBSA Advisors Research Report - The Big Bank Theory
 
Economic Capsule - February 2015
Economic Capsule - February 2015Economic Capsule - February 2015
Economic Capsule - February 2015
 
Banking industry analysis report
Banking industry analysis reportBanking industry analysis report
Banking industry analysis report
 
634940986984490399
634940986984490399634940986984490399
634940986984490399
 
Beacon July 2014
Beacon July 2014Beacon July 2014
Beacon July 2014
 
Current trends in banking sector (2015) Edition
Current trends in banking sector (2015) EditionCurrent trends in banking sector (2015) Edition
Current trends in banking sector (2015) Edition
 
Consumer lending in vietnam
Consumer lending in vietnamConsumer lending in vietnam
Consumer lending in vietnam
 
analysis of sbi
analysis of sbianalysis of sbi
analysis of sbi
 
Economic Capsule - April 2014
Economic Capsule - April 2014Economic Capsule - April 2014
Economic Capsule - April 2014
 
Increasing NPA In PSU Banks And Its Management
Increasing NPA  In PSU Banks And Its Management Increasing NPA  In PSU Banks And Its Management
Increasing NPA In PSU Banks And Its Management
 

Recently uploaded

Kempen ' UK DB Endgame Paper Apr 24 final3.pdf
Kempen ' UK DB Endgame Paper Apr 24 final3.pdfKempen ' UK DB Endgame Paper Apr 24 final3.pdf
Kempen ' UK DB Endgame Paper Apr 24 final3.pdfHenry Tapper
 
AnyConv.com__FSS Advance Retail & Distribution - 15.06.17.ppt
AnyConv.com__FSS Advance Retail & Distribution - 15.06.17.pptAnyConv.com__FSS Advance Retail & Distribution - 15.06.17.ppt
AnyConv.com__FSS Advance Retail & Distribution - 15.06.17.pptPriyankaSharma89719
 
The Inspirational Story of Julio Herrera Velutini - Global Finance Leader
The Inspirational Story of Julio Herrera Velutini - Global Finance LeaderThe Inspirational Story of Julio Herrera Velutini - Global Finance Leader
The Inspirational Story of Julio Herrera Velutini - Global Finance LeaderArianna Varetto
 
Vp Girls near me Delhi Call Now or WhatsApp
Vp Girls near me Delhi Call Now or WhatsAppVp Girls near me Delhi Call Now or WhatsApp
Vp Girls near me Delhi Call Now or WhatsAppmiss dipika
 
Overview of Inkel Unlisted Shares Price.
Overview of Inkel Unlisted Shares Price.Overview of Inkel Unlisted Shares Price.
Overview of Inkel Unlisted Shares Price.Precize Formely Leadoff
 
PMFBY , Pradhan Mantri Fasal bima yojna
PMFBY , Pradhan Mantri  Fasal bima yojnaPMFBY , Pradhan Mantri  Fasal bima yojna
PMFBY , Pradhan Mantri Fasal bima yojnaDharmendra Kumar
 
BPPG response - Options for Defined Benefit schemes - 19Apr24.pdf
BPPG response - Options for Defined Benefit schemes - 19Apr24.pdfBPPG response - Options for Defined Benefit schemes - 19Apr24.pdf
BPPG response - Options for Defined Benefit schemes - 19Apr24.pdfHenry Tapper
 
NO1 Certified Black Magic Specialist Expert In Bahawalpur, Sargodha, Sialkot,...
NO1 Certified Black Magic Specialist Expert In Bahawalpur, Sargodha, Sialkot,...NO1 Certified Black Magic Specialist Expert In Bahawalpur, Sargodha, Sialkot,...
NO1 Certified Black Magic Specialist Expert In Bahawalpur, Sargodha, Sialkot,...Amil baba
 
House of Commons ; CDC schemes overview document
House of Commons ; CDC schemes overview documentHouse of Commons ; CDC schemes overview document
House of Commons ; CDC schemes overview documentHenry Tapper
 
The AES Investment Code - the go-to counsel for the most well-informed, wise...
The AES Investment Code -  the go-to counsel for the most well-informed, wise...The AES Investment Code -  the go-to counsel for the most well-informed, wise...
The AES Investment Code - the go-to counsel for the most well-informed, wise...AES International
 
Managing Finances in a Small Business (yes).pdf
Managing Finances  in a Small Business (yes).pdfManaging Finances  in a Small Business (yes).pdf
Managing Finances in a Small Business (yes).pdfmar yame
 
Stock Market Brief Deck for "this does not happen often".pdf
Stock Market Brief Deck for "this does not happen often".pdfStock Market Brief Deck for "this does not happen often".pdf
Stock Market Brief Deck for "this does not happen often".pdfMichael Silva
 
『澳洲文凭』买科廷大学毕业证书成绩单办理澳洲Curtin文凭学位证书
『澳洲文凭』买科廷大学毕业证书成绩单办理澳洲Curtin文凭学位证书『澳洲文凭』买科廷大学毕业证书成绩单办理澳洲Curtin文凭学位证书
『澳洲文凭』买科廷大学毕业证书成绩单办理澳洲Curtin文凭学位证书rnrncn29
 
Bladex 1Q24 Earning Results Presentation
Bladex 1Q24 Earning Results PresentationBladex 1Q24 Earning Results Presentation
Bladex 1Q24 Earning Results PresentationBladex
 
NO1 WorldWide Genuine vashikaran specialist Vashikaran baba near Lahore Vashi...
NO1 WorldWide Genuine vashikaran specialist Vashikaran baba near Lahore Vashi...NO1 WorldWide Genuine vashikaran specialist Vashikaran baba near Lahore Vashi...
NO1 WorldWide Genuine vashikaran specialist Vashikaran baba near Lahore Vashi...Amil baba
 
(办理原版一样)QUT毕业证昆士兰科技大学毕业证学位证留信学历认证成绩单补办
(办理原版一样)QUT毕业证昆士兰科技大学毕业证学位证留信学历认证成绩单补办(办理原版一样)QUT毕业证昆士兰科技大学毕业证学位证留信学历认证成绩单补办
(办理原版一样)QUT毕业证昆士兰科技大学毕业证学位证留信学历认证成绩单补办fqiuho152
 
NO1 WorldWide Love marriage specialist baba ji Amil Baba Kala ilam powerful v...
NO1 WorldWide Love marriage specialist baba ji Amil Baba Kala ilam powerful v...NO1 WorldWide Love marriage specialist baba ji Amil Baba Kala ilam powerful v...
NO1 WorldWide Love marriage specialist baba ji Amil Baba Kala ilam powerful v...Amil baba
 
government_intervention_in_business_ownership[1].pdf
government_intervention_in_business_ownership[1].pdfgovernment_intervention_in_business_ownership[1].pdf
government_intervention_in_business_ownership[1].pdfshaunmashale756
 
2024 Q1 Crypto Industry Report | CoinGecko
2024 Q1 Crypto Industry Report | CoinGecko2024 Q1 Crypto Industry Report | CoinGecko
2024 Q1 Crypto Industry Report | CoinGeckoCoinGecko
 

Recently uploaded (20)

Kempen ' UK DB Endgame Paper Apr 24 final3.pdf
Kempen ' UK DB Endgame Paper Apr 24 final3.pdfKempen ' UK DB Endgame Paper Apr 24 final3.pdf
Kempen ' UK DB Endgame Paper Apr 24 final3.pdf
 
AnyConv.com__FSS Advance Retail & Distribution - 15.06.17.ppt
AnyConv.com__FSS Advance Retail & Distribution - 15.06.17.pptAnyConv.com__FSS Advance Retail & Distribution - 15.06.17.ppt
AnyConv.com__FSS Advance Retail & Distribution - 15.06.17.ppt
 
The Inspirational Story of Julio Herrera Velutini - Global Finance Leader
The Inspirational Story of Julio Herrera Velutini - Global Finance LeaderThe Inspirational Story of Julio Herrera Velutini - Global Finance Leader
The Inspirational Story of Julio Herrera Velutini - Global Finance Leader
 
Vp Girls near me Delhi Call Now or WhatsApp
Vp Girls near me Delhi Call Now or WhatsAppVp Girls near me Delhi Call Now or WhatsApp
Vp Girls near me Delhi Call Now or WhatsApp
 
Overview of Inkel Unlisted Shares Price.
Overview of Inkel Unlisted Shares Price.Overview of Inkel Unlisted Shares Price.
Overview of Inkel Unlisted Shares Price.
 
PMFBY , Pradhan Mantri Fasal bima yojna
PMFBY , Pradhan Mantri  Fasal bima yojnaPMFBY , Pradhan Mantri  Fasal bima yojna
PMFBY , Pradhan Mantri Fasal bima yojna
 
BPPG response - Options for Defined Benefit schemes - 19Apr24.pdf
BPPG response - Options for Defined Benefit schemes - 19Apr24.pdfBPPG response - Options for Defined Benefit schemes - 19Apr24.pdf
BPPG response - Options for Defined Benefit schemes - 19Apr24.pdf
 
NO1 Certified Black Magic Specialist Expert In Bahawalpur, Sargodha, Sialkot,...
NO1 Certified Black Magic Specialist Expert In Bahawalpur, Sargodha, Sialkot,...NO1 Certified Black Magic Specialist Expert In Bahawalpur, Sargodha, Sialkot,...
NO1 Certified Black Magic Specialist Expert In Bahawalpur, Sargodha, Sialkot,...
 
House of Commons ; CDC schemes overview document
House of Commons ; CDC schemes overview documentHouse of Commons ; CDC schemes overview document
House of Commons ; CDC schemes overview document
 
The AES Investment Code - the go-to counsel for the most well-informed, wise...
The AES Investment Code -  the go-to counsel for the most well-informed, wise...The AES Investment Code -  the go-to counsel for the most well-informed, wise...
The AES Investment Code - the go-to counsel for the most well-informed, wise...
 
Managing Finances in a Small Business (yes).pdf
Managing Finances  in a Small Business (yes).pdfManaging Finances  in a Small Business (yes).pdf
Managing Finances in a Small Business (yes).pdf
 
Stock Market Brief Deck for "this does not happen often".pdf
Stock Market Brief Deck for "this does not happen often".pdfStock Market Brief Deck for "this does not happen often".pdf
Stock Market Brief Deck for "this does not happen often".pdf
 
『澳洲文凭』买科廷大学毕业证书成绩单办理澳洲Curtin文凭学位证书
『澳洲文凭』买科廷大学毕业证书成绩单办理澳洲Curtin文凭学位证书『澳洲文凭』买科廷大学毕业证书成绩单办理澳洲Curtin文凭学位证书
『澳洲文凭』买科廷大学毕业证书成绩单办理澳洲Curtin文凭学位证书
 
Bladex 1Q24 Earning Results Presentation
Bladex 1Q24 Earning Results PresentationBladex 1Q24 Earning Results Presentation
Bladex 1Q24 Earning Results Presentation
 
NO1 WorldWide Genuine vashikaran specialist Vashikaran baba near Lahore Vashi...
NO1 WorldWide Genuine vashikaran specialist Vashikaran baba near Lahore Vashi...NO1 WorldWide Genuine vashikaran specialist Vashikaran baba near Lahore Vashi...
NO1 WorldWide Genuine vashikaran specialist Vashikaran baba near Lahore Vashi...
 
Q1 2024 Newsletter | Financial Synergies Wealth Advisors
Q1 2024 Newsletter | Financial Synergies Wealth AdvisorsQ1 2024 Newsletter | Financial Synergies Wealth Advisors
Q1 2024 Newsletter | Financial Synergies Wealth Advisors
 
(办理原版一样)QUT毕业证昆士兰科技大学毕业证学位证留信学历认证成绩单补办
(办理原版一样)QUT毕业证昆士兰科技大学毕业证学位证留信学历认证成绩单补办(办理原版一样)QUT毕业证昆士兰科技大学毕业证学位证留信学历认证成绩单补办
(办理原版一样)QUT毕业证昆士兰科技大学毕业证学位证留信学历认证成绩单补办
 
NO1 WorldWide Love marriage specialist baba ji Amil Baba Kala ilam powerful v...
NO1 WorldWide Love marriage specialist baba ji Amil Baba Kala ilam powerful v...NO1 WorldWide Love marriage specialist baba ji Amil Baba Kala ilam powerful v...
NO1 WorldWide Love marriage specialist baba ji Amil Baba Kala ilam powerful v...
 
government_intervention_in_business_ownership[1].pdf
government_intervention_in_business_ownership[1].pdfgovernment_intervention_in_business_ownership[1].pdf
government_intervention_in_business_ownership[1].pdf
 
2024 Q1 Crypto Industry Report | CoinGecko
2024 Q1 Crypto Industry Report | CoinGecko2024 Q1 Crypto Industry Report | CoinGecko
2024 Q1 Crypto Industry Report | CoinGecko
 

Indonesia Banking Review (April 2015)

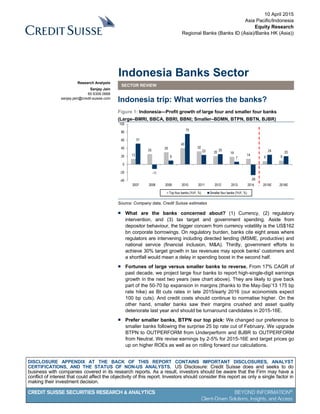
  • 1. DISCLOSURE APPENDIX AT THE BACK OF THIS REPORT CONTAINS IMPORTANT DISCLOSURES, ANALYST CERTIFICATIONS, AND THE STATUS OF NON-US ANALYSTS. US Disclosure: Credit Suisse does and seeks to do business with companies covered in its research reports. As a result, investors should be aware that the Firm may have a conflict of interest that could affect the objectivity of this report. Investors should consider this report as only a single factor in making their investment decision. CREDIT SUISSE SECURITIES RESEARCH & ANALYTICS BEYOND INFORMATION® Client-Driven Solutions, Insights, and Access 10 April 2015 Asia Pacific/Indonesia Equity Research Regional Banks (Banks ID (Asia)/Banks HK (Asia)) Indonesia Banks Sector SECTOR REVIEW Indonesia trip: What worries the banks? Figure 1: Indonesia—Profit growth of large four and smaller four banks (Large–BMRI, BBCA, BBRI, BBNI; Smaller–BDMN, BTPN, BBTN, BJBR) 13 25 30 40 32 20 19 14 8 9 51 -11 9 75 23 25 7 -26 24 20 -40 -20 0 20 40 60 80 100 2007 2008 2009 2010 2011 2012 2013 2014 2015E 2016E Top four banks (YoY, %) Smaller four banks (YoY, %) Source: Company data, Credit Suisse estimates ■ What are the banks concerned about? (1) Currency, (2) regulatory intervention, and (3) tax target and government spending. Aside from depositor behaviour, the bigger concern from currency volatility is the US$162 bn corporate borrowings. On regulatory burden, banks cite eight areas where regulators are intervening including directed lending (MSME, productive) and national service (financial inclusion, M&A). Thirdly, government efforts to achieve 30% target growth in tax revenues may spook banks' customers and a shortfall would mean a delay in spending boost in the second half. ■ Fortunes of large versus smaller banks to reverse. From 17% CAGR of past decade, we project large four banks to report high-single-digit earnings growth in the next two years (see chart above). They are likely to give back part of the 50-70 bp expansion in margins (thanks to the May-Sep’13 175 bp rate hike) as BI cuts rates in late 2015/early 2016 (our economists expect 100 bp cuts). And credit costs should continue to normalise higher. On the other hand, smaller banks saw their margins crushed and asset quality deteriorate last year and should be turnaround candidates in 2015-16E. ■ Prefer smaller banks, BTPN our top pick: We changed our preference to smaller banks following the surprise 25 bp rate cut of February. We upgrade BTPN to OUTPERFORM from Underperform and BJBR to OUTPERFORM from Neutral. We revise earnings by 2-5% for 2015-16E and target prices go up on higher ROEs as well as on rolling forward our calculations. Research Analysts Sanjay Jain 65 6306 0668 sanjay.jain@credit-suisse.com
  • 2. 10 April 2015 Indonesia Banks Sector 2 Focus charts and table Figure 2: ROA trends—Large four banks, smaller four banks and aggregate 8 banks (%) 1.8 1.7 1.8 2.1 2.5 2.8 2.9 3.0 2.9 2.8 2.7 1.7 2.1 1.6 1.6 2.3 2.3 2.3 2.1 1.4 1.6 1.71.8 1.8 1.8 2.0 2.5 2.7 2.8 2.8 2.7 2.6 2.6 0.0 0.5 1.0 1.5 2.0 2.5 3.0 3.5 2006 2007 2008 2009 2010 2011 2012 2013 2014 2015E 2016E ROA - Top four banks (%) ROA - Smaller banks (%) ROA - Overall 8 banks (%) Source: Company data, Credit Suisse estimates Figure 3: Asian currencies vs USD (3-years change, %) Figure 4: Proportion of MSME loans to total loans (%) 1 -23 3 -5 -43 -5 -20 -8 0 -4 -12 -35 -44-50.0 -40.0 -30.0 -20.0 -10.0 0.0 10.0 CN IN KR TW ID TH MY SG HK PH PK AU JP 43.8 21.6 20.3 15.5 13.0 9.2 8.7 7.9 0 10 20 30 40 50 BBRI BTPN BBNI BMRI BBTN BDMN BBCA BJBR Source: Bloomberg, Credit Suisse estimates Source: Company data, Credit Suisse estimates Figure 5: ID banks' price performance (%) Figure 6: Price/Assets (x) vs. ROA (%) 61 54 39 37 37 20 -8 -18 12 18 -2 12 14 12 4 32 -40 -20 0 20 40 60 80 BBRI BBNI BBTN BMRI BBCA BDMN BTPN BJBR 2014 YTD2015 BRI BCA MandiriDanamon BNI BJBR BTPN BBTN ID 5 15 25 35 45 55 65 0.80 1.30 1.80 2.30 2.80 3.30 Mcap / Assets 2015E (%) ROA '15E Source: Bloomberg, Credit Suisse estimates Source: Credit Suisse estimates Figure 7: Revision in profit forecasts (Rp bn) and consequent impact on ROAs, ROEs, target prices and ratings Rp bn Revised Old Change % ROA ROE Norm- Tgt Tgt Tgt Curr. Old Rating % '15E '16E '15E '16E '15E '16E '15E '16E '15E '16E alised P/B P/E Price Price Ups. TP New Old BMRI 936 1,046 919 1,007 1.9 3.9 2.40 2.37 19.8 19.1 20.3 2.8 13.9 13,700 12,075 13.5 11,800 O O BBCA 732 767 727 766 0.8 0.2 3.08 2.88 21.2 18.8 25.3 4.1 16.1 13,600 15,025 -9.5 11,500 U U BBRI 1,053 1,165 988 1,009 6.6 15.4 3.14 3.16 24.3 22.6 26.8 3.2 12.1 14,000 13,100 6.9 11,500 N N BBNI 607 659 594 632 2.2 4.4 2.56 2.45 18.8 18.5 21.3 2.5 11.5 7,550 7,225 4.5 6,000 N N BDMN 340 414 424 506 -19.7 -18.2 1.61 1.79 9.6 10.8 16.0 1.4 8.8 4,100 5,050 -18.8 3,050 U U BTPN 385 449 395 447 -2.7 0.4 2.81 2.89 17.6 17.7 22.8 2.5 11.0 5,050 4,095 23.3 3,950 O U BBTN 143 177 146 182 -2.3 -3.1 0.97 1.04 11.9 13.3 13.3 1.0 7.2 1,100 1,185 -7.2 950 N N BJBR 131 156 107 130 22.2 19.5 1.57 1.64 16.9 18.1 17.5 1.5 8.3 1,150 965 19.2 800 O N Source: Credit Suisse estimates
  • 3. 10 April 2015 Indonesia Banks Sector 3 What worries the banks? In our Indonesia trip, we met with banks as well as a few infrastructure-related companies. Top three concerns of banks: (1) Currency, (2) regulatory intervention, (3) tax target, govt spending Indonesian Rupiah has depreciated by 43% in past three years, second worst after JPY in Asia. Ordinary citizens associate falling IDR with a crisis, and could potentially lead to a capital flight = loss of deposits. Indonesian corporate sector has borrowed US$162 bn from overseas with majority being unhedged and by companies who are generally supposed to have a natural hedge but that has been eroded by commodity prices. Banks cite eight regulations hampering the sector: (1) directed lending such as UMKM (micro and small enterprise) loans to be 20% of loans by 2018. BCA would struggle on this; (2) directed lending of 70% to be "productive" loans; (3) national service through financial inclusion initiatives = higher cost for banks; (4) national service through consolidation as OJK wants to trim number of bank licences from 118 to 80; (5) 40% ownership cap on single shareholder; (6) foreign worker restrictions exacerbating talent shortage; (7) pricing controls such as on time-deposits (against the BI monetary policy) and potentially on micro lending, and (8) lack of clarity on Basel 3 capital requirements and improper co-ordination within OJK. Tax revenues missing government's 30% target would delay spending (particularly on infrastructure)—our economists forecast GDP to bottom in 2Q on this expectation. Banks' customers are being alarmed by measures to boost tax revenues such as arbitrary increases in tax to be paid by each corporate, tax officials trying to obtain the names of Indonesians who own property or place large deposits with banks (this was abandoned by government on fears of capital outflows), expanding the scope of luxury (capital gain) tax on property, etc. Macro backdrop also remains challenging—high real rates are pressuring the economy while exports fell in 2014 vis-à-vis 2011 despite 43% weaker currency. Our economists believe that government would let fiscal deficit go higher if tax falls short. Fortunes of large versus smaller banks to reverse From 17% CAGR of past decade, we project large four banks to report high-single-digit earnings growth in the next two years. 2015 is likely to be affected by a modest crimping of margins and increase in credit costs while 2016 should see a bigger margin compression from the anticipated 100 bp rate cuts of 4Q15-1Q16E. The smaller banks should enjoy the opposite trends – they suffered massively in 2014 as their margins were crushed by higher policy rates and asset quality deteriorated, and should be recovery candidates in 2015- 16E as their credit costs should remain stable while margins expand. Prefer smaller banks, BTPN top pick We changed our preference to smaller banks following the surprise 25 bp rate cut of February. We upgrade BTPN to OUTPERFORM from Underperform and BJBR to OUTPERFORM from Neutral. We revise earnings by 2-5% for 2015-16E on aggregate for the eight banks under our coverage on slightly wider margin assumptions slightly lower credit costs. Our target prices go up on higher ROEs and rolling forward our calculations. BTPN is our top pick among the Indonesian banks followed by BJBR. Although Indonesia remains a very nice structural growth story and economy should accelerate in 2016E, the large four banks are likely to suffer sharp margin compression from rate cuts. Amidst the single digit EPS growth for the first time in many years, valuations are fair at best (BCA is clearly expensive and it should see the most margin squeeze). Among the large banks, Mandiri remains our top pick with its leverage into infrastructure lending and focus on retail (including micro) that should underpin margins. IDR down 43% in three years; corporates have US$162 bn of foreign currency borrowings Directed lending and lack of clarity the most cited concerns Macro backdrop challenging, could 30% tax target make it worse? Margin squeeze for large banks as rates come down, credit costs to continue normalising Indonesia a 2016 story; Mandiri top pick among large banks
  • 4. 10 April 2015 Indonesia Banks Sector 4 Valuation snapshot Figure 8: Indonesia banks—valuation snapshot (%) BMRI BBCA BBRI BBNI BDMN BTPN BBTN BJBR CS-Aggr. Mkt cap Rp bn 277,200 371,674 322,549 132,466 48,156 23,677 12,417 8,495 1,175,722 USD mn 21,463 28,778 24,975 10,257 3,729 1,833 961 658 91,035 Rating O U N N U O N O Current price Rp 12,000 15,075 13,075 7,175 5,075 4,095 1,175 885 Target price Rp 13,700 13,600 14,000 7,550 4,100 5,050 1,100 1,150 14.2 -9.8 7.1 5.2 -19.2 23.3 -6.4 29.9 2.6 Price performance YTD 11.4 14.9 12.2 17.6 12.2 3.7 -2.5 21.2 2014 37.3 36.7 60.7 54.4 19.9 -8.1 38.5 -18.0 5Y 142 172 221 226 1 193 10Y 610 787 794 349 50 ROA 2014 2.5 3.2 3.4 2.7 1.4 2.6 0.8 1.5 2.8 2015E 2.4 3.1 3.1 2.6 1.6 2.8 1.0 1.6 2.6 2016E 2.4 2.9 3.2 2.4 1.8 2.9 1.0 1.6 2.6 ROE 2014 20.9 23.4 27.4 20.2 8.1 17.1 9.4 16.4 21.2 2015E 19.8 21.2 24.3 18.8 9.6 17.6 11.9 16.9 19.9 2016E 19.1 18.8 22.6 18.5 10.8 17.7 13.3 18.1 19.0 P/B 2014 2.7 4.8 3.3 2.3 1.5 2.0 1.0 1.2 3.1 2015E 2.4 4.0 2.8 2.2 1.4 1.7 0.9 1.1 2.7 2016E 2.0 3.4 2.3 1.9 1.3 1.5 0.8 1.0 2.3 BVPS 2014 4,399 3,151 3,955 3,164 3,420 2,022 1,155 726 2015E 5,081 3,763 4,721 3,279 3,676 2,344 1,254 824 2016E 5,871 4,384 5,570 3,839 3,969 2,716 1,402 901 BVPS growth -3Y CAGR 18.4 22.7 25.1 16.1 5.5 26.8 11.2 9.4 23.8 +2Y CAGR 15.5 18.0 18.7 10.1 7.7 15.9 10.2 11.4 17.1 2014 17.4 21.6 23.2 24.1 4.9 19.2 5.6 5.4 19.5 2015E 15.5 19.4 19.4 3.6 7.5 15.9 8.5 13.4 14.8 PPOP/assets 2014 3.6 4.3 4.5 3.7 4.2 4.6 1.7 2.7 4.1 2015E 3.5 4.3 4.3 3.7 4.2 4.9 1.8 2.7 4.0 PPOP/loans 2014 5.6 6.6 6.6 5.3 5.7 6.7 2.2 3.8 6.1 2015E 5.5 6.4 6.4 5.2 5.8 7.0 2.3 3.8 6.0 PPOP growth 2014 13.7 15.2 13.7 25.1 -10.1 -4.8 -9.8 -12.7 12.6 2015E 13.0 9.7 11.5 9.6 7.1 18.5 20.4 13.3 11.1 2016E 11.4 4.7 11.2 9.4 13.8 17.2 21.4 16.7 10.1 P/PPOP 2014 9.7 16.3 10.1 9.0 6.0 7.2 5.3 4.3 10.7 2015E 8.6 14.9 9.0 8.2 5.6 6.0 4.4 3.8 9.7 EPS (Rp) 2014 852 671 983 578 272 317 106 116 2015E 936 732 1,053 607 340 385 143 131 2016E 1,046 767 1,165 659 414 449 177 156 EPS growth -3Y CAGR 17.5 15.2 17.1 22.8 -10.5 8.7 -6.3 5.3 15.9 +2Y CAGR 10.8 7.0 8.9 6.8 23.4 18.9 29.3 15.9 9.5 2014 9.2 16.0 13.6 19.1 -35.6 -13.0 -28.6 -18.1 8.6 2015E 10.0 9.2 7.2 5.1 25.3 21.3 35.2 13.0 9.4 2016E 11.7 4.8 10.6 8.6 21.5 16.7 23.7 18.9 10.3 P/E 2014 14.1 22.5 13.3 12.4 18.7 12.9 11.1 7.6 15.5 2015E 12.8 20.6 12.4 11.8 14.9 10.6 8.2 6.8 14.2 2016E 11.5 19.6 11.2 10.9 12.3 9.1 6.7 5.7 12.9 Dividend yield 2015E 2.2 1.0 2.7 2.3 2.3 1.9 2.4 10.6 2.0 Mkt cap/assets Avg'15E % 28.7 60.2 37.8 28.3 22.8 27.9 7.5 9.9 36.7 Mkt cap/loans Avg'15E % 44.6 90.5 54.2 40.2 31.0 40.3 9.3 13.8 54.2 Mkt cap/deposits Avg'15E % 38.1 74.8 49.3 37.2 38.3 39.7 10.0 12.8 48.6 Source: Company data, Credit Suisse estimates
  • 5. 10 April 2015 Indonesia Banks Sector 5 Operational snapshot Figure 9: Indonesia banks—Operational snapshot (%) BMRI BBCA BBRI BBNI BDMN BTPN BBTN BJBR CS-Aggr. Loan Corporate 33.0 34.0 26.8 46.8 12.6 0.0 0.0 0.0 28.6 composition Comm'l/SME 37.0 37.9 25.6 27.9 30.9 0.0 9.0 13.9 29.5 Micro 6.8 0.0 31.3 0.0 13.6 29.3 0.0 9.1 11.4 Personal 12.2 28.1 16.4 19.9 42.8 66.8 91.0 77.0 26.8 Deposit Current 20.1 24.0 14.4 26.4 18.4 1.8 21.8 37.9 20.2 composition Saving 39.7 51.1 40.1 41.0 29.7 13.0 30.8 22.5 40.2 CASA 59.8 75.1 54.5 67.3 48.1 14.8 52.6 60.4 60.4 Time 40.2 24.9 45.5 32.7 51.9 85.2 47.4 39.6 39.6 Loan growth -3Y CAGR 19.2 19.7 20.4 19.2 11.9 19.9 22.2 23.3 23.2 2014 12.5 11.7 14.4 10.6 4.7 13.1 15.4 10.4 12.1 2015E 14.5 12.8 15.0 13.8 8.0 12.2 15.4 14.2 13.8 2016E 15.5 13.4 15.4 15.2 10.3 12.9 15.9 15.9 14.7 Deposit growth -3Y CAGR 14.7 11.5 17.4 10.7 10.7 14.4 19.8 13.9 14.7 2014 14.4 9.4 23.4 7.5 6.7 2.2 10.7 15.5 13.8 2015E 14.2 11.0 5.2 13.6 7.9 11.9 16.6 14.6 10.9 2016E 14.3 12.7 13.0 14.9 10.0 12.2 16.7 15.2 13.6 Loan/dep ratio 2014 85.3 81.3 83.1 92.4 123.2 98.3 108.9 93.6 88.3 2015E 85.5 82.6 90.9 92.5 123.4 98.6 107.8 93.3 90.6 Yield on IEAs 2014 8.5 8.8 11.4 8.7 12.7 18.3 11.0 12.1 10.2 2015E 8.5 8.7 11.3 8.8 12.5 18.0 10.9 12.0 10.2 Cost of IBLs 2014 3.6 2.6 4.1 3.3 6.1 8.9 6.5 6.5 4.0 2015E 3.6 2.6 4.2 3.4 5.7 8.3 6.3 6.1 4.0 NIM 4Q14 5.5 6.5 7.4 6.1 7.6 10.5 4.7 6.4 6.5 2014 5.3 6.5 7.8 5.9 7.9 10.5 4.5 6.1 6.6 2015E 5.3 6.4 7.6 5.8 8.0 10.7 4.6 6.3 6.6 2016E 5.1 6.2 7.5 5.7 8.2 11.0 4.7 6.5 6.5 Non int inc growth -3Y CAGR 12.7 7.7 21.8 17.9 3.4 58.8 21.5 30.8 15.4 2014 7.2 13.5 12.6 16.1 -15.6 90.7 16.0 63.5 9.0 2015E 12.7 10.8 13.0 12.5 12.2 27.8 11.3 13.2 12.5 2016E 12.8 9.3 14.3 12.9 12.8 21.7 13.6 12.2 12.6 Fee/revenue Avg'15E % 27.7 21.9 12.4 27.8 26.3 10.8 13.8 8.9 21.6 Fee/Assets Avg'15E % 1.9 1.7 1.0 2.2 2.6 1.2 0.7 0.6 1.7 Operating exp. -3Y CAGR 14.4 18.8 16.1 13.9 8.8 20.2 14.4 19.8 16.2 growth 2014 12.7 25.2 19.1 10.5 2.0 13.1 5.8 4.7 14.1 2015E 14.1 12.4 13.3 12.7 10.1 13.4 14.7 14.7 12.9 2016E 12.2 13.0 14.2 13.2 11.5 13.5 15.1 15.0 13.0 Cost/income Avg'15E % 47.5 45.2 45.9 52.9 57.6 56.6 62.4 60.4 48.6 Cost/Assets Avg'15E % 3.2 3.5 3.7 4.1 5.8 6.4 3.0 4.2 3.8 NPL ratio 2014 2.2 0.8 1.9 2.0 2.4 0.6 4.0 4.4 1.9 2015E 2.4 1.0 2.1 2.1 2.6 0.8 3.7 3.9 2.0 2016E 2.6 1.0 2.2 2.2 2.6 0.9 3.5 3.7 2.1 Credit cost (bp) 10Y avg 115 72 152 176 246 159 29 96 147 3Y avg 37 51 46 39 278 142 51 130 56 2014 51 65 75 65 284 155 73 129 84 2015E 67 66 89 72 274 151 60 130 90 2016E 70 60 89 72 266 160 60 125 89 LLR/Loans 2014 3.6 2.0 3.1 2.3 2.0 1.0 1.4 3.1 2.7 LLR/NPLs 2014 175 220 164 132 106 154 34 72 143 Core T1 CAR 2014 14.8 16.2 17.1 15.2 17.3 22.4 14.1 15.1 16.1 2015E 14.9 16.6 17.2 13.9 17.4 22.8 13.5 14.7 16.0 Source: Company data, Credit Suisse estimates
  • 6. 10 April 2015 Indonesia Banks Sector 6 The main concerns of banks In our meetings, banks cited currency, regulatory intervention and government tax revenue targets (and weak macro backdrop) as the main concerns. (1) Currency Indonesian rupiah has depreciated 43% in past three years (4 April 2012 to 4 April 2015) vis-à-vis the USD, neck-and-neck with JPY's 44%. Figure 10: USDIDR versus IDR REER Figure 11: Asian currencies vs US$ (3-years change, %) 80 85 90 95 100 105 1108,000 9,000 10,000 11,000 12,000 13,000 Jan-08 Dec-08 Nov-09 Oct-10 Sep-11 Aug-12 Jul-13 Jun-14 USDIDR REER (RHS) 1 -23 3 -5 -43 -5 -20 -8 0 -4 -12 -35 -44 -50 -40 -30 -20 -10 0 10 CN IN KR TW ID TH MY SG HK PH PK AU JP Source: the BLOOMBERG PROFESSIONAL™ service, BIS Source: the BLOOMBERG PROFESSIONAL™ service, CS estimates In the past, currency fluctuation in Indonesia has been associated with periods of stress (1998 Asian Financial Crisis, 2008 Global Financial Crisis). Although this time it has had more to do with USD strength rather than IDR weakness, banks are concerned that the expectation could become self-feeding and potentially lead to deposit outflows. While liquidity situation has eased lately on account of subdued loan demand, there is a risk to that. Figure 12: Indonesia banking system loan growth, deposit growth and loan-to-deposit ratio (%) 20.5 19.5 27.3 25.8 14.0 26.0 30.8 10.1 23.3 24.7 23.1 21.4 11.6 4.4 7.6 8.7 16.8 14.2 19.0 15.0 13.8 20.4 18.7 15.6 13.0 12.2 46.4 51.5 60.2 64.9 64.8 68.6 78.1 75.6 77.4 81.3 86.6 92.9 92.4 0 20 40 60 80 100 0 10 20 30 40 50 60 2002 2003 2004 2005 2006 2007 2008 2009 2010 2011 2012 2013 2014 Loan growth (%) Deposit growth (%) Loan-deposit ratio (RHS, %) Source: CEIC, Credit Suisse estimates
  • 7. 10 April 2015 Indonesia Banks Sector 7 Indonesia is unique in a way from some other emerging markets such as China, India, Thailand in that it allows its citizens to keep assets/cash in foreign currency (in addition to that, some wealthy Indonesians also keep undeclared sums overseas). Figure 13: Asia: Banking system loan and deposit growth (10Y CAGR) and 2014 loan-to-deposit ratio (%) 16.4 19.8 8.3 4.0 20.9 8.1 10.1 12.2 13.0 12.9 9.8 17.4 17.4 7.2 5.3 15.9 7.6 10.2 10.9 10.3 10.1 10.7 66.7 76.1 115.7 76.3 92.4 96.0 81.6 62.8 110.5 72.2 115.3 0.0 20.0 40.0 60.0 80.0 100.0 120.0 140.0 0.0 5.0 10.0 15.0 20.0 25.0 30.0 35.0 40.0 45.0 50.0 CN IN KR TW ID TH MY PH SG HK AU Loans 10Y CAGR (%) Deposits 10Y CAGR (%) Loan-deposit ratio, 2014 (RHS, %) Source: CEIC, Credit Suisse estimates One problem cited by banks was that the monetary authority BI has embarked on the rate cut cycle prematurely when it was forced to trim policy rate by 25 bp in February. At that time, BI's take on currency was that controlled depreciation is good for Indonesian exports and leads to a natural adjustment in current account through imported inflation. Now the problem is that, if required, BI cannot use interest rates as a tool to defend the currency since it would appear to be flip-flopping. Kindly note that two-fifths of IDR government bonds are owned by foreigners. Figure 14: Indonesia—CPI vs BI rate (%) Figure 15: ID—Real policy rate using CPI and GDP deflator 0.0 2.0 4.0 6.0 8.0 10.0 12.0 14.0 16.0 18.0 20.0 Mar-01 Mar-03 Mar-05 Mar-07 Mar-09 Mar-11 Mar-13 Mar-15 CPI (%) BI rate (%) -20.0 -15.0 -10.0 -5.0 0.0 5.0 10.0 15.0 Mar-01 Mar-03 Mar-05 Mar-07 Mar-09 Mar-11 Mar-13 Mar-15 Real policy rate using CPI Real policy rate using GDP deflator Source: the BLOOMBERG PROFESSIONAL™ service, CEIC, Credit Suisse research Source: the BLOOMBERG PROFESSIONAL™ service, CEIC, Credit Suisse research One of the biggest risks of currency depreciation is unhedged borrowings of the corporate sector. As per BI, Indonesian corporate foreign currency borrowings are US$162 bn.
  • 8. 10 April 2015 Indonesia Banks Sector 8 Concerned about this, BI has imposed a requirement of 20-30% compulsory hedging on corporate sector on the portion of debt coming due in three to six months. Figure 16: Indonesia—External debt (US$ mn) 2005-14 and as % of GDP 50,580 52,927 56,032 68,480 73,606 83,789 106,732 126,245 142,572 162,843 16.5 13.2 12.1 14.7 11.6 11.0 12.3 14.1 17.6 19.0 0.0 2.0 4.0 6.0 8.0 10.0 12.0 14.0 16.0 18.0 20.0 0 40,000 80,000 120,000 160,000 200,000 240,000 2005 2006 2007 2008 2009 2010 2011 2012 2013 2014 Indonesia's external debt (USDmn) Ext. debt to nominal GDP (RHS, %) Source: Bank Indonesia, CEIC, Credit Suisse estimates This increase in value of foreign currency debt comes at a time when Indonesian corporate sector is facing a sharp slowdown in revenue as well as EBITDA growth, both running at roughly half the decade-average levels, hence may not find it easy to bear (or to pass on to the customers). Figure 17: Indonesian corporate sector sales growth (CS coverage, ex-financials), 2005-15E Figure 18: Indonesian corporate sector EBITDA growth (CS coverage, ex-financials), 2005-15E 14% 17% 26% 6% 15% 12% 20% 13% 7% 10% 10% 0% 5% 10% 15% 20% 25% 30% '05 '06 '07 '08 '09 '10 '11 '12 '13 '14E '15E 21% 9% 30% 23% 21% 6% 14% 7% -1% 10% 11% -5% 0% 5% 10% 15% 20% 25% 30% 35% '05 '06 '07 '08 '09 '10 '11 '12 '13 '14E '15E Source: Credit Suisse estimates Source: Credit Suisse estimates Not only growth, profitability of Indonesian corporate sector had also come under pressure by 2013 (we do not have data for 2014 yet). And despite the 43% currency decline in past three years, Indonesia is one of the rare countries to be suffering smaller export value (partly due to sharp fall in prices of coal/CPO and partly due to commodity demand slowdown in China) – a boom in exports could have helped the borrowers repay their USD loans.
  • 9. 10 April 2015 Indonesia Banks Sector 9 Figure 19: Indonesian corporate (ex-financials) ROIC (%) Figure 20: Asia: Exports 2011 vs 2014 (US$ bn) 10.2 12.1 13.3 12.5 17.6 13.4 13.4 14.5 16.1 14.1 11.2 0 2 4 6 8 10 12 14 16 18 20 '03 '04 '05 '06 '07 '08 '09 '10 '11 '12 '13 303 555 292 203 219 228 224 429 48 321 573 296 176 225 234 216 474 62 0 100 200 300 400 500 600 CN IN KR TW ID TH MY SG HK PH Export 2011 Export 2014 2,343 1,899 Source: HOLT, Credit Suisse estimates Source: CEIC, Credit Suisse research (2) Regulatory intervention The BI a few years ago was seen as having a bent of socialist, populist and nationalist tendencies. For instance, Indonesia used to be the only country in Asia imposing a penalty on banks with loan-deposit ratio below 78%. As Indonesia kept doing well through the past decade and weathered the Global Financial Crisis, the confidence of authorities expanded and led to regulation such as a 40% cap on ownership by a single shareholder even if that happens to be a proper bank. That BI had also announced a requirement of 20% of loans to be UMKM (or MSME – micro, small and medium enterprises) starting from 2015 (5%) and to be complied with fully by 2018 (20%). So far, the OJK, which has taken over bank regulation from BI, has yet to announce the penalties for non-compliance. There is another regulation being imposed that requires banks to maintain 70% of loans being towards productive purposes – consumption or mortgage loans are not considered productive. Figure 21: MSME to total loans, end-2014 Figure 22: Productive loans to total loans, end-2014 43.8 21.6 20.3 15.5 13.0 9.2 8.7 7.9 0.0 5.0 10.0 15.0 20.0 25.0 30.0 35.0 40.0 45.0 50.0 BBRI BTPN BBNI BMRI BBTN BDMN BBCA BJBR UMKM (MSME) loan to total loan (%) 78.9 78.2 74.1 72.8 72.2 26.5 22.6 22.1 0.0 10.0 20.0 30.0 40.0 50.0 60.0 70.0 80.0 90.0 BMRI BBNI BBRI BBCA BDMN BJBR BTPN BBTN Productive loan to total loan (%) Source: Company data, Credit Suisse estimates Source: Company data, Credit Suisse estimates The above two regulations play with the lending strategies of banks and veers them towards areas that may not be their strength. More importantly, it has proven time and again that such directed lending always leads to asset quality issues in future—India being a prime example of this on agricultural lending. In Indonesia, the key question will be UMKM loans to be 20% and productive 70% Directed lending always ends in tears—just ask the Indian banks
  • 10. 10 April 2015 Indonesia Banks Sector 10 whether the addressable market will be big enough for the MSME segment, especially when infrastructure lending takes off and banks will need to find 20% of that as MSME (one chunky infrastructure loan could be equal to thousands of smaller MSME loans). The new initiative that banks are being involved in is financial inclusion. Indonesia has 152 mn bank accounts but far fewer individual account holders. Authorities believe some 120 mn Indonesians, four-fifths of the adult population, do not have a bank account. Their total savings are estimated to be Rp200 tn = 5% of the current system deposits. As of now, we hope banks will only be asked to facilitate opening of saving deposit accounts and not be forced to lend to those customers. Except for BTPN, we believe most banks will treat this as a cost initiative in the interests of national service. The four banks identified by the government to kick start this are BRI, BCA, Mandiri and BTPN. Please note cost efficiency of Indonesian banks at 48% is broadly in line with the Asian average but their cost/asset ratio is the highest among Asian bank sectors, i.e. their cost/income appears in line because their revenues are boosted by lofty net interest margins. Figure 23: Asia banks—Cost-to-income ratio 2015E (%) Figure 24: Asia banks—Cost-to- asset ratio 2015E (%) 36 38 43 43 43 43 46 46 48 48 49 54 56 57 59 0 10 20 30 40 50 60 HK CN IN-P SG AU TW MY IN PK ID IN-G TH KR PH JP 0.8 0.8 0.8 1.0 1.1 1.2 1.4 1.4 1.7 1.9 2.4 2.5 2.5 2.8 3.7 0.0 0.5 1.0 1.5 2.0 2.5 3.0 3.5 4.0 HK TW JP SG AU CN MY KR IN-G IN IN-P PH PK TH ID Note: Aggregated for CS coverage banks in each market; IN-P denotes Indian private sector banks, IN-G government owned Source: Company data, Credit Suisse estimates Note: Aggregated for CS coverage banks in each market; IN-P denotes Indian private sector banks, IN-G government owned Source: Company data, Credit Suisse estimates There are three product prices that are controlled by the government: (1) Time deposits: From 1 October 2014, pricing is linked to the BI rate and banks are allowed to pay 200-225 bp over that; (2) Credit cards: It is capped at 3% per month and all of the banks under our coverage are well within that (generally they are charging around 2% per month); and (3) Subsidised mortgage: Aimed at promoting home ownership in the low-income population, the rate is currently set at 7.25%. Government provides 70% financing as a demand deposit and also underwrites the credit risk. Under the previous government (which changed in 4Q14), some ministers had talked about limiting the micro lending rate. The authorities had explained that some smaller banks were lending at usurious rates of 40-50% to micro customers and the move was aimed at curbing them. Therefore, it would not have affected the banks in our coverage (where the average yield on micro is 20-28%) except for the new product of BTPN that it calls "productive loan". It is an even smaller loan of Rp2-3 mn (US$200-300) aimed at lower income segment and is largely unsecured. If the micro lending rate is capped at, say, 3% per month, BTPN might be able to scrape by on its productive loans, and capping it lower would have the opposite effect of pushing such customers towards loan sharks who are their only alternative. Financial inclusion—national service Pricing caps—micro next?
  • 11. 10 April 2015 Indonesia Banks Sector 11 Banks are also apprehensive about a nationalist streak with foreign employees being actively discouraged and their contracts not being renewed, including for senior positions where local talent is not abundantly available. This is being felt particularly by the foreign owned banks or even the private sector banks in general. In addition, the foreign owned banks are still concerned about the 40% single shareholding limit being applied retroactively. OJK is acutely aware of the tail risk from having 118 bank licences and has a target to reduce the number of licences to 80. It is asking the large banks to absorb a small bank in order to improve the stability of the system. Hence, every bank has pencilled in an acquisition this year without knowing how government would incentivise them to purchase another bank, whether they could find a compatible bank with clean loan books and good technology/systems, synergistic customers/branches. After the directed lending, perhaps the biggest concern of banks from the regulatory angle is lack of clarity on aspects such as Basel 3, and improper co-ordination within OJK. On the lack of clarity, banks are still awaiting guidance on Common Equity Tier 1 requirement that would allow them to declare a dividend policy. They complain that regulators still talk about total capital ratio while the post-GFC world has moved on to CET1 and other loss absorbing capital. As regards improper co-ordination, banks say that one part of OJK asks them to carry more capital or report more NPLs while another part prompts them to set more aggressive loan growth targets, etc. There is no denying that globally the regulatory backdrop has become far more burdensome following the Global Financial Crisis. However, the actions internationally are aimed at ensuring no public support is to be needed in the next crisis, forcing banks to prepare living wills, carry more capital, avoid gaming of risk weight models, etc. The difference in Indonesia is that banks are already well capitalised but the interference with their lending practices and the regulators pursuing various objectives (other than simply ensuring a healthy financial system) always have unintended consequences. (3) Tax receipts, govt spending and broader economy Banks are concerned that government efforts to increase tax collections might end up having the opposite effect—that of alarming some of the wealthy Indonesians into taking some of their money overseas and/or frightening corporates into inaction, i.e. delaying their decisions making on capital investment plans. Figure 25: Indonesia—EBITDA growth of corporate sector (ex-financials) vs. nominal GDP 23% 21% 6% 14% 7% -1% 10% 11% 25% 11% 14% 14% 10% 11% 11% 11% -5% 0% 5% 10% 15% 20% 25% 30% '08 '09 '10 '11 '12 '13 '14E '15E ID EBITDA YoY growth ID nominal GDP YoY growth Source: CEIC, Credit Suisse estimates Nationalistic streak Consolidation a lofty objective, but how to ease the cost? Need clarity on Basel 3; being pulled in different directions Globally, regulatory burden rising but Indonesia is going on the pre-GFC path trodden by other countries with not-so-happy consequences
  • 12. 10 April 2015 Indonesia Banks Sector 12 It is rare in the annals of history for a country to be able to expand tax collections by 30% in a year, and the chart below shows that Indonesia did achieve this remarkable feat in 2008. However, that was the year when fuel price hike had led to a spike in inflation and the nominal GDP expanded a whopping 25% (real GDP still grew 6%). For 2015E, our economists are forecasting nominal GDP of 11%, which may be at risk if the anticipated government spending of second half does not come through. In that backdrop, it appears very difficult for government to achieve its 30% growth target in tax collections, especially when it keeps diluting its efforts of widening the tax base—it has dropped the requirement for banks to disclose the names of large depositors and there is re-thinking on the luxury tax, etc. Figure 26: Indonesia—Nominal GDP growth versus tax revenue growth (%) 21 20 18 25 11 14 14 10 11 11 11 24 18 20 34 (6) 17 21 12 14 2 30 -10.0 -5.0 0.0 5.0 10.0 15.0 20.0 25.0 30.0 35.0 40.0 2005 2006 2007 2008 2009 2010 2011 2012 2013 2014 2015E Nominal GDP growth (%) Govt tax revenue growth (%) Source: Company data, Credit Suisse estimates Of course, the projected government spending is based on projected tax revenue. We understand the government has increased the infrastructure spending budget to Rp290 tn in 2015, one-fifth of total budgetary revenue and 2.5% of GDP. If there is a shortfall in government revenue, one possible casualty would be capital expenditure. However, our economists believe that government will likely spend a majority of the budgeted amount even if tax revenues fall short, which would mean higher fiscal deficit. The government's current estimate of fiscal deficit is 1.9% which leaves some headroom to rise. Figure 27: Government capital expenditure—planned versus actual (Rp tn) 43 63 73 102 72 82 136 152 184 230 281 33 55 64 73 76 80 118 145 181 198 - 50 100 150 200 250 300 2005 2006 2007 2008 2009 2010 2011 2012 2013 2014 2015 Budgeted Spent ? Source: Credit Suisse economics team Previous administration used to miss its capex targets. We expect the current one to do far better
  • 13. 10 April 2015 Indonesia Banks Sector 13 Why is government spending so important? Because Indonesia is facing some of the feeblest growth in a decade, with real GDP projected to slip below 5% level in 1H15 and anticipated to recover in 2H on the back of government spending. Figure 28: Projected real GDP growth—YoY and sequential QoQ SAAR (%) 5.1 5.0 4.9 5.0 5.3 5.1 5.2 5.0 2.0 5.8 4.9 7.0 3.2 4.9 5.2 6.3 0 1 2 3 4 5 6 7 8 1Q14 2Q14 3Q14 4Q14 1Q15E 2Q15E 3Q15E 4Q15E YoY growth (%) Sequential QoQ SAAR (%) Source: Credit Suisse economics team Currently the indicators of domestic consumption as well as capex demand are shaping up to be relatively sluggish. Figure 29: Slowing 4W and 2W auto sales Figure 30: Slowing demand on cement -60.0 -40.0 -20.0 0.0 20.0 40.0 60.0 80.0 100.0 Jan-10 Jan-11 Jan-12 Jan-13 Jan-14 Jan-15 4W monthly sales growth (YoY, %) 2W monthly sales growth (YoY, %) -2.0 0.0 2.0 4.0 6.0 8.0 10.0 12.0 14.0 16.0 1Q10 3Q10 1Q11 3Q11 1Q12 3Q12 1Q13 3Q13 1Q14 3Q14 2M15 Quarterly Cement sales (YoY, %) Source: GAIKINDO, Credit Suisse estimates Source: ASI, Credit Suisse estimates We do believe that infrastructure lending will pick up, possibly with some lag, in 2016. It is the key in attracting FDI in Indonesia and increasing the share of manufacturing. On a sequential basis, CS economists expect GDP to bottom in 1Q15 and accelerate in 2H on the back of government spending
  • 14. 10 April 2015 Indonesia Banks Sector 14 Fortunes of large and smaller banks to reverse Looking at the 2015-16 forecasts, our observations are: (1) Profit growth trajectory of large banks remains sluggish, pulled down by anticipated NIM pressure, particularly in 2016, as BI cuts policy rates aggressively in 4Q15-1Q16. The reverse will be true for second-tier banks, in our estimate, as they enjoy margin recovery and should report very strong earnings rebound. (2) The overall earnings growth for the eight banks in our coverage is likely to be in the 9-10% range for the next two to three years on account of margin compression in large banks. This is a far cry from the 16% CAGR of earnings over the past decade, and would imply that overall bank sector may not participate as much as we would like in the 2016E economic rebound. (3) Profitability (ROA) of the top four Indonesian banks is likely to decline in 2015 as credit costs probably rise while margins feel some pressure, and further in 2016 when margins compress even more. These are shown pictorially below: Figure 31: Net profit growth for top four banks, smaller four banks and aggregate eight banks 46 -38 36 13 25 30 40 32 20 19 14 8 9 88 -11 -26 51 -11 9 75 23 25 7 -26 24 20 52 -33 22 19 19 27 44 31 21 17 9 9 10 -60 -40 -20 0 20 40 60 80 100 2004 2005 2006 2007 2008 2009 2010 2011 2012 2013 2014 2015E 2016E Top four banks (YoY, %) Smaller banks (YoY, %) Aggregate (YoY, %) Figure 32: Return on asset for top four, smaller four and aggregate eight banks (%) 1.8 1.7 1.8 2.1 2.5 2.8 2.9 3.0 2.9 2.8 2.7 1.7 2.1 1.6 1.6 2.3 2.3 2.3 2.1 1.4 1.6 1.71.8 1.8 1.8 2.0 2.5 2.7 2.8 2.8 2.7 2.6 2.6 0.0 0.5 1.0 1.5 2.0 2.5 3.0 3.5 2006 2007 2008 2009 2010 2011 2012 2013 2014 2015E 2016E ROA - Top four banks (%) ROA - Smaller banks (%) ROA - Overall 8 banks (%) Source for both the charts above: Company data, Credit Suisse estimates
  • 15. 10 April 2015 Indonesia Banks Sector 15 Figure 33: Return on equity for top four, smaller four and aggregate eight banks (%) 18.3 17.9 20.5 23.6 26.1 26.1 24.9 24.5 23.2 21.3 20.0 16.2 20.9 16.5 14.3 18.3 17.5 17.7 16.3 10.9 12.4 13.5 18.0 18.4 19.9 22.0 24.6 24.5 23.5 23.0 21.2 19.9 19.0 0 5 10 15 20 25 30 2006 2007 2008 2009 2010 2011 2012 2013 2014 2015E 2016E ROE - Top four banks (%) ROE - Smaller banks (%) ROE - Overall 8 banks (%) Source: Company data, Credit Suisse estimates Figure 34: Net interest margin for top four, smaller four and aggregate eight banks (%) 6.1 6.1 6.4 6.2 6.5 6.1 6.0 6.4 6.5 6.5 6.3 7.2 7.8 8.2 8.5 9.1 8.3 8.4 8.1 7.0 7.1 7.3 6.3 6.3 6.7 6.5 6.9 6.4 6.4 6.6 6.6 6.6 6.5 0 1 2 3 4 5 6 7 8 9 10 2006 2007 2008 2009 2010 2011 2012 2013 2014 2015E 2016E NIM - Top four banks (%) NIM - Smaller banks (%) NIM - Overall 8 banks (%) Source: Company data, Credit Suisse estimates Figure 35: Credit cost for top four, smaller four and aggregate eight banks (bp of loans) 219 168 227 225 131 38 20 45 64 74 74 169 140 178 236 198 127 168 164 178 166 161 210 163 218 227 143 55 47 66 84 90 89 0 50 100 150 200 250 2006 2007 2008 2009 2010 2011 2012 2013 2014 2015E 2016E Credit cost - Top four banks (%) Credit cost - Smaller banks (%) Credit cost - Overall 8 banks (%) Source: Company data, Credit Suisse estimates
  • 16. 10 April 2015 Indonesia Banks Sector 16 Figure 36: Top four banks—ROA peaked in 2013. Margin expansion of 2014 was offset by credit costs (%) Figure 37: Top four banks—ROEs peaked in 2011 and are expected to decline in 2015-16E (%) 1.4 1.8 1.7 1.8 2.1 2.5 2.8 2.9 3.0 2.9 2.8 2.7 0.0 0.5 1.0 1.5 2.0 2.5 3.0 3.5 2005 2006 2007 2008 2009 2010 2011 2012 2013 2014 2015E2016E ROA - Top four banks (%) 14.7 18.3 17.9 20.5 23.6 26.1 26.1 24.9 24.5 23.2 21.3 19.9 0.0 5.0 10.0 15.0 20.0 25.0 30.0 35.0 2005 2006 2007 2008 2009 2010 2011 2012 2013 2014 2015E2016E ROE - Top four banks (%) Source: Credit Suisse estimates Source: Credit Suisse estimates Figure 38: Top four banks—Dupont analysis (% of average assets) (%) 2005 2006 2007 2008 2009 2010 2011 2012 2013 2014 2015E 2016E Interest Income 9.44 10.68 8.99 8.95 9.40 8.91 8.38 7.84 8.11 8.83 8.76 8.61 Interest expense -4.22 -5.30 -3.76 -3.45 -3.86 -3.05 -2.82 -2.30 -2.24 -2.87 -2.88 -2.78 Net interest income 5.22 5.38 5.23 5.50 5.54 5.87 5.56 5.54 5.87 5.96 5.88 5.83 Other Operating Income 1.30 1.55 1.70 1.75 1.85 1.82 1.72 1.66 1.70 1.64 1.62 1.62 Fees & commissions 0.94 1.03 1.15 1.27 1.31 1.09 1.08 1.07 1.14 1.13 1.12 1.15 Foreign exchange gains 0.07 0.10 0.12 0.28 0.19 0.13 0.10 0.12 0.16 0.12 0.11 0.11 Trading income -0.05 0.19 0.17 -0.03 0.08 0.30 0.25 0.19 0.19 0.18 0.16 0.14 Others 0.34 0.22 0.26 0.23 0.27 0.30 0.29 0.28 0.22 0.21 0.23 0.23 Total Income 6.53 6.93 6.93 7.25 7.39 7.69 7.28 7.20 7.57 7.60 7.50 7.45 Operating Expense -3.63 -3.56 -3.63 -3.47 -3.43 -3.63 -3.58 -3.52 -3.54 -3.57 -3.55 -3.59 Pre-prov optg profit 2.90 3.36 3.30 3.78 3.96 4.06 3.70 3.68 4.03 4.03 3.95 3.86 Loan loss provisions -0.82 -1.00 -0.78 -1.17 -1.24 -0.73 -0.22 -0.12 -0.30 -0.42 -0.49 -0.52 Income from operations 2.08 2.36 2.52 2.61 2.72 3.33 3.48 3.56 3.74 3.61 3.45 3.34 Non-operating income 0.06 0.07 0.07 0.08 0.19 0.07 0.12 0.15 0.12 0.14 0.13 0.14 Extraordinary income 0.00 0.00 0.00 0.00 0.00 0.00 0.00 0.00 0.00 0.00 0.00 0.00 Income before tax 2.15 2.43 2.60 2.69 2.91 3.40 3.60 3.71 3.86 3.74 3.58 3.48 Tax -0.72 -0.66 -0.88 -0.84 -0.82 -0.88 -0.76 -0.79 -0.84 -0.78 -0.75 -0.73 Minority Interests 0.00 0.00 0.00 0.00 0.00 -0.01 -0.03 -0.03 -0.03 -0.03 -0.03 -0.03 Net profit = ROA 1.42 1.77 1.72 1.85 2.09 2.51 2.81 2.89 2.99 2.93 2.79 2.71 Gearing (x) 10.33 10.35 10.42 11.11 11.31 10.39 9.29 8.61 8.20 7.92 7.62 7.35 ROE 14.70 18.30 17.94 20.54 23.64 26.11 26.12 24.86 24.52 23.23 21.27 19.93 Ratios (%) Loan growth 18.2 11.3 25.8 32.1 15.9 20.0 24.2 24.4 22.3 12.6 14.2 15.0 Net interest margin 5.86 6.14 6.06 6.39 6.16 6.45 6.08 6.00 6.36 6.53 6.46 6.32 Loan-dep ratio 57.1 56.3 58.6 67.1 66.5 69.0 73.5 79.7 86.4 84.8 87.6 88.6 Cost-income ratio 55.6 51.4 52.3 47.9 46.4 47.2 49.1 48.9 46.7 46.9 47.4 48.2 Non-int income / revenue 20.0 22.3 24.5 24.1 25.1 23.6 23.7 23.0 22.5 21.5 21.6 21.8 Credit cost (bp of loans) 187 219 168 227 225 131 38 20 45 64 74 76 Gross NPL ratio 12.8 9.0 5.5 3.4 3.0 2.5 2.1 1.7 1.5 1.7 1.9 2.0 Loan loss coverage 57 85 113 141 175 187 191 198 199 169 152 143 LLR to loan ratio 7.3 7.6 6.2 4.9 5.2 4.7 4.1 3.3 3.0 2.9 2.9 2.9 Tier-I CAR 14.5 16.5 15.2 12.6 11.9 12.3 13.2 14.2 14.4 15.8 15.7 15.9 Source: Credit Suisse estimates
  • 17. 10 April 2015 Indonesia Banks Sector 17 Figure 39: Smaller four banks—ROA peaked in 2012, plummeted in 2014 on margins as well as credit costs Figure 40: Smaller four banks—ROEs have been high teens post-GFC but plunged to low-teens in 2014 2.6 1.7 2.1 1.6 1.6 2.3 2.3 2.3 2.1 1.4 1.6 1.7 0.0 0.5 1.0 1.5 2.0 2.5 3.0 3.5 2005 2006 2007 2008 2009 2010 2011 2012 2013 2014 2015E2016E ROA - Smaller banks (%) 24.6 16.2 20.9 16.5 14.3 18.3 17.5 17.7 16.3 10.9 12.4 13.6 0.0 5.0 10.0 15.0 20.0 25.0 30.0 35.0 2005 2006 2007 2008 2009 2010 2011 2012 2013 2014 2015E2016E ROE - Smaller banks (%) Source: Credit Suisse estimates Source: Credit Suisse estimates Figure 41: Smaller four banks—Dupont analysis (% of average assets) (%) 2005 2006 2007 2008 2009 2010 2011 2012 2013 2014 2015E 2016E Interest Income 12.70 14.03 13.23 13.68 14.26 13.24 12.77 12.08 11.81 12.13 12.06 11.89 Interest expense -5.60 -7.29 -5.88 -6.07 -6.48 -5.03 -5.23 -4.52 -4.50 -5.61 -5.40 -5.10 Net interest income 7.09 6.75 7.34 7.61 7.78 8.21 7.54 7.55 7.31 6.52 6.65 6.79 Other Operating Income 1.77 1.89 1.91 1.50 1.55 1.67 1.75 1.71 1.67 1.46 1.51 1.54 Fees & commissions 0.65 0.87 0.89 0.97 1.02 0.85 0.81 0.71 0.67 0.64 0.64 0.66 Foreign exchange gains 0.12 0.00 0.00 0.02 0.13 0.00 0.00 0.00 0.00 0.00 0.00 0.00 Trading income 0.00 0.02 0.02 0.00 0.00 0.12 -0.10 0.04 0.03 0.00 0.03 0.03 Others 0.99 1.00 1.00 0.51 0.39 0.70 1.04 0.96 0.97 0.81 0.84 0.85 Total Income 8.86 8.64 9.25 9.11 9.33 9.88 9.29 9.26 8.97 7.98 8.17 8.33 Operating Expense -4.98 -4.78 -4.99 -5.33 -5.33 -5.08 -5.12 -5.01 -4.93 -4.68 -4.79 -4.83 Pre-prov optg profit 3.89 3.86 4.27 3.78 3.99 4.80 4.17 4.25 4.04 3.30 3.38 3.50 Loan loss provisions 0.08 -0.95 -0.82 -1.14 -1.56 -1.34 -0.87 -1.16 -1.17 -1.31 -1.24 -1.21 Income from operations 3.97 2.91 3.45 2.64 2.43 3.46 3.30 3.09 2.87 1.99 2.14 2.30 Non-operating income -0.20 -0.31 -0.11 0.08 -0.09 -0.27 -0.20 0.02 0.01 -0.08 0.01 0.01 Extraordinary income 0.00 0.00 0.00 0.00 -0.01 0.00 0.00 0.00 0.00 0.00 0.00 0.00 Income before tax 3.77 2.61 3.34 2.73 2.33 3.19 3.09 3.11 2.88 1.91 2.15 2.31 Tax -1.04 -0.86 -1.09 -0.93 -0.73 -0.83 -0.77 -0.74 -0.72 -0.48 -0.54 -0.58 Minority Interests -0.11 -0.10 -0.10 -0.15 -0.04 -0.04 -0.04 -0.03 -0.03 -0.02 -0.02 -0.02 Net profit = ROA 2.62 1.65 2.15 1.64 1.56 2.32 2.28 2.34 2.13 1.41 1.60 1.71 Gearing (x) 9.39 9.83 9.73 10.09 9.15 7.87 7.65 7.57 7.63 7.69 7.77 7.92 ROE 24.64 16.24 20.89 16.54 14.28 18.27 17.47 17.73 16.28 10.87 12.40 13.56 Ratios (%) Loan growth 20.4 18.8 23.9 30.2 10.9 29.0 23.9 22.7 20.5 9.9 11.9 13.3 Net interest margin 7.60 7.21 7.81 8.23 8.51 9.11 8.32 8.36 8.10 7.05 7.15 7.30 Loan-dep ratio 84.1 81.7 91.0 94.0 94.2 98.4 101.2 103.8 108.2 109.5 109.0 108.9 Cost-income ratio 56.1 55.3 53.9 58.5 57.2 51.5 55.2 54.1 55.0 58.6 58.6 57.9 Non-int income / revenue 20.0 21.9 20.7 16.5 16.6 16.9 18.8 18.4 18.6 18.2 18.5 18.5 Credit cost (bp of loans) -15 169 140 178 236 198 127 168 164 178 166 161 Gross NPL ratio 2.2 2.4 2.1 2.0 2.9 2.7 2.1 2.5 2.4 2.7 2.7 2.6 Loan loss coverage 126 120 119 107 88 94 85 63 63 66 70 77 LLR to loan ratio 2.8 2.9 2.5 2.1 2.6 2.5 1.8 1.6 1.5 1.8 1.9 2.0 Tier-I CAR 16.1 15.8 15.8 14.2 21.5 16.8 16.9 18.2 17.2 17.0 16.9 16.7 Source: Credit Suisse estimates
  • 18. 10 April 2015 Indonesia Banks Sector 18 Figure 42: Aggregate eight banks—ROA peaked in 2013 despite the margin expansion of 2014 Figure 43: Aggregate eight banks—ROEs peaked in 2010; gearing is quite low at <8.0x 1.6 1.8 1.8 1.8 2.0 2.5 2.7 2.8 2.8 2.7 2.6 2.6 0.0 0.5 1.0 1.5 2.0 2.5 3.0 3.5 2005 2006 2007 2008 2009 2010 2011 2012 2013 2014 2015E2016E ROA - Overall 8 banks (%) 16.2 18.0 18.4 19.9 22.0 24.6 24.5 23.5 23.0 21.2 19.9 19.0 0.0 5.0 10.0 15.0 20.0 25.0 30.0 35.0 2005 2006 2007 2008 2009 2010 2011 2012 2013 2014 2015E2016E ROE - Overall 8 banks (%) Source: Credit Suisse estimates Source: Credit Suisse estimates Figure 44: Indonesia banks—Overall eight banks' Dupont analysis (% of assets) (%) 2005 2006 2007 2008 2009 2010 2011 2012 2013 2014 2015E 2016E Interest Income 9.90 11.19 9.63 9.66 10.13 9.57 9.08 8.54 8.73 9.37 9.28 9.13 Interest expense -4.41 -5.60 -4.08 -3.85 -4.25 -3.35 -3.21 -2.67 -2.62 -3.32 -3.28 -3.15 Net interest income 5.49 5.59 5.55 5.82 5.88 6.23 5.88 5.88 6.11 6.05 6.00 5.98 Other Operating Income 1.37 1.60 1.73 1.71 1.81 1.79 1.73 1.67 1.70 1.61 1.60 1.61 Fees & commissions 0.90 1.01 1.11 1.23 1.27 1.05 1.04 1.01 1.06 1.05 1.04 1.07 Foreign exchange gains 0.07 0.09 0.10 0.24 0.19 0.11 0.08 0.10 0.13 0.10 0.09 0.09 Trading income -0.04 0.17 0.15 -0.03 0.07 0.27 0.20 0.17 0.16 0.15 0.14 0.12 Others 0.43 0.34 0.37 0.27 0.28 0.36 0.41 0.39 0.34 0.31 0.32 0.33 Total Income 6.86 7.18 7.28 7.53 7.68 8.02 7.60 7.54 7.81 7.66 7.60 7.59 Operating Expense -3.82 -3.75 -3.83 -3.75 -3.72 -3.85 -3.83 -3.77 -3.77 -3.75 -3.75 -3.79 Pre-prov optg profit 3.04 3.44 3.45 3.78 3.96 4.17 3.78 3.77 4.04 3.91 3.86 3.80 Loan loss provisions -0.69 -0.99 -0.79 -1.16 -1.29 -0.82 -0.32 -0.29 -0.44 -0.57 -0.61 -0.63 Income from operations 2.35 2.45 2.66 2.62 2.67 3.35 3.45 3.48 3.59 3.34 3.25 3.17 Non-operating income 0.03 0.01 0.05 0.08 0.15 0.02 0.07 0.13 0.10 0.10 0.11 0.12 Extraordinary income 0.00 0.00 0.00 0.00 0.00 0.00 0.00 0.00 0.00 0.00 0.00 0.00 Income before tax 2.38 2.46 2.71 2.69 2.82 3.37 3.52 3.61 3.69 3.45 3.35 3.29 Tax -0.77 -0.69 -0.91 -0.85 -0.81 -0.87 -0.76 -0.78 -0.82 -0.73 -0.72 -0.71 Minority Interests -0.02 -0.02 -0.02 -0.02 -0.01 -0.02 -0.03 -0.03 -0.03 -0.03 -0.03 -0.03 Net profit = ROA 1.59 1.75 1.79 1.82 2.01 2.48 2.73 2.80 2.85 2.69 2.60 2.55 Gearing (x) 10.19 10.27 10.31 10.94 10.92 9.91 8.98 8.41 8.10 7.88 7.64 7.43 ROE 16.23 17.98 18.42 19.88 21.96 24.61 24.49 23.54 23.04 21.17 19.89 18.99 Ratios (%) Loan growth 18.6 12.6 25.5 31.7 15.0 21.5 24.1 24.1 22.0 12.1 13.8 14.7 Net interest margin 6.12 6.31 6.34 6.69 6.52 6.86 6.43 6.38 6.65 6.62 6.57 6.48 Loan-dep ratio 60.5 59.8 62.7 70.8 70.1 73.0 77.4 83.2 89.6 88.3 90.6 91.5 Cost-income ratio 55.7 52.1 52.6 49.8 48.4 48.0 50.3 50.0 48.3 48.9 49.3 49.9 Non-int income / revenue 20.0 22.3 23.8 22.7 23.5 22.4 22.7 22.1 21.7 21.0 21.1 21.2 Credit cost (bp of loans) 152 210 163 218 227 143 55 47 66 84 90 91 Gross NPL ratio 10.9 7.8 4.9 3.2 3.0 2.6 2.1 1.8 1.7 1.9 2.0 2.1 Loan loss coverage 60 87 113 138 160 169 171 164 164 143 133 130 LLR to loan ratio 6.5 6.8 5.5 4.4 4.7 4.3 3.6 3.0 2.8 2.7 2.7 2.8 Tier-I CAR 14.8 16.3 15.3 12.8 13.3 13.1 13.8 14.8 14.8 16.0 15.9 16.0 Source: Credit Suisse estimates
  • 19. 10 April 2015 Indonesia Banks Sector 19 Prefer smaller banks, top pick BTPN As the detailed disclosures have become available following the 2014 full year results, we revise our earnings forecasts. Our forecasts go up by 2-5% as slightly softer loan growth is more than offset by higher net interest margins and lower credit losses. The changes in 2016 are larger than that for 2015. The upward revisions are driven by banks setting ambitious targets for margins (especially the large four banks) and following the first rate cut in February, seem to be demonstrating greater ability to manage NIMs. As regards asset quality, banks are still guiding for flat credit losses in 2015E (we keep credit costs broadly stable for 2016E). Figure 45: Revision in earnings forecasts Revised Old Change (%) (Rp bn, %) 2015E 2016E 2015E 2016E 2015E 2016E Net int inc 197 220 194 213 1.5 3.5 Non-int inc 53 59 54 62 -2.1 -5.0 Revenue 250 279 248 275 0.7 1.5 Optg exp -123 -139 -118 -132 4.1 5.4 Pre-prov profit 127 140 130 143 -2.3 -2.0 Provisions -20 -23 -25 -31 -18.1 -26.1 PBT 110 122 108 116 1.6 4.7 Net profit 85 94 84 90 2.1 5.1 Growth in Revenue 12.2 11.8 10.9 10.9 1.2 0.9 Optg exp 13.0 13.1 12.4 11.7 0.6 1.4 Pre-prov profit 11.4 10.4 9.6 10.1 1.7 0.3 Provisions 22 13 25 25 -3.5 -12.1 Net profit 9.4 10.3 7.0 7.1 2.4 3.2 Loan growth 13.8 14.7 15.2 15.3 -1.4 -0.6 Deposit growth 10.9 13.6 14.1 14.4 -3.3 -0.8 Net int margin 6.57 6.48 6.48 6.26 0.09 0.21 NPL ratio 2.0 2.1 2.1 2.2 -0.1 -0.1 Credit cost (bp) 90 89 108 117 -18 -28 LLR coverage 133 128 156 167 -22.7 -38.3 LLR to loans 2.7 2.7 3.3 3.6 -0.6 -0.9 ROA 2.60 2.56 2.61 2.47 -0.01 0.10 ROE 19.9 19.0 19.4 18.1 0.5 0.9 Source: Credit Suisse estimates The table below shows that we remain conservative vis-à-vis consensus (Bloomberg) on the four large banks and BDMN and BTPN among the smaller banks. Figure 46: Net profit forecast—CS versus consensus (Bloomberg) CS CS Consensus Consensus CS to cons. CS to cons. CS CS Consensus Consensus 2015E 2016E 2015E 2016E (%) 2015E (%) 2016E YoY'15E YoY'16E YoY'15E YoY'16E BMRI 21,849 24,406 22,632 25,863 96.5 94.4 10.0 11.7 13.9 14.3 BBCA 18,051 18,920 18,856 21,489 95.7 88.0 9.2 4.8 14.3 14.0 BBRI 25,976 28,733 27,001 30,821 96.2 93.2 7.2 10.6 11.6 14.1 BBNI 11,332 12,307 12,021 13,633 94.3 90.3 5.1 8.6 11.5 13.4 BDMN 3,263 3,965 3,531 4,294 92.4 92.3 25.3 21.5 35.6 21.6 BTPN 2,247 2,622 2,305 2,719 97.5 96.4 21.3 16.7 24.4 17.9 BBTN 1,508 1,865 1,446 1,773 104.3 105.2 35.2 23.7 29.6 22.7 BJBR 1,270 1,511 1,251 1,469 101.6 102.9 13.0 19.0 12.0 17.5 Source: the BLOOMBERG PROFESSIONAL™ service, Credit Suisse estimates
  • 20. 10 April 2015 Indonesia Banks Sector 20 Loan demand sluggish, expected to pick up in 2H15 Last year, all the banks were targeting 15-17% loan growth (in line with OJK guidance) but ended up with 12%. This year, all the banks are targeting 14-16% but the loan demand has been weak so far in 1Q15. We expect loan growth of 13.8% in 2015 on second half economic rebound and to 14.7% in 2016E as infrastructure investment starts. Figure 47: Loan growth trends (%) 2009 2010 2011 2012 2013 2014 5Y CAGR 2015E 2016E 2017E BMRI 13.4 21.4 28.3 23.6 21.6 12.5 21.4 14.5 15.5 15.6 BBCA 9.0 25.0 31.5 27.4 20.5 11.7 23.0 12.8 13.4 13.5 BBRI 28.9 19.9 17.0 23.8 23.2 14.4 19.6 15.0 15.4 15.5 BBNI 8.4 12.4 21.4 23.0 24.3 10.6 18.2 13.8 15.2 15.2 BDMN -5.0 29.3 23.1 14.5 16.9 4.7 17.4 8.0 10.3 11.8 BTPN 50.8 48.5 30.1 28.5 18.7 13.1 27.2 12.2 12.9 12.8 BBTN 26.9 25.0 23.3 28.1 23.4 15.4 23.0 15.4 15.9 16.1 BJBR 19.5 20.6 21.8 33.7 26.9 10.4 22.4 14.2 15.9 16.6 Aggregate 15.0 21.5 24.1 24.1 22.0 12.1 20.7 13.8 14.7 14.9 Bkg system 10.1 23.3 24.7 23.1 21.4 11.6 20.7 Source: Company data, Credit Suisse estimates Loans for consumption as well as for investment have decelerated. Figure 48: Loan growth by type of loans (YoY, %) Figure 49: Deposit growth by type of deposits (YoY, %) 0.0 5.0 10.0 15.0 20.0 25.0 30.0 35.0 40.0 45.0 50.0 Jan-05 Jan-06 Jan-07 Jan-08 Jan-09 Jan-10 Jan-11 Jan-12 Jan-13 Jan-14 Jan-15 Investment Working capital Consumption Total loans -10.0 0.0 10.0 20.0 30.0 40.0 Jan-05 Jan-06 Jan-07 Jan-08 Jan-09 Jan-10 Jan-11 Jan-12 Jan-13 Jan-14 Jan-15 Demand Saving Time Total deposits Source: CEIC, Credit Suisse estimates Source: CEIC, Credit Suisse estimates Liquidity has improved lately as loan demand remains soft while real rates are high. Figure 50: Deposit growth trends (%) 2009 2010 2011 2012 2013 2014 5Y CAGR 2015E 2016E 2017E BMRI 10.5 13.4 16.6 14.4 15.2 14.4 14.8 14.2 14.3 15.0 BBCA 17.0 13.2 16.5 14.5 10.6 9.4 12.8 11.0 12.7 12.9 BBRI 27.0 30.4 15.2 17.2 12.0 23.4 19.4 5.2 13.0 14.6 BBNI 15.5 3.1 19.0 11.4 13.3 7.5 10.7 13.6 14.9 14.7 BDMN -9.1 18.5 8.0 4.6 21.4 6.7 11.6 7.9 10.0 11.0 BTPN 62.7 37.9 39.5 26.5 15.8 2.2 23.6 11.9 12.2 12.2 BBTN 27.9 18.2 30.3 30.2 19.2 10.7 21.5 16.6 16.7 16.8 BJBR 29.3 34.7 22.2 29.6 -1.2 15.5 19.5 14.6 15.2 15.3 Aggregate 16.1 16.7 17.1 15.4 13.3 13.8 15.2 10.9 13.6 14.3 Bkg system 13.8 20.4 18.7 15.6 13.0 12.2 16.0 Source: Company data, Credit Suisse estimates Loan growth missed targets in 2014, likely to miss in 2015 again Deposit inflows better on high real rates
  • 21. 10 April 2015 Indonesia Banks Sector 21 Is it possible that the recent currency volatility has again led to some local wealth leaking overseas? Hard to say although we note that foreign exchange reserves have fallen to US$111 bn in March from US$115 bn in February. Figure 51: Loans show greater correlation with nominal GDP while deposits closely track money supply Indonesia: Growth in nominal GDP, loans, deposits and broad money supply (%) 18.3 25.3 11.0 14.2 14.1 10.0 10.6 10.7 27.5 30.8 10.1 23.3 24.7 23.1 21.4 11.6 19.0 15.0 13.8 20.4 18.7 15.6 13.1 12.2 19.4 14.9 13.0 15.4 16.4 15.0 12.8 11.9 0.0 5.0 10.0 15.0 20.0 25.0 30.0 35.0 2007 2008 2009 2010 2011 2012 2013 2014 Nominal GDP (YoY, %) System loan (YoY, %) System deposit (YoY, %) M2 money supply (YoY, %) Source: CEIC, Bank Indonesia, Credit Suisse estimates As a result of improving liquidity situation, loan-deposit ratio has come down to 88.3% as of 4Q14 from the peak of 94.7% in 1Q14. Please note the government has announced it will allow banks to issue long-term bonds to fund infrastructure lending although the regulators have yet to issue norms for loan-financing ratio (it will include deposits and some other types of financing in the denominator). Figure 52: Loan-deposit ratio (%) 2009 2010 2011 2012 2013 2014 2015E 2016E 2017E BMRI 64.5 69.1 76.0 82.2 86.7 85.3 85.5 86.4 86.9 BBCA 52.6 58.1 65.6 73.0 79.5 81.3 82.6 83.2 83.7 BBRI 82.4 75.8 77.0 81.4 89.6 83.1 90.9 92.8 93.5 BBNI 66.6 72.6 74.1 81.8 89.8 92.4 92.5 92.8 93.2 BDMN 95.7 104.5 119.1 130.4 125.6 123.2 123.4 123.7 124.6 BTPN 84.9 91.5 85.3 86.7 88.8 98.3 98.6 99.2 99.8 BBTN 102.6 108.4 102.6 100.9 104.4 108.9 107.8 107.1 106.4 BJBR 82.8 74.1 73.9 76.2 97.9 93.6 93.3 93.9 94.9 Aggregate 70.1 73.0 77.4 83.2 89.6 88.3 90.6 91.5 92.0 Source: Company data, Credit Suisse estimates Net interest margins—divergence on the opposite side now, to continue further in 2015-16E Following the BI directive of mid-2013 restricting loan-deposit ratios to 92% combined with the 175 bp rate hikes of May-Sep'13 caused a panic in 4Q13 among banks in their scramble to raise deposits and time-deposit rates went into double digit. In that sense, the new administration is dismantling the 2013 BI initiative (when OJK was still a part of BI) of restricting the LDR of banks to 92%.
  • 22. 10 April 2015 Indonesia Banks Sector 22 Figure 53: Banking system lending rates by loan type (%) Figure 54: Banking system deposit cost by type of deposits (%) 10.0 11.0 12.0 13.0 14.0 15.0 16.0 17.0 18.0 19.0 20.0 Jan-03 Jan-05 Jan-07 Jan-09 Jan-11 Jan-13 Jan-15 Invt loans WC loans Cons loans Average 0.00 2.00 4.00 6.00 8.00 10.00 12.00 14.00 Jan-03 Jan-05 Jan-07 Jan-09 Jan-11 Jan-13 Jan-15 Current Savings Time Average Source: CEIC, Credit Suisse estimates Source: CEIC, Credit Suisse estimates The higher rate environment boosted margins of large four banks while crushing the margins of smaller four banks in our sample. The OJK action of capping time deposit rates to 200-225 bp over BI policy rate (200 bp for the large four banks, 225 bp for next 15 banks) from 1st October 2014 and weakening loan demand helped calm the panic on deposit pricing and brought relief to the margins of smaller banks in late 4Q14. Figure 55: Net interest margin trends (%) 2009 2010 2011 2012 2013 2Q13 3Q13 4Q13 1Q14 2Q14 3Q14 4Q14 2014 2015E 2016E 2017E BMRI 5.12 5.16 4.80 5.11 5.22 5.03 5.20 5.63 5.31 5.26 5.20 5.51 5.30 5.28 5.15 5.03 BBCA 6.27 4.54 5.05 5.37 5.95 5.80 6.04 6.27 6.43 6.39 6.45 6.54 6.46 6.40 6.20 5.98 BBRI 8.98 9.99 8.54 7.63 7.90 7.57 7.95 8.74 8.21 8.25 7.86 7.36 7.79 7.63 7.54 7.46 BBNI 5.73 5.32 5.15 5.13 5.65 5.73 5.76 5.80 5.81 5.85 5.76 6.06 5.86 5.79 5.66 5.52 Large 4 6.16 6.45 6.08 6.00 6.36 6.38 6.38 6.38 6.38 6.38 6.38 6.38 6.53 6.46 6.32 6.18 BDMN 11.17 10.61 9.30 9.50 9.00 9.10 8.77 8.14 7.86 7.61 7.67 7.63 7.91 7.97 8.16 8.31 BTPN 12.14 13.53 12.08 12.23 11.57 11.87 11.92 11.02 10.70 10.98 10.05 10.46 10.49 10.74 10.97 11.05 BBTN 4.86 5.91 5.79 5.86 5.49 5.39 5.68 5.42 4.95 4.12 4.22 4.66 4.49 4.61 4.74 4.85 BJBR 7.77 7.16 6.43 6.02 7.04 7.40 6.67 6.98 6.09 5.54 6.13 6.44 6.12 6.33 6.46 6.59 Smaller 4 8.51 9.11 8.32 8.36 8.10 7.03 7.03 7.03 7.03 7.03 7.03 7.03 7.05 7.15 7.30 7.40 Aggregate 6.52 6.86 6.43 6.38 6.65 6.39 6.55 6.84 6.59 6.51 6.41 6.48 6.62 6.57 6.48 6.38 Source: Company data, Credit Suisse estimates Figure 56: Change in net interest margin from 2Q13 to 2H14 (%) 0.7 0.7 0.5 0.4 0.3 0.1 -0.7 -0.9 -1.0 -1.2 -1.4 -2.0 -1.5 -1.0 -0.5 0.0 0.5 1.0 BBCA BBRI BMRI Large 4 BBNI Aggr BBTN BTPN BJBR Small 4 BDMN Source: Company data, Credit Suisse estimates Margins of large banks were boosted by higher policy rate while those of smaller banks were crushed
  • 23. 10 April 2015 Indonesia Banks Sector 23 The reason for the divergence in margin performance since the May-Sep'13 rate hikes was the low-cost current-and-saving (CASA) deposit franchise of large versus the smaller banks. Despite the fact that current and saving deposits did not grow much in 2014 for the banking system (6% each for current and saving deposits, 20% for time deposits), the larger banks still benefited as they were able to keep CASA rates unchanged at around 2.00% while the time deposit rates took the entire brunt by rising around 350 bp, i.e. double of the 175 bp policy rate hikes of May-Sep'13. Please note current deposits are 21% of system deposits, saving 31% and time-deposits are 48% of system. Figure 57: CASA deposits cost 2% vs ~9% for time … ID banks – proportion of CASA deposits (%) Figure 58: … leading to a substantial advantage ID banks – Average cost of deposits 2014 (%) 2 20 18 22 14 20 20 38 20 26 24 13 26 30 31 40 40 40 23 43 41 51 15 46 48 53 54 60 60 60 63 67 75 0 10 20 30 40 50 60 70 80 Current account Saving account 8.9 6.7 6.5 6.5 6.1 4.1 4.0 3.6 3.5 3.3 2.6 0.0 1.0 2.0 3.0 4.0 5.0 6.0 7.0 8.0 9.0 10.0 Source: Company data, Credit Suisse estimates Source: Company data, Credit Suisse estimates Figure 59: Deposit breakdown and growth 2014 (Rp bn) 2014 YoY (%) 5Y CAGR (%) Saving Current Time Total Saving Current Time Total Saving Current Time Total BMRI 252,445 128,067 255,870 636,382 6.7 3.7 30.3 14.4 17.3 12.0 14.0 14.8 BBCA 228,993 107,419 111,494 447,906 4.2 4.1 28.8 9.4 12.3 15.8 11.3 12.8 BBRI 249,434 89,430 283,458 622,322 11.3 13.7 40.6 23.4 19.0 12.3 22.8 19.4 BBNI 128,598 82,743 102,552 313,893 10.2 (6.2) 17.8 7.5 16.9 12.9 3.9 10.7 Large 4 859,470 407,660 753,373 2,020,503 7.8 3.6 31.8 14.7 16.2 13.2 14.4 14.9 BDMN 34,625 21,437 60,434 116,495 9.5 9.7 4.2 6.7 17.6 25.6 6.1 11.6 BTPN 6,917 21,437 60,434 88,788 7.0 60.4 0.7 2.2 32.4 61.9 22.1 23.6 BBTN 32,748 23,231 50,499 106,479 12.8 22.9 4.6 10.7 29.6 25.8 16.1 21.5 BJBR 13,004 21,898 22,840 57,741 6.5 30.8 8.5 15.5 27.9 21.5 14.4 19.5 Smaller 4 87,294 88,003 194,206 369,503 10.0 21.1 3.9 8.6 24.0 24.5 13.0 17.4 Aggregate 946,764 495,663 947,580 2,390,006 8.0 5.8 25.3 13.8 16.8 14.4 14.1 15.2 Bkg system 1,235,855 844,934 1,925,423 4,006,212 6.1 6.2 19.9 12.2 16.2 15.7 15.9 16.0 Source: Company data, Credit Suisse estimates Our economists are forecasting BI to cut policy rate by 50 bp in Nov-Dec 2015 and another 50 bp in 1Q16, i.e. a total of 125 bp in this cycle (there was a 25 bp rate cut on 17 February 2015) vis-à-vis the 200 bp rate hikes during 2013-14. If this comes true, the narrowing of gap between interest rate paid on CASA (around 2.0%) and time-deposits (around 9.0% as of now) combined with the cap on time-deposit rate (to 200-225 bp over BI rate) should lead to a more balanced growth in deposits in 2015-16, in our view.
  • 24. 10 April 2015 Indonesia Banks Sector 24 (around 9.0% as of now) combined with the cap on time-deposit rate (to 200-225 bp over BI rate) should lead to a more balanced growth in deposits in 2015-16, in our view. Figure 60: CPI and policy rate—Historical and projected until 1Q16E (%) Figure 61: Indonesia—Real policy rates using CPI and GDP deflator (%) 0.0 2.0 4.0 6.0 8.0 10.0 12.0 14.0 16.0 18.0 20.0 1Q04 1Q06 1Q08 1Q10 1Q12 1Q14 1Q16 CPI (YoY, %) Policy rate (YoY, %) -20.0 -15.0 -10.0 -5.0 0.0 5.0 10.0 15.0 Mar-01 Mar-03 Mar-05 Mar-07 Mar-09 Mar-11 Mar-13 Mar-15 Real policy rate using CPI Real policy rate using GDP deflator Source: CEIC, Credit Suisse economics team Source: Credit Suisse estimates The full impact of the projected 100 bp rate cuts in 4Q15-1Q16E on margins of banks will be felt in 2016 and large banks will suffer while the smaller banks will enjoy further recovery. Figure 62: If BI cuts 100 bp by 1Q16E, then smaller banks would enjoy a margin rebound (large banks opposite) Net interest margin of each bank, 2014 and 2016E (%) Source: Company data, Credit Suisse estimates The dynamics of movement in asset yields versus cost of funding are tabulated below.
  • 25. 10 April 2015 Indonesia Banks Sector 25 Figure 63: Yield on interest earning assets (CS estimate) (%) 2009 2010 2011 2012 2013 2Q13 3Q13 4Q13 1Q14 2Q14 3Q14 4Q14 2014 2015E 2016E 2017E BMRI 9.3 8.7 8.0 7.6 7.8 7.4 7.7 8.4 8.2 8.4 8.6 8.8 8.5 8.5 8.2 7.9 BBCA 9.3 7.2 7.4 7.3 7.7 7.4 7.9 8.3 8.7 8.7 8.9 9.0 8.8 8.7 8.4 8.1 BBRI 13.3 13.6 11.9 10.4 10.6 10.2 10.7 11.8 11.3 11.7 11.8 11.3 11.4 11.3 11.0 10.8 BBNI 9.7 8.5 8.1 7.5 7.8 7.8 8.0 8.2 8.3 8.7 8.9 9.1 8.7 8.8 8.5 8.2 Large 4 10.4 9.8 9.2 8.5 8.8 8.3 8.6 9.3 9.2 9.5 9.6 9.6 9.7 9.6 9.3 9.0 BDMN 16.5 14.7 13.7 13.2 12.7 13.1 12.9 12.6 12.7 12.8 12.8 12.6 12.7 12.5 12.4 12.2 BTPN 22.3 21.4 19.5 18.7 18.0 18.0 18.2 18.0 18.5 18.9 18.3 18.0 18.3 18.0 17.8 17.6 BBTN 12.1 11.8 11.9 11.3 10.9 10.6 10.8 11.3 11.2 10.7 10.8 11.1 11.0 10.9 10.8 10.6 BJBR 14.2 13.3 12.6 11.2 12.0 12.2 11.7 12.4 12.0 11.8 11.6 12.2 12.1 12.0 11.8 11.6 Smaller 4 15.6 14.7 14.1 13.4 13.1 13.1 12.9 13.0 13.0 13.0 12.9 12.9 13.1 13.0 12.8 12.6 Aggregate 11.2 10.5 9.9 9.3 9.5 9.1 9.3 9.9 9.8 10.0 10.2 10.2 10.2 10.2 9.9 9.6 Source: Company data, Credit Suisse estimates Figure 64: Cost of funding (CS estimate) (%) 2009 2010 2011 2012 2013 2Q13 3Q13 4Q13 1Q14 2Q14 3Q14 4Q14 2014 2015E 2016E 2017E BMRI 4.6 3.9 3.6 2.9 2.9 2.7 2.8 3.1 3.3 3.6 3.8 3.7 3.6 3.6 3.4 3.2 BBCA 3.4 2.9 2.5 2.1 2.0 1.8 2.1 2.2 2.5 2.7 2.8 2.7 2.6 2.6 2.5 2.4 BBRI 5.1 4.0 3.9 3.2 3.2 3.1 3.2 3.5 3.6 4.0 4.6 4.5 4.1 4.2 4.0 3.8 BBNI 4.5 3.6 3.4 2.8 2.5 2.4 2.5 2.7 2.8 3.3 3.7 3.5 3.3 3.4 3.2 3.0 Large 4 4.5 3.6 3.4 2.8 2.7 2.6 2.7 3.0 3.1 3.4 3.8 3.7 3.5 3.5 3.3 3.2 BDMN 7.2 5.3 5.7 4.9 5.0 5.0 5.0 5.4 5.8 6.3 6.1 6.0 6.1 5.7 5.3 4.9 BTPN 10.5 8.6 8.3 7.2 7.2 6.9 7.0 7.9 8.8 9.1 9.4 8.7 8.9 8.3 7.8 7.4 BBTN 7.9 6.2 6.1 5.1 5.2 5.0 5.2 5.8 6.1 6.6 6.7 6.5 6.5 6.3 6.0 5.7 BJBR 7.0 6.7 6.7 5.5 5.2 5.1 5.3 5.8 6.4 6.7 5.9 6.2 6.5 6.1 5.8 5.4 Smaller 4 7.6 6.2 6.3 5.4 5.5 5.3 5.4 5.9 6.5 6.9 6.7 6.6 6.7 6.3 5.9 5.5 Aggregate 5.0 4.0 3.9 3.2 3.2 3.0 3.2 3.5 3.7 4.0 4.3 4.2 4.0 4.0 3.7 3.5 Source: Company data, Credit Suisse estimates Non-interest income: Slower lately Pre-GFC, non-interest income used to grow faster than net interest income. Figure 65: Indonesia banks (CS 8 banks): Net interest income and non-interest income growth 12.8 15.8 22.3 16.2 23.6 12.6 18.0 19.7 13.8 12.1 11.5 29.4 26.1 15.4 21.3 15.9 14.7 13.8 17.1 9.0 12.5 12.6 0.0 5.0 10.0 15.0 20.0 25.0 30.0 35.0 2006 2007 2008 2009 2010 2011 2012 2013 2014 2015E 2016E Net interest income (YoY, %) Non interest income (YoY,%) Source: Company data, Credit Suisse estimates (aggregated for CS coverage universe)
  • 26. 10 April 2015 Indonesia Banks Sector 26 Post-GFC, the momentum in non-interest income has waned (9% in 2014) hence their contribution to revenue has fallen (peaked in 2007 at 23.8%). For 2015-16E, we expect a similar low-to-mid-teens growth in non-interest income and a stable proportion. Figure 66: Non-interest income to revenue ratio Figure 67: Non-interest income to average asset ratio 22.3 23.8 22.7 23.5 22.4 22.7 22.1 21.7 21.0 21.1 21.2 19.5 20.0 20.5 21.0 21.5 22.0 22.5 23.0 23.5 24.0 2006 2007 2008 2009 2010 2011 2012 2013 2014 2015E 2016E Non-interest income to revenue (%) 1.6 1.7 1.7 1.8 1.8 1.7 1.7 1.7 1.6 1.6 1.6 1.5 1.5 1.6 1.6 1.7 1.7 1.8 1.8 1.9 2006 2007 2008 2009 2010 2011 2012 2013 2014 2015E 2016E Non-interest income to avg asset (%) Source: Company data, Credit Suisse estimates Source: Company data, Credit Suisse estimates Not only deposit franchise, the smaller banks are inferior on non-interest income as well. Figure 68: Non-interest income snapshot (Rp bn, %) BMRI BBCA BBRI BBNI Large 4 BDMN BTPN BBTN BJBR Smaller 4 Aggr. Total non int inc 15,142 9,006 7,211 8,480 39,840 4,763 764 926 439 6,892 46,732 2014 YoY 7.2 13.5 12.6 16.1 11.4 -15.6 90.7 16.0 63.5 -3.1 9.0 5Y CAGR 18.0 11.6 10.4 11.9 13.6 19.7 15.1 16.2 3.5 17.1 14.1 % of revenue 27.9 21.9 12.3 27.5 21.5 25.5 9.8 14.5 9.0 18.2 21 % of avg assets 1.9 1.7 1.0 2.1 1.6 2.5 1.1 0.7 0.6 1.5 1.6 Source: Company data, Credit Suisse estimates Operating expenses: Relatively inelastic? The 10Y CAGR of operating costs of Indonesian banks (aggregated for CS eight banks) is 15.9% vis-à-vis 15.4% for revenue, and the chart below shows that revenue has been a bit more variable than costs. Banks have been investing in new branches, ATMs, EDC machines, technology, etc. Combined with the mid-teen salary increases which are commonplace (not least due to similar or higher jumps in minimum salaries), the operating costs have been rising at that pace as well. For 2015-16E, we anticipate banks will try to rein in costs to some extent leading to around 13% increase annually.
  • 27. 10 April 2015 Indonesia Banks Sector 27 Figure 69: Indonesia banks (CS 8 banks): Revenue and operating expenses growth 16.1 18.1 20.7 17.4 21.8 13.1 17.0 19.2 12.7 12.2 11.8 8.7 19.2 14.2 14.1 20.9 18.5 16.2 15.3 14.1 13.0 13.1 0.0 5.0 10.0 15.0 20.0 25.0 2006 2007 2008 2009 2010 2011 2012 2013 2014 2015E 2016E Revenue (YoY, %) Operating expenses (YoY,%) Source: Company data, Credit Suisse estimates (aggregated for eight banks in CS coverage) The cost-income ratio of Indonesian banks does not appear as out of place (net interest margins lift the revenue base) in the Asian context but the cost/asset ratio is the highest. A large part of the reason is low penetration of loans as well as deposits, leading to the costs being spread over a smaller base. Put another way, the Indonesian banks should be able to run a far bigger loan book with the current cost base. Figure 70: Aggregated cost to income ratio (%) Figure 71: Operating expense to average asset ratio (%) 52.1 52.6 49.8 48.4 48.0 50.3 50.0 48.3 48.9 49.3 49.9 45.0 46.0 47.0 48.0 49.0 50.0 51.0 52.0 53.0 2006 2007 2008 2009 2010 2011 2012 2013 2014 2015E 2016E Cost to income ratio 3.7 3.8 3.7 3.7 3.9 3.8 3.8 3.8 3.7 3.7 3.8 3.7 3.7 3.8 3.8 3.9 3.9 2006 2007 2008 2009 2010 2011 2012 2013 2014 2015E 2016E Opex to avg asset (%) Source: Company data, Credit Suisse estimates Source: Company data, Credit Suisse estimates Figure 72: Operating expense snapshot (Rp bn, %) BMRI BBCA BBRI BBNI Large 4 BDMN BTPN BBTN BJBR Smaller 4 Aggregate Total opex 25,667 18,305 26,705 16,103 86,780 10,625 4,501 4,072 2,946 22,144 108,924 2014 YoY 12.7 25.2 19.1 10.5 16.6 2.0 13.1 5.8 4.7 5.2 14.1 5Y CAGR 19.4 16.7 17.4 15.0 17.3 11.8 21.9 18.0 18.8 15.5 17.0 % of revenue 47.3 44.6 45.5 52.2 46.9 56.9 57.7 63.6 60.1 58.6 48.9 % of avg. assets 3.2 3.5 3.7 4.0 3.6 5.6 6.2 3.0 4.0 4.7 3.7 Source: Company data, Credit Suisse estimates
  • 28. 10 April 2015 Indonesia Banks Sector 28 Asset quality—divergence here as well, surprisingly Although NPLs did not rise much even in 2014, credit costs did increase towards being closer to through-a-cycle average from extremely low levels of 2011-13. The smaller four banks were particularly hit last year and we hope that incrementally things will not deteriorate further in 2015-16E. In general, we do not expect big jump in NPL ratio but modest increases over the next couple of years. Figure 73: NPL ratio trends (%) 2009 2010 2011 1Q12 2Q12 2012 1Q13 2Q13 2013 1Q14 2Q14 2014 2015E 2016E 2017E BMRI 3.1 2.5 2.2 2.2 2.0 1.9 2.1 1.9 1.9 2.1 2.3 2.2 2.4 2.6 2.4 BBCA 0.7 0.7 0.6 0.7 0.6 0.4 0.5 0.5 0.5 0.5 0.6 0.8 1.0 1.0 1.0 BBRI 3.5 2.9 2.5 2.9 2.5 1.9 2.1 1.9 1.6 1.9 2.1 1.9 2.1 2.2 2.1 BBNI 4.8 4.3 3.7 3.6 3.4 2.8 2.8 2.6 2.2 2.3 2.2 2.0 2.1 2.2 2.1 BDMN 4.3 3.2 2.7 2.8 2.8 2.7 2.8 2.6 2.0 2.0 2.2 2.4 2.6 2.6 2.5 BTPN 0.5 1.1 0.7 0.7 0.7 0.6 0.7 0.6 0.7 0.7 0.8 0.6 0.8 0.9 1.0 BBTN 3.3 3.3 2.8 3.2 3.5 4.1 4.8 4.6 4.0 4.7 5.1 4.0 3.7 3.5 3.1 BJBR 2.0 2.1 1.6 1.1 2.1 2.3 2.3 2.5 3.1 4.1 4.2 4.4 3.9 3.7 3.4 Aggregate 3.0 2.6 2.1 2.2 2.0 1.8 2.0 1.8 1.7 1.9 2.0 1.9 2.0 2.1 2.0 Bkg system 3.8 2.9 2.6 2.8 2.5 2.2 2.3 2.2 1.9 2.1 2.2 2.2 Source: Company data, Credit Suisse estimates Figure 74: Special mention ratio trends (%) 2009 2010 2011 1Q12 2Q12 2012 1Q13 2Q13 2013 1Q14 2Q14 2014 BMRI 9.1 6.7 4.0 3.6 3.4 3.7 3.8 3.8 3.6 3.9 4.3 4.2 BBCA 1.4 1.5 1.3 1.5 1.5 1.4 1.7 1.4 1.5 1.9 1.9 1.6 BBRI 5.2 5.1 6.7 6.8 6.4 5.4 6.3 5.8 5.2 7.5 6.9 7.1 BBNI 7.4 5.3 4.3 5.0 3.9 3.1 4.2 3.1 2.6 3.1 3.1 2.4 BDMN 7.3 8.8 7.3 7.3 6.9 6.1 6.2 5.8 4.3 5.0 5.1 4.9 BTPN 1.3 2.0 1.3 1.7 1.6 1.6 2.3 1.9 1.8 2.3 2.2 1.6 BBTN 12.2 12.9 12.2 14.3 13.5 11.9 13.2 13.2 12.0 14.0 14.6 13.8 BJBR 0.9 1.3 2.4 3.3 3.4 3.3 4.4 4.3 4.4 4.6 4.8 4.2 Aggregate 6.3 5.5 4.8 5.0 4.6 4.2 4.8 4.4 4.0 4.9 4.9 4.7 Source: Company data, Credit Suisse estimates Figure 75: Restructured loan ratio trends (%) 2009 2010 2011 1Q12 2Q12 2012 1Q13 2Q13 2013 1Q14 2Q14 2014 BMRI 0.1 0.2 0.1 0.1 0.2 0.1 0.1 0.0 0.0 0.0 0.0 0.1 BBCA 0.3 0.3 0.2 0.5 0.5 0.4 0.4 0.4 0.4 0.3 0.3 0.3 BBRI 2.7 3.1 2.7 2.6 2.7 2.1 2.2 1.9 1.6 1.4 1.4 3.1 BBNI 9.5 5.6 4.6 4.5 4.0 3.5 3.2 2.7 2.6 2.7 2.2 2.1 BDMN 2.3 2.7 1.5 1.5 1.5 1.4 1.5 1.5 1.5 1.4 1.5 2.0 BTPN 0.0 0.0 1.3 1.3 1.2 1.3 1.4 1.4 1.8 2.0 2.1 2.3 BBTN 0.3 0.3 0.5 0.5 0.5 0.6 0.7 1.0 1.1 0.9 1.0 1.2 BJBR 0.4 0.3 0.3 0.3 0.3 0.5 0.4 0.4 0.3 0.3 0.3 0.3 Aggregate 2.4 2.0 1.5 1.5 1.5 1.3 1.3 1.1 1.0 1.0 0.9 1.4 Source: Company data, Credit Suisse estimates
  • 29. 10 April 2015 Indonesia Banks Sector 29 Figure 76: NPL + Special mention + Restructured loan ratio trends (%) 2009 2010 2011 1Q12 2Q12 2012 1Q13 2Q13 2013 1Q14 2Q14 2014 BMRI 12.2 9.3 6.2 5.6 5.2 5.6 6.0 5.7 5.5 6.0 6.4 6.3 BBCA 2.4 2.5 2.1 2.8 2.7 2.3 2.5 2.4 2.5 2.8 2.8 2.9 BBRI 11.4 11.2 11.8 12.2 11.6 9.3 10.5 9.5 8.4 10.8 10.3 12.0 BBNI 21.4 15.0 12.3 12.8 11.0 9.2 10.0 8.2 7.1 7.9 7.3 6.3 BDMN 13.1 14.5 11.2 11.1 10.7 9.6 9.9 9.3 7.4 8.0 8.4 8.8 BTPN 1.8 3.1 3.4 3.7 3.5 3.5 4.3 4.0 4.3 5.0 5.2 4.5 BBTN 15.9 16.5 15.5 18.0 17.5 16.6 18.7 18.8 17.2 19.6 20.8 19.0 BJBR 3.3 3.7 4.4 4.8 5.7 6.1 7.1 7.2 7.8 9.0 9.3 8.9 Aggregate 11.7 10.0 8.5 8.7 8.1 7.3 8.0 7.4 6.7 7.8 7.9 8.0 Source: Company data, Credit Suisse estimates We have included the first quarter and second quarter data in the tables above because there seems to be some seasonality in the first half of the year when NPLs spike, and then banks work them down in the second half (not to forget that there is a fair bit of write-offs in the fourth quarter so as to bring down the NPL ratio). Why do we expect modest-but-continued increase in NPLs? Due to the structurally slower economy and strains in corporate cash flows (for which we use EBITDA as proxy). The high real interest rates do not suggest there is any let up on the corporate sector. Please note corporate loans account for three-quarter of bank loans hence their cash flow is critical in repayment of the loans, i.e. in banks' asset quality. Credit cost—differences to narrow Credit costs fell sharply since 2011 when Indonesian banks changed their accounting method by separating out the NPL-related recoveries and taking them to non-interest income instead of deducting from new loan loss provisions in P&L (the only bank who is still use the old accounting method are Danamon). Hence, the P&L provision line in the P&L of banks now shows the gross provisions rather than net of recoveries. This accounting policy is different from the one used by most other banking sectors in Asia. We have adjusted for this and our figures below are based on the old method. Figure 77: Credit cost trends (bp of loans) (bp) 2004 2005 2006 2007 2008 Pre-GFC avg 2009 2010 2011 2012 2013 2014 2015E 2016E 2017E BMRI 3 318 297 130 159 187 103 50 -13 23 36 51 67 70 77 BBCA 61 73 97 28 170 65 182 22 -9 21 68 65 66 60 55 BBRI 234 57 219 187 203 174 310 276 136 13 49 75 89 89 89 BBNI 396 200 195 337 422 282 336 136 15 27 24 65 72 72 72 Large 4 140 187 219 168 227 178 225 131 38 20 45 64 74 74 75 BDMN -147 -62 254 209 299 64 439 289 198 286 263 284 274 266 259 BTPN 37 165 308 267 50 194 24 189 164 131 138 155 151 160 160 BBTN -181 1 41 -1 2 -35 17 71 10 30 50 73 60 60 64 BJBR 17 74 6 41 88 35 93 165 100 120 141 129 130 125 125 Smaller 4 -90 -15 169 140 178 51 236 198 127 168 164 178 166 161 158 Aggregate 100 152 210 163 218 156 227 143 55 47 66 84 90 89 89 Source: Company data, Credit Suisse estimates
  • 30. 10 April 2015 Indonesia Banks Sector 30 Figure 78: Loan loss coverage of NPLs (%) (%) 2004 2005 2006 2007 2008 2009 2010 2011 2012 2013 2014 2015E 2016E 2017E BMRI 129 44 75 109 127 201 217 193 212 205 175 152 136 145 BBCA 209 146 217 252 409 481 352 314 315 308 220 202 212 215 BBRI 196 153 155 178 177 157 185 221 218 211 164 144 134 138 BBNI 118 51 56 72 103 120 122 121 126 131 132 130 128 138 Large 4 144 57 85 113 141 175 187 191 198 199 169 152 142 150 BDMN 288 148 144 154 119 98 113 97 95 110 106 104 108 111 BTPN 137 86 137 269 467 336 128 141 171 158 154 130 125 109 BBTN 146 96 74 54 54 51 52 54 29 28 34 38 40 46 BJBR 259 332 317 238 239 113 120 119 78 73 72 81 90 101 Smaller 4 224 126 120 119 107 88 94 85 63 63 66 70 74 80 Aggregate 150 60 87 113 138 160 169 171 164 164 143 133 128 135 Source: Company data, Credit Suisse estimates Figure 79: LLR to Loan ratio (%) (%) 2004 2005 2006 2007 2008 2009 2010 2011 2012 2013 2014 2015E 2016E 2017E BMRI 8.7 10.4 11.7 9.0 6.5 6.0 5.2 4.2 3.9 3.8 3.6 3.6 3.4 3.4 BBCA 2.6 2.4 2.7 2.0 2.3 3.3 2.6 1.9 1.5 1.8 2.0 2.2 2.3 2.4 BBRI 8.0 7.0 7.3 6.0 4.9 5.4 5.5 5.4 4.0 3.4 3.1 3.0 2.9 2.8 BBNI 5.2 6.5 5.5 5.9 4.8 5.4 4.9 4.1 3.3 2.6 2.3 2.5 2.6 2.6 Large 4 6.8 7.3 7.6 6.2 4.9 5.2 4.7 4.1 3.3 3.0 2.9 2.9 2.9 2.9 BDMN 5.4 2.7 3.2 2.7 2.3 3.4 3.3 2.2 2.0 1.7 2.0 2.1 2.1 2.1 BTPN 3.3 3.0 3.3 3.5 2.8 1.7 1.5 1.0 1.0 1.0 1.0 1.0 1.1 1.0 BBTN 4.9 3.9 3.0 2.1 1.7 1.7 1.7 1.5 1.2 1.1 1.4 1.4 1.4 1.4 BJBR 1.1 1.5 1.3 1.7 1.9 2.2 2.6 1.9 1.8 2.2 3.1 3.1 3.3 3.4 Smaller 4 4.5 2.8 2.9 2.5 2.1 2.6 2.5 1.8 1.6 1.5 1.8 1.9 1.9 2.0 Aggregate 6.4 6.5 6.8 5.5 4.4 4.7 4.3 3.6 3.0 2.8 2.7 2.7 2.7 2.7 Source: Company data, Credit Suisse estimates Revision in target prices Following the changes in earnings forecasts, we take this opportunity to roll forward the target price calculation to end-2015 which leads to higher target prices. Figure 80: Target price calculation ROA ROE Target Target Target Current Old TP New Old 2015E 2016E 2015E 2016E Normalized COE P/B P/E Price Price Upside Rating Rating BMRI 2.40 2.37 19.8 19.1 20.3 13.0 2.8 13.9 13,700 12,075 13.5 11,800 O O BBCA 3.08 2.88 21.2 18.8 25.3 13.0 4.1 16.1 13,600 15,025 -9.5 11,500 U U BBRI 3.14 3.16 24.3 22.6 26.8 14.5 3.2 12.1 14,000 13,100 6.9 11,500 N N BBNI 2.56 2.45 18.8 18.5 21.3 14.0 2.5 11.5 7,550 7,225 4.5 6,000 N N BDMN 1.61 1.79 9.6 10.8 16.0 14.0 1.4 8.8 4,100 5,050 -18.8 3,050 U U BTPN 2.81 2.89 17.6 17.7 22.8 14.5 2.5 11.0 5,050 4,095 23.3 3,950 O U BBTN 0.97 1.04 11.9 13.3 13.3 13.5 1.0 7.2 1,100 1,185 -7.2 950 N N BJBR 1.57 1.64 16.9 18.1 17.5 14.5 1.5 8.3 1,150 965 19.2 800 O N Source: Company data, Credit Suisse estimates Prefer smaller banks, BTPN top pick Based on the upside, we upgrade BTPN to OUTPERFORM from Underperform and BJBR to OUTPERFORM from Neutral and make BTPN our top pick. Among the large four, Mandiri is our only OUTPERFORM-rated stock and remains our preferred pick.
  • 31. 10 April 2015 Indonesia Banks Sector 31 Valuations are fair Despite the turn in fortunes since 17 February when BI trimmed the policy rate by 25 bp to 7.50%, the larger banks still seem to be outperforming the smaller banks (which follows a significant outperformance last year). We believe this is partly due to large bank stocks more liquid (and automatically benefit from inflows into ETFs) in addition to their superior franchises in deposits and fee income. Figure 81: Price performance, 2014 (%) Figure 82: Price performance since 17 February (%) 60.7 54.4 38.5 37.3 36.7 19.9 -8.1 -18.0 -30.0 -20.0 -10.0 0.0 10.0 20.0 30.0 40.0 50.0 60.0 70.0 BBRI BBNI BBTN BMRI BBCA BDMN BTPN BJBR 24.7 13.1 10.7 7.2 7.1 2.8 2.8 -13.3 -20.0 -15.0 -10.0 -5.0 0.0 5.0 10.0 15.0 20.0 25.0 30.0 BJBR BBNI BMRI BBCA BBRI BTPN BDMN BBTN Source: the BLOOMBERG PROFESSIONAL™ service, Credit Suisse Source: the BLOOMBERG PROFESSIONAL™ service, Credit Suisse To a large extent, the top four banks have been doing well in profit terms over the years which justifies the investor interest in them. Figure 83: Large banks' profits are five-fold of pre-GFC… ID banks – Net profit 2014 vs. 2007 (x) Figure 84: … and their stock prices have trebled ID banks - 5Y cumulative price performance (%) 4.6 3.7 5.0 5.6 1.2 5.3 2.8 3.0 4.1 0.0 1.0 2.0 3.0 4.0 5.0 6.0 BMRI BBCA BBRI BBNI BDMN BTPN BBTN BJBR Aggr 143 166 216 228 0 193 135 92 0 50 100 150 200 250 BMRI BBCA BBRI BBNI BDMN BTPN JK Fin JKSE 5Y Note: For BNI, 2006 profit used as the denominator Source: Company data, Credit Suisse estimates Source: Thomson Reuters, Credit Suisse estimates All the above has led to valuations being generally in line with their historical averages.
  • 32. 10 April 2015 Indonesia Banks Sector 32 Figure 85: ID banks: P/B (x) versus ROE (%) Figure 86: ID banks: Price/Assets (%) vs. ROA (%) BRI BCA Mandiri BNI BJBR BTPN BBTN ID 0.0 0.5 1.0 1.5 2.0 2.5 3.0 3.5 4.0 4.5 10.0 12.0 14.0 16.0 18.0 20.0 22.0 24.0 26.0 ROE '15E P/B 2015E BRI BCA Mandiri Danamon BNI BJBR BTPN BBTN ID 5 15 25 35 45 55 65 0.80 1.30 1.80 2.30 2.80 3.30 Mcap / Assets 2015E (%) ROA '15E Source: Company data, Credit Suisse estimates Source: Company data, Credit Suisse estimates
  • 33. 10 April 2015 Indonesia Banks Sector 33 Companies Mentioned (Price as of 10-Apr-2015) PT Bank Central Asia Tbk (BBCA.JK, Rp15,075, UNDERPERFORM, TP Rp13,600) PT Bank Danamon Indonesia Tbk (BDMN.JK, Rp5,075, UNDERPERFORM, TP Rp4,100) PT Bank Mandiri (Persero) Tbk (BMRI.JK, Rp12,000, OUTPERFORM, TP Rp13,700) PT Bank Negara Indonesia (Persero) Tbk (BBNI.JK, Rp7,175, NEUTRAL, TP Rp7,550) PT Bank Pembangunan Daerah Jawa Barat dan Banten T (BJBR.JK, Rp885, OUTPERFORM, TP Rp1,150) PT Bank Rakyat Indonesia (Persero) Tbk (BBRI.JK, Rp13,075, NEUTRAL, TP Rp14,000) PT Bank Tabungan Negara Persero Tbk (BBTN.JK, Rp1,175, NEUTRAL[V], TP Rp1,100) PT Bank Tabungan Pensiunan Nasional Tbk (BTPN.JK, Rp4,095, OUTPERFORM, TP Rp5,050) Disclosure Appendix Important Global Disclosures I, Sanjay Jain, certify that (1) the views expressed in this report accurately reflect my personal views about all of the subject companies and securities and (2) no part of my compensation was, is or will be directly or indirectly related to the specific recommendations or views expressed in this report. 3-Year Price and Rating History for PT Bank Central Asia Tbk (BBCA.JK) BBCA.JK Closing Price Target Price Date (Rp) (Rp) Rating 30-Jul-12 7,950 10,000 O 06-Aug-12 7,700 R 09-Aug-12 8,000 10,000 O 29-Oct-12 8,100 11,000 28-Mar-13 11,400 11,000 N 16-Sep-13 10,050 10,000 30-Oct-13 10,700 10,600 10-Feb-14 10,050 * 10-Mar-14 10,500 11,800 N 15-Apr-14 11,100 11,700 14-Oct-14 12,625 11,600 U 17-Nov-14 12,900 11,500 * Asterisk signifies initiation or assumption of coverage. O UT PERFO RM REST RICT ED N EUT RAL UN D ERPERFO RM 3-Year Price and Rating History for PT Bank Danamon Indonesia Tbk (BDMN.JK) BDMN.JK Closing Price Target Price Date (Rp) (Rp) Rating 08-Jul-12 6,100 R 16-Sep-13 4,100 3,600 U 19-Nov-13 3,850 3,000 10-Feb-14 4,470 * 10-Mar-14 4,175 3,500 U 15-Apr-14 4,550 3,700 14-Oct-14 3,900 3,400 17-Nov-14 4,215 3,050 * Asterisk signifies initiation or assumption of coverage. REST RICT ED UN D ERPERFO RM
  • 34. 10 April 2015 Indonesia Banks Sector 34 3-Year Price and Rating History for PT Bank Mandiri (Persero) Tbk (BMRI.JK) BMRI.JK Closing Price Target Price Date (Rp) (Rp) Rating 25-Apr-12 7,000 8,800 O 30-Jul-12 7,850 9,500 29-Oct-12 8,200 11,000 25-Feb-13 9,750 12,150 29-Apr-13 10,600 12,750 16-Sep-13 8,950 9,800 30-Oct-13 8,750 10,500 10-Feb-14 8,750 * 11-Feb-14 8,950 10,500 O 10-Mar-14 9,200 11,700 15-Apr-14 9,750 11,400 14-Oct-14 9,450 11,100 17-Nov-14 10,475 11,800 * Asterisk signifies initiation or assumption of coverage. O UT PERFO RM 3-Year Price and Rating History for PT Bank Negara Indonesia (Persero) Tbk (BBNI.JK) BBNI.JK Closing Price Target Price Date (Rp) (Rp) Rating 29-May-12 3,675 4,500 O 31-Jul-12 3,975 4,700 23-Oct-12 3,900 5,000 01-Mar-13 4,850 5,790 29-Apr-13 5,300 6,300 16-Sep-13 4,400 4,275 N 21-Oct-13 4,650 4,700 10-Feb-14 4,280 * 10-Mar-14 4,840 5,100 N 15-Apr-14 4,995 5,000 14-Oct-14 5,275 5,550 17-Nov-14 5,825 6,000 * Asterisk signifies initiation or assumption of coverage. O UT PERFO RM N EUT RAL 3-Year Price and Rating History for PT Bank Pembangunan Daerah Jawa Barat dan Banten T (BJBR.JK) BJBR.JK Closing Price Target Price Date (Rp) (Rp) Rating 30-Jul-12 940 1,200 O 25-Oct-12 1,120 1,420 26-Mar-13 1,280 1,350 N 16-Sep-13 920 975 10-Feb-14 935 * 31-Mar-14 1,045 1,050 N 15-Apr-14 1,140 1,100 14-Oct-14 745 800 * Asterisk signifies initiation or assumption of coverage. O UT PERFO RM N EUT RAL
  • 35. 10 April 2015 Indonesia Banks Sector 35 3-Year Price and Rating History for PT Bank Rakyat Indonesia (Persero) Tbk (BBRI.JK) BBRI.JK Closing Price Target Price Date (Rp) (Rp) Rating 14-Aug-12 7,100 8,700 O 31-Oct-12 7,400 9,100 01-Feb-13 8,000 9,000 N 16-Sep-13 8,200 10,000 O 24-Oct-13 8,350 10,250 10-Feb-14 8,700 * 17-Feb-14 8,950 10,250 O 10-Mar-14 9,075 11,900 15-Apr-14 9,850 11,500 14-Oct-14 10,100 11,100 N 17-Nov-14 11,075 11,500 * Asterisk signifies initiation or assumption of coverage. O UT PERFO RM N EUT RAL 3-Year Price and Rating History for PT Bank Tabungan Negara Persero Tbk (BBTN.JK) BBTN.JK Closing Price Target Price Date (Rp) (Rp) Rating 25-Apr-12 1,332 1,246 N 04-Oct-12 1,342 R 13-Dec-12 1,580 1,300 N 14-Dec-12 1,580 1,600 28-Feb-13 1,630 1,700 16-Sep-13 1,010 900 U 29-Oct-13 950 880 10-Mar-14 1,165 1,200 N * 03-Jul-14 1,050 1,100 14-Oct-14 1,100 1,050 17-Nov-14 1,115 950 * Asterisk signifies initiation or assumption of coverage. N EUT RAL REST RICT ED UN D ERPERFO RM 3-Year Price and Rating History for PT Bank Tabungan Pensiunan Nasional Tbk (BTPN.JK) BTPN.JK Closing Price Target Price Date (Rp) (Rp) Rating 25-Apr-12 3,550 4,000 N 19-Jul-12 4,200 4,700 22-Oct-12 5,100 5,800 20-Feb-13 4,900 6,000 O 16-Sep-13 4,050 4,350 N 10-Feb-14 4,500 * 10-Mar-14 4,310 3,800 U 14-Oct-14 4,400 3,850 17-Nov-14 4,150 3,950 * Asterisk signifies initiation or assumption of coverage. N EUT RAL O UT PERFO RM UN D ERPERFO RM The analyst(s) responsible for preparing this research report received Compensation that is based upon various factors including Credit Suisse's total revenues, a portion of which are generated by Credit Suisse's investment banking activities As of December 10, 2012 Analysts’ stock rating are defined as follows: Outperform (O) : The stock’s total return is expected to outperform the relevant benchmark*over the next 12 months. Neutral (N) : The stock’s total return is expected to be in line with the relevant benchmark* over the next 12 months. Underperform (U) : The stock’s total return is expected to underperform the relevant benchmark* over the next 12 months.
  • 36. 10 April 2015 Indonesia Banks Sector 36 *Relevant benchmark by region: As of 10th December 2012, Japanese ratings are based on a stock’s total return relative to the analyst's coverage universe which consists of all companies covered by the analyst within the relevant sector, with Outperforms representing the most attractive, Neutrals the less attrac tive, and Underperforms the least attractive investment opportunities. As of 2nd October 2012, U.S. and Canadian as well as Europea n ratings are based on a stock’s total return relative to the analyst's coverage universe which consists of all companies covered by the analyst within the relevant sector, with Outperforms representing the most attractive, Neutrals the less attractive, and Underperforms the least attractive investment opportunities. For Latin American and non-Japan Asia stocks, ratings are based on a stock’s total return relative to the average total return of the relevant country or regional benchmark; prior to 2nd October 2012 U.S. and Canadian ratings were based on (1) a stock’s absolute total return potential to its current share price and (2) the relative attractiveness of a stock’s total return potential within an analyst’s coverage universe. For Australian and New Zealand stocks, 12-month rolling yield is incorporated in the absolute total return calculation and a 15% and a 7.5% threshold replace the 10-15% level in the Outperform and Underperform stock rating definitions, respectively. The 15% and 7.5% thresholds replace the +10- 15% and -10-15% levels in the Neutral stock rating definition, respectively. Prior to 10th December 2012, Japanese ratings were based on a stock’s total return relative to the average total return of the relevant country or regional benchmark. Restricted (R) : In certain circumstances, Credit Suisse policy and/or applicable law and regulations preclude certain types of communications, including an investment recommendation, during the course of Credit Suisse's engagement in an investment banking transaction and in certain other circumstances. Volatility Indicator [V] : A stock is defined as volatile if the stock price has moved up or down by 20% or more in a month in at least 8 of the past 24 months or the analyst expects significant volatility going forward. Analysts’ sector weightings are distinct from analysts’ stock ratings and are based on the analyst’s expectations for the fundamentals and/or valuation of the sector* relative to the group’s historic fundamentals and/or valuation: Overweight : The analyst’s expectation for the sector’s fundamentals and/or valuation is favorable over the next 12 months. Market Weight : The analyst’s expectation for the sector’s fundamentals and/or valuation is neutral over the next 12 months. Underweight : The analyst’s expectation for the sector’s fundamentals and/or valuation is cautious over the next 12 months. *An analyst’s coverage sector consists of all companies covered by the analyst within the relevant sector. An analyst may cov er multiple sectors. Credit Suisse's distribution of stock ratings (and banking clients) is: Global Ratings Distribution Rating Versus universe (%) Of which banking clients (%) Outperform/Buy* 44% (53% banking clients) Neutral/Hold* 38% (51% banking clients) Underperform/Sell* 16% (43% banking clients) Restricted 3% *For purposes of the NYSE and NASD ratings distribution disclosure requirements, our stock ratings of Outperform, Neutral, an d Underperform most closely correspond to Buy, Hold, and Sell, respectively; however, the meanings are not the same, as our stock ratings are determined on a relative basis. (Please refer to definitions above.) An investor's decision to buy or sell a security should be based on investment objectives, current holdin gs, and other individual factors. Credit Suisse’s policy is to update research reports as it deems appropriate, based on developments with the subject company, the sector or the market that may have a material impact on the research views or opinions stated herein. Credit Suisse's policy is only to publish investment research that is impartial, independent, clear, fair and not misleading. For more detail please refer to Credit Suisse's Policies for Managing Conflicts of Interest in connection with Investment Research: http://www.csfb.com/research-and- analytics/disclaimer/managing_conflicts_disclaimer.html Credit Suisse does not provide any tax advice. Any statement herein regarding any US federal tax is not intended or written to be used, and cannot be used, by any taxpayer for the purposes of avoiding any penalties. Price Target: (12 months) for PT Bank Central Asia Tbk (BBCA.JK) Method: Our target price for BBCA of Rp13,600/share is derived based on Gordon's growth assuming sustainable return on equity (ROE) of 18- 21%, beta of 0.8-0.9x, risk free rate of 8.5% and market risk premium of 5.0%. Our target price for BBCA implies 3.8x 2015E P/B and 18.8x 2015E P/E. Risk: Risks to our estimates and target price of Rp13,600/share for BBCA include: (1) longer-than-anticipated tight liquidity conditions in Indonesia as well as a faster-than-expected recovery of the currently tight liquidity conditions; (2) significant changes in global sentiment; (3) significant changes in the public's confidence in the bank; (4) risks relating to Indonesia, including macroeconomic, political and social risks; (5) risks of major changes in the bank's current management team; and (6) currency risks. Price Target: (12 months) for PT Bank Negara Indonesia (Persero) Tbk (BBNI.JK) Method: Our target price of Rp7,550/share for BBNI is derived based on Gordon's growth model, assuming normalized return of equity (ROE) of 18-19%, beta of 1.0x, risk-free rate of 8.5% and market risk premium of 5.0%, implying 2.5x 2015E price-to-book ratio (P/B) and 11.5x 2014E price-to-earnings ratio (P/E).
  • 37. 10 April 2015 Indonesia Banks Sector 37 Risk: Risks to our estimates and target price of Rp7,550/share for BBNI include: (1) longer-than-anticipated tight liquidity conditions in Indonesia as well as faster-than-expected recovery of the currently tight liquidity conditions; (2) significant changes in global sentiment; (3) significant changes in the public's confidence in the bank; (4) risks relating to Indonesia, including macroeconomic, political and social risks; (5) risks of major changes in the bank's current management team; and (6) currency risks. Price Target: (12 months) for PT Bank Rakyat Indonesia (Persero) Tbk (BBRI.JK) Method: Our target price of Rp14,000/share for BBRI is derived based on Gordon's growth model, assuming normalized return of equity (ROE) of 22-24%, beta of 1.1-1.2x, risk-free rate of 8.5% and market risk premium of 5.0%, implying a 3.1x 2014E price-to-book ratio (P/B) and 14.3x 2014E price-to-earnings ratio (P/E). Risk: Risks to our estimates and target price of Rp14,000/share for BBRI include: (1) longer-than-anticipated tight liquidity conditions in Indonesia as well as faster-than-expected recovery of the currently tight liquidity conditions; (2) significant changes in global sentiment; (3) significant changes in the public's confidence in the bank; (4) risks relating to Indonesia, including macroeconomic, political and social risks; (5) risks of major changes in the bank's current management team; and (6) currency risks. Price Target: (12 months) for PT Bank Tabungan Negara Persero Tbk (BBTN.JK) Method: Our target price of Rp1,100/share for BBTN is derived based on Gordon's growth model, a normalised return of equity (ROE) of 12.0- 13.0%, beta of 1.1-1.2x, a risk-free rate of 8.5% and market risk premium of 5.0%, implying 1.0x 2015E price-to-book ratio (P/B) and 7.2x 2015E price-to-earnings ratio (P/E). Risk: Risks to our estimates and target price of Rp1,100/share for BBTN include: (1) an earlier-than-expected pick-up in competition for funding; (2) irrational competition from new entrants to the mortgage sector; and (3) Indonesia's sovereign and political risks. Price Target: (12 months) for PT Bank Danamon Indonesia Tbk (BDMN.JK) Method: Our target price of Rp4,100/share for BDMN is derived based on Gordon's growth model, assuming a sustainable return of equity (ROE) of 10-11, beta of 1.1-1.2x, risk-free rate of 8.5% and market risk premium of 5.0%, implying 1.4x 2015E price-to-book ratio (P/B) and 8.8x 2015E price-to-earnings ratio (P/E). Risk: Risks to our estimates and target price of Rp4,100/share for Bank Danamon include: (1) challanges in tight liquidity conditions to sustain longer than our initial expectation; (2) significant changes in global sentiment; (3) unexpected deterioration in public's confidence in Indonesian banks; (4) risks relating to Indonesia including macroeconomics, geopolitics and social risks; (5) risks relating to changes in the management team; (6) currency risks; and (7) lower-than-expected expansion on micro segments. Price Target: (12 months) for PT Bank Pembangunan Daerah Jawa Barat dan Banten T (BJBR.JK) Method: Our target price of Rp1,150/share for BJBR is derived based on Gordon's growth model, assuming: a normalized Return on Equity (ROE) of 17-18%, beta of 1.3x, risk free rate of 8.5% and market risk premium of 5.0%, implying 8.3x 15E Price to Earning Ratio (P/E) and 1.5x 15E Price to Book Ratio (P/B). Risk: Risks to our estimates and target price of Rp1,150/share for BJBR include: (1) longer-than- anticipated tight liquidity conditions in Indonesia as well as a faster-than-expected recovery of the currently tight liquidity conditions; (2) significant changes in global sentiment; (3) significant changes in public's confidence in the bank; (4) risks relating to Indonesia, including macroeconomic, political and social risks; and (5) currency risks Price Target: (12 months) for PT Bank Mandiri (Persero) Tbk (BMRI.JK) Method: Our target price of Rp13,700/share for BMRI is derived based on Gordon's growth model, assuming: (1) a sustainable return of equity (ROE) of 19-20%; (2) a beta of 0.9x; and (3) cost of equity of 13.0%, implying 14.6x 2015E price to earnings ratio (P/E) and 2.7x 2015E price to book ratio (P/B). Risk: Risks to our estimates and target price of Rp13,700/share for BMRI include: (1) longer-than-anticipated tight liquidity conditions in Indonesia as well as faster-than-expected recovery of the currently tight liquidity conditions; (2) significant changes in global sentiment; (3) significant changes in the public's confidence in the bank; (4) risks relating to Indonesia, including macroeconomic, political and social risks; (5) risks of major changes in the bank's current management team; and (6) currency risks. Price Target: (12 months) for PT Bank Tabungan Pensiunan Nasional Tbk (BTPN.JK) Method: Our target price of Rp5,050/share for BTPN is derived based on Gordon's growth model, assuming a normalised return of equity (ROE) of 18%, beta of 1.3x, risk-free rate of 8.5% and market risk premium of 5.0%, implying 2.5x 2015E price-to-book ratio (P/B) and 11.0x 2015E price-to-earnings ratio (P/E). Risk: Risks to our estimates and target price of Rp5,050/share for BTPN include: (1) challenges in tight liquidity conditions sustaining longer than our initial expectation; (2) significant changes in global sentiment; (3) an unexpected deterioration in the public's confidence in
  • 38. 10 April 2015 Indonesia Banks Sector 38 Indonesian banks; (4) risks relating to Indonesia including macroeconomics, geopolitics and social risks; (5) risks relating to changes in the management team; (6) currency risks; and (7) a slower-than-expected expansion in micro segments. Please refer to the firm's disclosure website at https://rave.credit-suisse.com/disclosures for the definitions of abbreviations typically used in the target price method and risk sections. See the Companies Mentioned section for full company names The subject company (BBCA.JK, BBNI.JK, BBRI.JK, BDMN.JK, BMRI.JK, BTPN.JK) currently is, or was during the 12-month period preceding the date of distribution of this report, a client of Credit Suisse. Credit Suisse provided investment banking services to the subject company (BBNI.JK, BBRI.JK, BMRI.JK, BTPN.JK) within the past 12 months. Credit Suisse has managed or co-managed a public offering of securities for the subject company (BBRI.JK, BMRI.JK) within the past 12 months. Credit Suisse has received investment banking related compensation from the subject company (BBNI.JK, BBRI.JK, BMRI.JK, BTPN.JK) within the past 12 months Credit Suisse expects to receive or intends to seek investment banking related compensation from the subject company (BBCA.JK, BBNI.JK, BBRI.JK, BDMN.JK, BMRI.JK, BTPN.JK) within the next 3 months. Credit Suisse may have interest in (BBCA.JK, BBNI.JK, BBRI.JK, BBTN.JK, BDMN.JK, BJBR.JK, BMRI.JK, BTPN.JK) Credit Suisse has a material conflict of interest with the subject company (BDMN.JK) . Credit Suisse is one of the joint financial advisors to DBS Group Holdings Limited in relation to the proposed acquisition of PT Bank Danamon Indonesia Tbk. Important Regional Disclosures Singapore recipients should contact Credit Suisse AG, Singapore Branch for any matters arising from this research report. The analyst(s) involved in the preparation of this report have not visited the material operations of the subject company (BBCA.JK, BBNI.JK, BBRI.JK, BBTN.JK, BDMN.JK, BJBR.JK, BMRI.JK, BTPN.JK) within the past 12 months Restrictions on certain Canadian securities are indicated by the following abbreviations: NVS--Non-Voting shares; RVS--Restricted Voting Shares; SVS--Subordinate Voting Shares. Individuals receiving this report from a Canadian investment dealer that is not affiliated with Credit Suisse should be advised that this report may not contain regulatory disclosures the non-affiliated Canadian investment dealer would be required to make if this were its own report. For Credit Suisse Securities (Canada), Inc.'s policies and procedures regarding the dissemination of equity research, please visit http://www.csfb.com/legal_terms/canada_research_policy.shtml. Credit Suisse has acted as lead manager or syndicate member in a public offering of securities for the subject company (BBCA.JK, BBNI.JK, BBRI.JK, BBTN.JK, BDMN.JK, BMRI.JK, BTPN.JK) within the past 3 years. As of the date of this report, Credit Suisse acts as a market maker or liquidity provider in the equities securities that are the subject of this report. Principal is not guaranteed in the case of equities because equity prices are variable. Commission is the commission rate or the amount agreed with a customer when setting up an account or at any time after that. To the extent this is a report authored in whole or in part by a non-U.S. analyst and is made available in the U.S., the following are important disclosures regarding any non-U.S. analyst contributors: The non-U.S. research analysts listed below (if any) are not registered/qualified as research analysts with FINRA. The non-U.S. research analysts listed below may not be associated persons of CSSU and therefore may not be subject to the NASD Rule 2711 and NYSE Rule 472 restrictions on communications with a subject company, public appearances and trading securities held by a research analyst account. Credit Suisse AG, Singapore Branch..................................................................................................................................................... Sanjay Jain For Credit Suisse disclosure information on other companies mentioned in this report, please visit the website at https://rave.credit- suisse.com/disclosures or call +1 (877) 291-2683.