21scheme vtu syllabus of visveraya technological university
april_2020.pdf
1. METHODOLOGIES AND APPLICATION
Lightning attachment procedure optimization algorithm for nonlinear
non-convex short-term hydrothermal generation scheduling
Maha Mohamed1 • Abdel-Raheem Youssef1 • Salah Kamel2,4 • Mohamed Ebeed3
Published online: 17 April 2020
Springer-Verlag GmbH Germany, part of Springer Nature 2020
Abstract
Short-term hydrothermal scheduling (STHS) is considered an important problem in the field of power system economics.
The solution of this problem gives the hourly output of power generation schedule of the available hydro and thermal
power units, which leads to minimization of the total fuel cost of thermal units for a given period of a time. The optimal
generation of STHS is considered as a complicated and nonlinear optimization problem with a set of equality and
inequality constraints such as the valve point loading effect of thermal units, the power transmission loss and the load
balance. This paper proposes lightning attachment procedure Optimization (LAPO) algorithm for solving the nonlinear
non-convex STHS optimization problem in order to minimize the operating fuel cost of thermal units with satisfying the
operating constraints of the system. The performance of LAPO algorithm is validated using three different test systems
considering the valve point loading effects of thermal units and the power transmission losses. The obtained results prove
the effectiveness and superiority of LAPO algorithm for solving the STHS problem compared with other well-known
optimization techniques.
Keywords Short-term hydrothermal scheduling Non-convex optimization problem Lightning attachment procedure
optimization Valve point loading effect
List of symbols
F Total fuel cost from all thermal plants
Ns Total number of thermal plants
T Total time of whole scheduling period
ai; bi; ci Power generation coefficients of thermal
plant
Pt
si Output power generation from thermal plant
di; ei Coefficients of the valve point effects of the
thermal plant
Pmin
si
Lower power generation limit of thermal
plant
Vt
hj Reservoir storage volume of hydropower
plant jth at a period of time t
It
hj External inflow to reservoir jth at a period of
time t
Qt
hj Water discharge amount of hydropower plant
j at a period of time t
S Spillage discharge rate of reservoir jth at
time interval t
Ruj Number of upstream hydropower plant
Nh Number of hydropower plant
Pt
D Power demand at a period of time t
Communicated by V. Loia.
Salah Kamel
skamel@aswu.edu.eg
Maha Mohamed
mahamohamed21@yahoo.com
Abdel-Raheem Youssef
abou_radwan@hotmail.com
Mohamed Ebeed
mohamedebeed11@gmail.com
1
Department of Electrical Engineering, Faculty of
Engineering, South Valley University, Qena, Egypt
2
Department of Electrical Engineering, Faculty of
Engineering, Aswan University, Aswân 81542, Egypt
3
Department of Electrical Engineering, Faculty of
Engineering, Sohag University, Sohâg, Egypt
4
State Key Laboratory of Power Transmission Equipment and
System Security and New Technology, Chongqing
University, Chongqing, China
123
Soft Computing (2020) 24:16225–16248
https://doi.org/10.1007/s00500-020-04936-2(0123456789().,-volV)
(0123456789().
,- volV)
2. Pt
hj Power generation of hydropower plant j at a
period of time t
Pt
L Power transmission loss of the system at a
period of time t
Vmin
hj
Minimum storage volume of hydro plant j
Vmax
hj Maximum storage volume of hydro plant j
Qmin
hj
Minimum water discharge of hydro plant j
QMax
hj Maximum water discharge of hydro plant j
Pmin
hj ; Pmax
hj
Minimum and maximum power generation
of hydro plant j
Pmin
si ; Pmax
si
Minimum and maximum power generation
of thermal plant i
Vbegin
hj ; Vend
hj
Initial and final reservoir storage volumes of
hydropower plant j
VT
hj Reservoir storage of hydro plant j at a period
of time from (0 to 24)
Abbreviations
STHS Short-term hydrothermal scheduling
LAPO Lightning attachment procedure
optimization
VPL Valve point loading
LP Linear programming
NLP Nonlinear programming
DP Dynamic programming
GS Gradient search
GA Genetic algorithm
EP Evolutionary programming
DE Differential evolution
PSO Particle swarm optimization
IPSO Improved particle swarm optimization
MAPSO Modified adaptive PSO
SSPSO Small population-based particle swarm
optimization
ABC Artificial bee colony
LR Lagrange relaxation
IDE Improved differential evolution
FAPSO Fuzzy adaptive particle swarm
optimization
RCGA Real-coded genetic algorithm
HIS Improved harmony search
RCGA-IMM Real-coded genetic algorithm based on
improved Mühlenbein mutation
CPSO Couple-based particle swarm optimization
TLBO Teaching learning-based optimization
ACABC Adaptive chaotic artificial bee colony
MDNLPSO Modified dynamic neighborhood learning-
based particle swarm optimization
RCGA–
AFSA
Hybrid of real-coded genetic algorithm and
artificial fish swarm algorithm
ORCCRO Oppositional real-coded chemical reaction
based optimization
DRQEA Differential real-coded quantum-inspired
evolutionary algorithm
MHDE Modified hybrid differential evolution
ACDE Adaptive chaotic differential evolution
ALO Ant lion optimization
1 Introduction
The optimal power generation of short-term hydrothermal
scheduling (STHS) has a great importance in the electric grid
systems. The main objective of STHS problem is to minimize
the total operation fuel cost of the thermal units through
determining the optimal power generation of hydro and
thermal units in each scheduling interval, while satisfying the
various equality and inequality constraints on the hydraulic
power plants and the power system network. The STHS is
considering a complicated problem, which includes the dif-
ferent equality and inequality constraints. The equality con-
straints include power balance, water storage balance, and
initial and terminal reservoir storage volumes. Also, the
inequality constraints are limitations of hydrothermal power
generation, limitations of water storage volumes and limita-
tions of water discharge rate. These constraints with the valve
point loading effect (VPLE) make the STHS problem a
nonlinear, non-convex and complicated constrained opti-
mization problem. Several optimization techniques have been
presented for solving the STHS problem. Firstly, analytical
optimization techniques have been implemented for obtaining
the optimal solution of hydrothermal scheduling problem
such as linear programming (LP) (Chang et al. 2001; Wu
et al. 2009), nonlinear programming (NLP) (Catalão et al.
2011), dynamic programming (DP) (Homem-de-Mello et al.
2011), gradient search (GS) (Wood and Wollenberg 2003),
Newton’s method (Zaghlool and Trutt 1988) and Lagrange
relaxation (LR) (Dieu and Ongsakul 2009). Linear program-
ming (LP) is applied to the problems which has linear
objective function and constraints, but the STHS problem is a
difficult and nonlinear optimization problem; therefore, this
will lead to errors in the result of the scheduling problem. The
NLP method requires large memory to reach the ideal solu-
tion of the nonlinear optimization problem and has slow
convergence. The DP is a popular method for overcoming the
difficulty of nonlinearity and non-convexity of the STHS
problem. However, the DP method suffers from the curse of
dimensionality when the size of the system increases and this
will lead to large memory storage and long computational
time. To overcome the handling constraints, the LR is more
accurate. However, the main drawback in LR is the
16226 M. Mohamed et al.
123
3. oscillation of solutions. The main shortage of these methods is
that they may stuck in local optima and suffer from
stagnation.
In order to overcome the drawbacks of analytical opti-
mization techniques, heuristic algorithms have been
implemented to solve the non-convex nonlinear STHS
problem such as genetic algorithm (GA) (Nazari-Heris
et al. 2017a; Haghrah et al. 2014), evolutionary program-
ming (EP) (Hota et al. 1999; Türkay et al. 2011), differ-
ential evolution (DE) (Malik et al. 2016), particle swarm
optimization (PSO) (Ramesh 2016; Mahor and Rangnekar
2012), improved particle swarm optimization (IPSO) (Hota
et al. 2009), modified adaptive PSO (MAPSO) and small
population-based particle swarm optimization (SSPSO)
(Amjady and Soleymanpour 2010), artificial bee colony
(ABC) (Liao et al. 2013; Zhou et al. 2014).
In Nazari-Heris et al. (2017a), the authors improved the GA
for finding the ideal solution of the STHS optimizationproblem
with considering the valve point loading effect of the thermal
power units and the power transmission losses. The real-coded
genetic algorithm with random transfer vectors-based mutation
(RCGA-RTVM) has been presented in Haghrah et al. (2014),
and the authorsrepresented with an innovatedmutation method
utilizing genetic algorithm (GA) to solve the nonlinear non-
convexSTHSproblem.InHotaetal.(1999;Türkayetal.2011),
the authors proposed the EP optimization algorithm to find the
optimal power generation scheduling for thermal and hydro
plants.InMaliketal.(2016),theauthorspresentedanimproved
hybrid approach based on the chaos theory in the differential
evolution (DE) algorithm for solving the STHS problem to
minimize the emission of the thermal units. The improved PSO
technique for solving the STHS problem has been presented in
Ramesh (2016), Mahor and Rangnekar (2012) and Hota et al.
(2009). The modified adaptive particle swarm optimization
(MAPSO) for determining the optimal thermal and hydro
power generation is presented in Hota et al. (x2010). To solve
the STHS problem, an adaptive chaotic artificial bee colony
(ACABC) algorithm has been considered in Liao et al. (2013).
In Zhou et al. (2014), the authors have been studied a multi-
objective artificial bee colony (MOABC) algorithm for solving
the nonlinear STHS optimization algorithm. Predator–prey-
based optimization (PPO) technique to obtain optimal genera-
tion scheduling of short-term hydrothermal system has been
offered in Narang et al. (2014). Table 1 shows the different
definitions of test systems uses for solving the STHS problems.
Moreover, literature reviews articles related to solve the STHS
optimization algorithm are summarized by Table 2.
Lightning attachment procedure optimization (LAPO) is
a new physical-based algorithm presented by Nematollahi
et al. (2017, 2019). LAPO is conceptualized from Light-
ning occurrence steps. The simulated steps of the LAPO
include trail spots, leader upward motion, section fading,
downward leader motion and the final strike point of
lightning which mimics the optimal solution.
In this paper, the authors present a new application of
lightning attachment procedure Optimization (LAPO)
technique to find the hourly optimal power generation of
thermal units and hydro power units for minimizing the
total fuel cost. The effect of valve point loading and the
power transmission loss are taken into consideration for
finding the optimal solution of the STHS optimization
problem. To evaluate the performance of proposed algo-
rithm, it is applied on three test systems including four
hydro power plants with single equivalent thermal units
and four hydro plants with three thermal units and four
hydro plants with ten thermal units.
The rest of paper is organized as follows. The formu-
lation of STHS problem is presented in Sect. 2. Section 3
presents the overview of proposed algorithm. The simula-
tion results in different studied cases are presented in
Sect. 4. Finally, the conclusion is presented in Sect. 5.
2 Problem formulation of hydrothermal
system
The STHS problem aims to minimize the total fuel cost of
thermal plants by use the hydropower as much as possible
and with negligible cost of the hydro power generation
units. The scheduling generation of hydro and thermal units
is provided during STHS process for a given period of time
for meeting the load demand and satisfying the all equality
and inequality constraints. The objective function and the
different constraints of the STHS problem are formulated
as follows.
2.1 Objective function
The objective function of total fuel cost of thermal units,
which is expressed as quadratic and a sinusoidal function
(Nazari-Heris et al. 2017b), can be represented as follows:
Table 1 Definition of test
systems studied for the solution
of STHS problem
Test system Number of hydrothermal generation units
Test system 1 One equivalent thermal unit and four cascaded hydro units
Test system 2 Four cascaded hydro power plants and three thermal plants
Test system 3 Four cascaded hydro power plants and ten thermal plants
Lightning attachment procedure optimization algorithm for nonlinear non-convex short-term… 16227
123
4. F ¼ min
X
T
t¼1
X
Ns
i¼1
ai þ biPt
si þ ci Pt
si
2
ð1Þ
where F is the total power generation fuel cost from all
thermal units at a time t, Ns is the total number of thermal
units, T is the total time of whole scheduling period, ai,bi,ci
are the power generation coefficients of thermal unit,Pt
si is
the output power generation from thermal unit of the ith
thermal plant at period t, respectively. The fuel cost
function of the ith thermal plant, and it is usually
Table 2 Objective functions and main contribution of researches in the area of STHS problem solution
Reference Method Year Test system Main consideration
Nazari-Heris et al. (2018) IHS 2018 Test system 1,
Test system
2
The cost of thermal units is commonly studied as a quadratic function,
valve point loading effect, transmission losses
Chang (2010) FAPSO 2010 Test system 1 The cost of thermal units is commonly studied as a quadratic function
Basu (2014b) Improved DE 2014 Test system 1,
Test system
2
Prohibited discharge zones (PDZs) of water reservoir of the hydro
units and valve point loading effect, ramp rate limits of thermal
generators, transmission losses
Mandal and Chakraborty
(2011)
SOHPSO_TVAC 2011 Test system 1 Economic emission, the cost of thermal units is commonly studied as
a quadratic function
Wu et al. (2019) CPSO 2019 Test system 1,
Test system
2
The cost of thermal units is commonly studied as a quadratic function,
valve point loading effect, prohibited discharge zones (PDZs) of
hydro units
Rasoulzadeh-Akhijahani
and Mohammadi-Ivatloo
(2015)
MDNLPSO 2015 Test system 1,
Test system
2
Prohibited discharge zones (PDZs) of water reservoir of the hydro
units and Valve point loading effect, transmission losses
Zhang et al. (2012) SPPSO 2012 Test system 1,
Test system
2
Valve point loading effect, transmission losses
Fang et al. (2014) RCGA–AFSA 2014 Test system 1,
Test system
2
Valve point loading effect, transmission losses, prohibited discharge
zones (PDZs) and ramp rate limits
Roy (2013) TLBO 2013 Test system 1,
Test system
2
Prohibited discharge zones (PDZs) of water reservoir of the hydro
units and Valve point loading effect
Roy (2014) HCRO-DE 2014 Test system 1 Valve point loading effect, emission of thermal units
Lu et al. (2010) MHDE 2010 Test system 1 Valve point loading effect, transmission losses
Kang et al. (2017) TLPSOS 2017 Test system 2 Valve point loading effect
Dubey et al. (2016) ALO 2016 Test system 2 Valve point loading effect, transmission losses
Bhattacharjee et al. (2014a) ORCCRO 2014 Test system 1,
Test system
2
Valve point loading effect
Zhang et al. (2015) MCDE 2015 Test system 2 Valve point loading effect, transmission losses
Bhattacharjee et al. (2014b) RCCRO 2014 Test system 2 Valve point loading effect, prohibited discharge zones (PDZs) of
hydro units and ramp rate limit
Gouthamkumar et al.
(2015)
DGSA 2015 Test system 2 Valve point loading effect
Swain et al. (2011) CSA 2011 Test system 2 Valve point loading effect
Lakshminarasimman and
Subramanian (2006)
MDE 2006 Test system 2 Valve point loading effect, prohibited discharge zones (PDZs) of
hydro units, emission of thermal units
Mandal et al. (2008) PSO 2008 Test system 2 Valve point loading effect
Roy et al. (2013) QTLBO 2013 Test system 2 Prohibited discharge zones (PDZs) of hydro units and valve point
loading effect
Mandal and Chakraborty
(2009)
DE 2009 Test system 2 Valve point loading effect, economic emission
Basu (2004a) EP 2004 Test system 2 Valve point loading effect
16228 M. Mohamed et al.
123
5. represented as follows with consideration of valve loading
point effect (Liao et al. 2013).
F ¼ min
X
T
t¼1
X
Ns
i¼1
ai þ biPt
si þ ci Pt
si
2
þ di sin ei Pmin
si Pt
si
n o
ð2Þ
where di and ei are the coefficients of the valve point
effects of the thermal unit i, Pmin
si is the lower power gen-
eration limit of thermal unit i.
2.2 Constraints
The objective function of STHS optimization problem is
subjected to the following equality and inequality con-
straints. The equality constraints include power balance,
water storage balance, and initial and terminal reservoir
storage volumes. Also, the inequality constraints are limi-
tations of hydrothermal power generation, limitations of
water storage volumes and limitations of water discharge
rate.
2.2.1 Water storage balance constraint
The reservoir storage of hydro plant is determined by
inflow and spillage, reservoir storage at previous period
and discharges from upstream reservoir. They must meet
the hydraulic continuity equations as follows (Wang et al.
2012).
Vt
hj ¼ Vt1
hj þ It
hj Qt
hj St
hj þ
X
Ruj
l¼1
Q
tdlj
hl þ S
tdlj
hl
jNh
tT:
ð3Þ
where Vt
hj is storage volume of hydropower plant jth at a
time t, It
hj is the external inflow rate to reservoir jth at time
t,Q
tdlj
hl is the water discharge rate from lth to jth reservoir
during the time delay dlj, dlj is the water transport delay
from lth to jth reservoir ; St
hj is the spillage discharge rate of
reservoir jth at time t, Ruj is the number of upstream
hydropower plants of jth reservoir.
2.2.2 Load demand balance constraint
Power generations of hydro and thermal power units must
meet the load demands of the hydrothermal including the
power transmission losses. Hence, load balance constraint
is expressed as follows:
X
Ns
i¼1
Pt
si þ
X
Nh
j¼1
Pt
hj Pt
L ¼ Pt
D tT ð4Þ
where Nh is the number of hydropower units, Pt
D represents
the power load demand at a period of time t,Pt
hj is the
power generation of hydropower unit j at a period of time t,
Pt
L is the transmission loss of the system at a period of time
t; Pt
hj is formulated as the following equation:
Pt
hj ¼ C1j Vt
hj
2
þC2j Qt
hj
2
þC3jVt
hjQt
hj þ C4jVt
hj þ C5jQt
hj
þ C6j jNh tT
ð5Þ
where Vt
hj,Qt
hj represent the storage volume and water
discharge amount of hydropower unit j at a period of time t,
C1j, C2j, C3j, C4j, C5j and C6j are the power generation
coefficients of hydropower unit j, respectively. The power
transmission loss Pt
L is expressed by the following
equation:
Pt
L ¼
X
NhþNs
i¼0
X
NhþNs
j¼0
Pt
iBijPt
j þ
X
NhþNs
i¼0
BoiPj
i þ Boo ð6Þ
where Bij; Boi and Boo are the power transmission loss
coefficients.
2.2.3 Reservoir storage volumes constraint
0Vmin
hj Vt
hj Vmax
hj ; jNh; tT: ð7Þ
where Vmin
hj ; Vmax
hj represent the minimum and maximum
storage volume limits of the jth hydro plant.
2.2.4 Water discharge constraint
0Qmin
hj Qt
hj Qmax
hj jNh; tT: ð8Þ
where Qmin
hj ; Qmax
hj represent the minimum and maximum
water discharge limits of the jth hydro plant.
2.2.5 Power generation constraint
Pmin
hj Pt
hj Pmax
hj jNh tT: ð9Þ
Pmin
si Pt
si Pmax
si jNs tT: ð10Þ
where Pmin
hj ; Pmax
hj are the minimum and maximum power
generation of the jth hydro plant, respectively and Pmin
si ;
Pmax
si are the minimum and maximum power generation of
the ith thermal plant, respectively.
The initial and terminal reservoir storage volumes:
Vend
hj ¼ VT
hj ð11Þ
VT
hj ¼ Vbegin
hj ð12Þ
Lightning attachment procedure optimization algorithm for nonlinear non-convex short-term… 16229
123
6. where Vbegin
hj ,Vend
hj are the initial and final reservoir storage
volumes of the jth hydro plant and VT
hj is the reservoir
storage of the jth hydro plant at a period of time from (0 to
24).
2.2.6 Handling constraints
It should be highlighted here that Michalewicz and Schoe-
nauer have presented a review survey for constraints handling
methods in optimization algorithms including preserving
feasibility method, penalty functions method, feasible and
infeasible solutions method and a hybrid method. In the pre-
sent, work the dependent systems have been considered using
the penalty functions method as follows:
Fg ¼ F þ KV
X
Nh
j¼1
DVhj
2
þKP
X
Nh
i¼1
DPhj
2
ð13Þ
where KV and KP represent the penalty factors for the water
discharge limits of the hydro plant and the power genera-
tion of the hydro plant, respectively. Fg is the augmented
objective function. DVhj and DQGi are given as follows:
DVhj ¼
Vt
hj Vmax
hj
Vt
hj [ Vmax
hj
Vmin
hj Vt
hj
Vt
hjVmin
hj
0 Vmin
hj Vt
hjVmax
hj
8
:
ð14Þ
DPhj ¼
Pt
hj Pmax
hj
Pt
hj [ Pmax
hj
Pmin
hj Pt
hj
Pt
hjPmin
hj
0 Pmin
hj Pt
hjPmax
hj
8
:
ð15Þ
3 Lighting attachment procedure
optimization (LAPO)
Lightning attachment procedure optimization (LAPO) is a
novel optimization technique conceptualized from Light-
ning phenomena where huge amounts of electric charges
are cumulated in the cloud. The distribution of these
charges in the cloud is depicted in Fig. 1. Lightning is
created with increasing the amount of charges in the cloud
which lead to increase the electrical strength consequently.
Lightning strike will occur, and it may emanate at several
points.
The procedure of lightning attachment includes four
steps which are: (1) breakdown of air at surface of cloud,
(2) lightning channel downward motion, (3) upward leader
extension and (4) final strike point.
As mentioned before, huge amounts of positive and
negative charges exist in the cloud where the highest
amount of the negative charges exist in the upper portion of
the cloud and the huge positive charges will be in the lower
portion of the cloud including also small amount of posi-
tive charges as depicted in Fig. 1. With increasing the
amount of the charges, the electrical potential will also
increase. Consequently, the breakdown between the char-
ges occurs. Moreover, the negative charges at the bottom of
the cloud increase more and potential gradient between the
cloud edge and the ground rises, leading to formation of the
lightning. The lightning starts from one or more points
from the cloud. The downward leaders of the lightning
move to the earth in a gradual motion due to the collapse
caused by air contact with the cloud surface and the leaders
do not continue in one direction as depicted in Fig. 1.
3.1 Mathematical presentation of LAPO
algorithm
Step 1 Trail spots.
The trial spots represent the initial points of the down-
ward leaders which can be found as follows:
Xi
ts ¼ Xi
min þ Xi
max Xi
min
rand ð16Þ
where Xi
ts denotes the initial trial spots. Xmin is the mini-
mum value of the control variable, while Xmax is its max-
imum value. rand is a random value in the range [0,1]. The
fitness function for the initial spots is calculated as:
Fi
ts ¼ obj Xi
ts
ð17Þ
Step 2 Determination of the next jump
All initial points are averaged, and fitness values are
calculated as follows:
Xavr ¼ mean Xts
ð Þ ð18Þ
Favr ¼ obj Xavr
ð Þ ð19Þ
Downward Leader
Upward Leader
+
+
+
+
+
+
+
+ +
+
+
+ +
+ + + +
+
+
+
+ +
+
+
+
- -
+
- -
- -
- -
-
-
- -
-
- +
-
- - - -
- -
- -
- -
-
- -
-
-
-
-
-
- - -
-
- - -
-
- -
-
-- -
-
-
-
-
-
-
-
-
+
+
+ +
+
+ +
+
-
Fig. 1 Charges form in the cloud
16230 M. Mohamed et al.
123
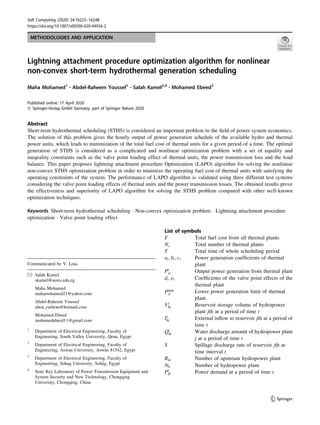
7. Fig. 2 Solution process of
STHS problem using proposed
algorithm
Lightning attachment procedure optimization algorithm for nonlinear non-convex short-term… 16231
123
8. Xavr is the averaged point, while Favr is the objective
function of the averaged point. As mentioned before, the
lightning has several tracks where the lightning is jumped
to the next high optional point. For updating the point i, a
random solution j is selected (potential point), so i = j.
Then the obtained solution is compared with the potential
solution. Hence, the next jump can be calculated as
follows:
Xi
ts new ¼ Xi
ts þ rand Xavr þ X j
PS
IF FjFavr ð20Þ
Xi
ts new ¼ Xi
ts rand Xavr þ X j
PS
IF Fj [ Favr ð21Þ
Step 3 Section fading
The branch will remain continuous if the critical value is
less than the electric field of the new test point; otherwise,
it will fade, which can be expressed as follows:
Xi
ts ¼ Xi
ts new IF Fi
ts newFi
ts ð22Þ
Xi
ts new ¼ Xi
ts otherwise ð23Þ
Test points are executed in this process, and all the
remaining points in the first stage are moving down.
Step 4 Leader upward motion
In this procedure, the points move up mimics the motion
of upward leader which is distributed exponentially along
the channel. Hence, an exponent operator can be repre-
sented as follows:
S ¼ 1
t
tmax
exp
t
tmax
ð24Þ
where t denotes the iteration number, while tmax is the
maximum number of iterations, and next jump depends on
the charge of the channel and the next point is given as
follows:
Xi
ts new ¼ Xi
ts new þ rand S Xi
best Xi
worst
ð25Þ
where Xi
best and Xi
worst are the best and the worse solutions
among the populations.
Step 5 Final strike point
The lightning operation pauses when the down leader
and the up leader gather each other and the striking point is
assigned.
The flowchart of the LAPO algorithm for obtaining the
optimal solution is shown in Fig. 2.
4 Simulation results and discussion
The effectiveness of the proposed LAPO algorithm is
validated using two hydrothermal test systems. The first
test system focuses on a multi-chain cascade of four hydro
units and one thermal power generating unit. There are two
case studies in this system. In case 1, the objective function
is smooth quadratic operation cost of thermal power gen-
eration as presented in Eq. (1). The valve point loading
effect of the thermal unit is considering in case (2) as given
1
I 2
I
3
I
4
I
1
Q 2
Q
3
Q
4
Q
Reservior 1 Reservior 2
Reservior 3
Reservior 4
Fig. 3 Scheme of the hydraulic network of the hydrothermal test
system
Table 3 Reservoir inflows of
hydropower plants for test
systems 1 and 2
Hour Reservoir Hour Reservoir Hour Reservoir
1 2 3 4 1 2 3 4 1 2 3 4
1 10 8 8.1 2.8 9 10 8 1 0 17 9 7 2 0
2 9 8 8.2 2.4 10 11 9 1 0 18 8 6 2 0
3 8 9 4 1.6 11 12 9 1 0 19 7 7 1 0
4 7 9 2 0 12 10 8 2 0 20 6 8 1 0
5 6 8 3 0 13 11 8 4 0 21 7 9 2 0
6 7 7 4 0 14 12 9 3 0 22 8 9 2 0
7 8 6 3 0 15 11 9 3 0 23 9 8 1 0
8 9 7 2 0 16 10 8 2 0 24 10 8 0 0
16232 M. Mohamed et al.
123
9. in Eq. (2). The second test system consists of four cascaded
hydro and three thermal generating units. In the second
system, two different case studies are considered. In the
first case study, the STHS problem is solved considering
the valve point loading effect without considering the
power transmission losses. In the second case study, the
STHS problem is solved considering the valve point
loading effect and the power transmission losses of the
system. The hydraulic network of these test systems is
shown in Fig. 3. The total period is 1 day that is divided
into 24 intervals. The coefficients of hydropower generat-
ing units, reservoir inflows, water discharge limits, initial
and terminal reservoir storage limits and hourly load
demands of power systems are given in Tables 3, 4, 5, 6, 7,
8 and 9. The cost coefficient of thermal and hydro gener-
ating units is adopted from Nazari-Heris et al. (2017a).
4.1 Test system 1
The first test system consists of four cascaded hydro units
and an equivalent thermal unit. In this system, the power
transmission losses are neglected for simplicity. To eval-
uate the performance of the LAPO, two different case
studies have been taken into account as follows;
Table 4 The coefficients of hydropower generation for test systems 1
and 2
Plant C1j C2j C3j C4j C5j C6j
1 - 0.0042 - 0.42 0.030 0.90 10.0 - 50
2 - 0.0040 - 0.30 0.015 1.14 9.5 - 70
3 - 0.0016 - 0.30 0.014 0.55 5.5 - 40
4 - 0.0030 - 0.31 0.027 1.44 14.0 - 90
Table 5 Hydro power generation unit characteristics
Plant Vmin
hj
Vmax
hj Vbegin
hj
Vend
hj Qmin
hj
Qmax
hj pmin
hi
pmax
hi
1 80 150 100 120 5 15 0 500
2 60 120 80 70 6 15 0 500
3 100 240 170 170 10 30 0 500
4 70 160 120 140 6 25 0 500
Table 6 The coefficients of thermal units power generation for test
system 1
Plant ai bi ci di ei pmin
si
pmax
si
1 0.002 19.2 5000 700 0.085 500 2500
Table 7 Load demands of hydrothermal system for test system 1
Hour Load Hour Load Hour Load Hour Load
1 1370 7 1650 13 2230 19 2240
2 1390 8 2000 14 2200 20 2280
3 1360 9 2240 15 2130 21 2240
4 1290 10 2320 16 2070 22 2120
5 1200 11 2230 17 2130 23 1850
6 1410 12 2310 18 2140 24 1590
Table 8 The coefficients of thermal units power generation for test
system 2
Plant ai bi ci di ei pmin
si
pmax
si
1 0.0012 2.45 0.0012 160 0.038 20 175
2 0.0010 2.32 0.0010 180 0.037 40 300
3 0.0015 2.10 0.0015 200 0.035 50 500
Table 9 Load demands of hydrothermal system for test system 2
Hour Load Hour Load Hour Load Hour Load
1 750 7 950 13 1110 19 1070
2 780 8 1010 14 1030 20 1050
3 700 9 1090 15 1010 21 910
4 650 10 1080 16 1060 22 860
5 670 11 1100 17 1050 23 850
6 800 12 1150 18 1120 24 800
Lightning attachment procedure optimization algorithm for nonlinear non-convex short-term… 16233
123
10. 4.1.1 Test system 1 case 1
The first case study is solved without considering the valve
point loading effect of the thermal units. The fuel cost
function of thermal unit is a quadratic function of the STHS
problem as shown in Eq. (1). The optimal hourly water
discharge and hydrothermal power generation obtained by
LAPO method for solving the STHS problem during 24 h
scheduling are reported in Table 10. It is obvious from
Table 10 that the optimal solution satisfies all the con-
straints on hydro discharges and thermal power generation.
The best results of the STHS problem proposed by LAPO
method are compared with different optimization tech-
niques in Table 11. The minimum fuel cost obtained by the
LAPO method is 871,910.67 $ which shows the capability
of the proposed method for obtaining the optimal solution
of the STHS problem with respect to other optimization
methods. The minimum cost is obtained by the proposed
method better than the recent optimization algorithm with
3483.56 $/day. The optimal hourly hydro and thermal
power generation for each hour for the first case study is
shown in Fig. 4. It is obvious that the load demand is equal
to the sum of the power generation for each hour. Figure 5
shows the convergence characteristic of the LAPO method
for this case study.
4.1.2 Test system 1 case 2
The effect of valve point loading has been taken into
account in this case to illustrate the performance of the
LAPO method. Table 12 presents the optimal variables of
water discharges and the optimal power generation of
hydro and thermal generating units obtained by LAPO
method. The best results obtained by LAPO method are
compared with recent meta-heuristic method like a real-
coded genetic algorithm based on improved Mühlenbein
mutation (RCGA-IMM) (Nazari-Heris et al. 2017a) as
illustrated in Table 13. The minimum cost found by LAPO
Hydro Power Units
Thermal
Power Unit
Electric Power
System
Load
16234 M. Mohamed et al.
123
11. Table 10 Optimal water discharge of hydro and thermal power generation for case 1 of test system 1
Hours Water discharge rates (104
m3
/s) Hydro plant power generation (MW) Thermal plant
generation (MW)
Total power
generation (MW)
Plant 1 Plant 2 Plant 3 Plant 4 Plant 1 Plant 2 Plant 3 Plant 4
1 13.248 13.377 13.574 22.250 94.981 81.167 37.384 242.897 913.567 1370
2 13.553 14.806 11.524 23.506 93.146 78.868 38.674 213.683 965.630 1390
3 14.988 14.997 11.479 24.971 90.038 74.092 38.674 199.588 957.607 1360
4 14.995 14.999 11.510 24.883 86.620 72.499 38.674 199.550 892.642 1290
5 14.852 14.999 10.544 24.990 86.640 72.499 41.245 288.581 801.027 1290
6 14.940 14.985 11.924 24.997 86.630 72.478 44.823 327.843 878.223 1410
7 14.853 15 29.934 24.998 86.640 72.500 0 327.845 1162.995 1650
8 14.925 14.998 13.595 24.999 86.632 72.498 37.357 327.849 1475.660 2000
9 14.892 14.989 11.691 24.989 86.636 72.485 38.664 327.819 1714.390 2240
10 14.724 14.994 10.663 24.999 86.643 72.491 38.465 327.848 1794.545 2320
11 14.797 14.993 29.669 24.999 86.643 72.491 0 327.848 1743.013 2230
12 14.994 14.999 29.965 24.994 86.621 72.499 0 314.280 1836.598 2310
13 14.990 14.999 11.522 24.999 86.621 72.499 38.674 327.849 1704.354 2230
14 14.988 14.998 11.474 24.978 86.622 72.497 41.700 327.789 1671.386 2200
15 14.999 14.999 12.298 24.989 86.620 72.499 44.511 327.819 1598.550 2130
16 14.953 14.999 12.307 24.991 86.628 72.499 46.881 327.825 1536.171 2070
17 14.992 14.992 12.048 24.999 86.621 72.490 49.108 327.847 1593.925 2130
18 14.990 14.976 13.147 24.981 86.621 72.466 51.001 327.795 1602.111 2140
19 14.910 14.980 12.553 24.993 86.634 72.472 52.829 327.828 1700.235 2240
20 14.954 14.999 12.194 24.996 86.628 72.499 57.180 327.839 1735.846 2280
21 14.788 14.997 12.805 24.975 86.643 72.496 60.775 327.779 1692.306 2240
22 14.489 14.887 13.477 24.961 86.612 72.339 63.265 327.703 1570.078 2120
23 14.960 14.982 13.761 24.998 86.627 72.475 64.612 327.845 1298.445 1850
24 14.999 14.846 12.812 24.972 107.01 80.704 58.974 303.488 1039.811 1590
Table 11 Comparison of the best results of the STHS problem for case 1 of test system 1
Algorithm Minimum cost
($)
Average cost
($)
Maximum cost
($)
Computation time
(s)
LAPO 871,910.67 873,820.11 878,850.11 4.08
IHS (Nazari-Heris et al. 2018) 875,394.2288 875,687.1443 876,371.0758 NA
RCGA-IMM (Nazari-Heris et al. 2017a) 875,856.41 NA NA NA
RCGA-RTVM (Haghrah et al. 2014) 877,735.9 878,597.2406 880,948.518 NA
FAPSO (Chang 2010) 914,660.00 NA NA 4.73
Improved DE (Basu 2014b) 917,250.1 NA NA NA
PSO (Chang 2010) 921,920 NA NA 10.67
SOHPSO_TVAC (Mandal and Chakraborty 2011) 922,018.24 NA NA NA
CPSO (Wu et al. 2019) 922,328.64 922,367.85 922,564.52 12.9
MDNLPSO (Rasoulzadeh-Akhijahani and Mohammadi-Ivatloo
2015)
922,336.3 922,676.2 923,404.5 35
SPPSO (Zhang et al. 2012) 922,336.31 922,668.45 927,203.63 16.3
RCGA–AFSA (Fang et al. 2014) 922,339.625 922,346.323 922,362.532 NA
TLBO (Roy 2013) 922,373.39 922,462.24 922,873.81 NA
HCRO-DE (Roy 2014) 922,444.79 922,513.62 922,936.17 NA
IPSO (Hota et al. 2009) 922,553.49 NA NA 38.46
MDE (Zhang et al. 2012) 922,556.38 923,201.13 923,813.99 53
RCGA (Fang et al. 2014) 923,966.285 924,108.731 924,232.072 NA
Lightning attachment procedure optimization algorithm for nonlinear non-convex short-term… 16235
123
12. method is 881,184.5 $ which is found to be superior to all
other reported methods in Table 13. The total fuel cost can
be saved when compared to recent optimization techniques
which is 10,595.35 $/day. In addition, the proposed method
successful to maintain the load demand is equal to the total
power generation. The optimal power generation for hydro
and thermal generating units is depicted in Fig. 6. The
optimal cost convergence characteristic for this test system
is shown in Fig. 7. It is clear from these tables and fig-
ures that the best solution obtained by the LAPO method
satisfies all the constraints of the STHS problem for this
case study.
4.2 Test system 2
To evaluate the performance of the proposed LAPO
method, it is applied to another system. This system
includes four hydro and three thermal power generating
units, but this test system is more complex than the first test
system because this system includes the effect of valve
point loading and the power transmission losses.
0
500
1000
1500
2000
2500
1 2 3 4 5 6 7 8 9 10 11 12 13 14 15 16 17 18 19 20 21 22 23 24
Generation
(MW)
Time ( hour)
hydro 4
hydro 3
hydro 2
hydro 1
Thermal
Fig. 4 Hourly optimal power
generation of hydro and thermal
units for test system 1 case 1
Hydro Power Units
Thermal
Power Units
Electric Power
System
Load
16236 M. Mohamed et al.
123
13. 4.2.1 Test system 2 case 1
In this case, the valve point loading effect of thermal units
is considered and the power transmission losses are
neglected. The optimal solution of the STHS problem is
given in Table 14. The water discharge and hydro power
generation of four hydro units are reported in this table. In
addition, thermal power generation of three thermal units is
provided in this table. It is obvious that the scheduling
results obtained by LAPO method satisfy all hydraulic and
electric system constraints. The minimum fuel cost of test
system 2 case 1 with recent optimization method is
40,204.32 $ which is reduced to 38,800.75 $ with the
proposed LAPO method as shown in Table 15. In the other
words, the total daily saving is 1403.57 $ compared to the
recent optimization method in Fang et al. (2014). Figure 8
shows the hourly hydro and thermal power generation of
0 500 1000 1500 2000 2500 3000
0.85
0.9
0.95
1
1.05
1.1
1.15
x 10
6
Iteration
Total
cost
($)
Fig. 5 Optimal cost of STHS problem for case 2 of test system 1
Table 12 Optimal water discharge of hydro and thermal power generation for case 2 of test system 1
Hours Water discharge rates (104
m3
/s) Hydro plant power generation (MW) Thermal plant
generation (MW)
Total power
generation (MW)
Plant 1 Plant 2 Plant 3 Plant 4 Plant 1 Plant 2 Plant 3 Plant 4
1 7.4753 12.880 10.321 19.324 72.400 80.171 38.258 235.651 943.518 1370
2 12.798 8.0651 29.437 23.685 95.012 59.213 0 218.334 1017.434 1390
3 14.061 14.997 11.571 24.990 93.993 80.183 38.673 199.596 947.517 1360
4 8.2914 13.378 13.259 23.542 73.938 73.379 37.746 198.373 906.561 1290
5 7.0003 14.732 13.828 23.904 65.434 72.103 37.049 282.771 832.640 1290
6 7.3898 14.177 28.302 24.860 67.888 71.146 0 327.449 943.513 1410
7 11.230 14.831 11.075 24.316 85.029 72.255 38.620 325.779 1128.313 1650
8 9.4620 13.681 17.170 24.089 77.900 70.132 29.029 325.025 1497.917 2000
9 12.576 12.977 10.490 24.603 86.827 68.441 38.369 326.684 1719.677 2240
10 13.639 14.938 11.775 25 86.794 72.412 39.335 327.850 1793.595 2320
11 13.167 10.335 10.600 24.668 85.575 59.442 38.432 326.881 1719.668 2230
12 11.135 14.872 10.333 24.835 81.120 72.316 44.582 318.382 1793.597 2310
13 10.405 14.676 11.610 22.920 78.992 72.016 38.671 320.643 1719.676 2230
14 10.593 14.905 11.294 24.799 80.422 72.365 38.662 325.832 1682.718 2200
15 14.804 14.145 13.874 24.543 86.643 71.085 36.983 326.496 1608.792 2130
16 14.861 14.991 27.340 24.999 86.639 72.487 0 327.849 1583.036 2070
17 12.518 14.925 11.706 24.267 84.530 72.394 38.662 325.617 1608.798 2130
18 14.844 15 11.447 24.999 86.640 72.500 38.674 327.849 1614.295 2140
19 13.142 14.834 12.917 23.920 85.541 72.260 38.072 324.445 1719.679 2240
20 14.533 13.074 16.371 18.966 86.621 68.691 31.554 299.549 1793.581 2280
21 14.473 11.346 10.251 24.597 86.608 63.381 43.667 326.666 1719.673 2240
22 14.668 8.2687 10.463 24.080 86.640 50.054 49.516 324.995 1608.796 2120
23 14.288 7.6359 11.623 24.595 86.549 46.764 39.951 326.658 1350.071 1850
24 14.184 14.706 10.063 21.786 105.92 80.468 56.178 293.020 1054.406 1590
Lightning attachment procedure optimization algorithm for nonlinear non-convex short-term… 16237
123
14. the optimal solution for test system 2 case 1. The conver-
gence characteristics of STHS problem by employing the
LAPO method are shown in Fig. 9.
4.2.2 Test system 2 case 2
The valve point loading effect and the power transmission
lossesofthehydrothermalsystemareconsideredinthiscasefor
obtaining the optimal generation scheduling. The optimal
generation scheduling for four hydro and three thermal units,
Table 13 Comparison of the best results of the STHS problem for case 2 of test system 1
Algorithm Minimum cost
($)
Average cost
($)
Maximum cost
($)
Computation
time(s)
LAPO 881,184.5 885,721.3 889,151.6 5.06
RCGA-IMM (Nazari-Heris et al. 2017a) 891,779.85 NA NA NA
RCGA-RTVM (Haghrah et al. 2014) 917,222.73 NA NA NA
IDE (Basu 2014b) 923,016.29 923,036.28 923,152.06 547.07
MDNLPSO (Rasoulzadeh-Akhijahani and Mohammadi-Ivatloo
2015)
923,961 925,258 926,230 119
CPSO (Wu et al. 2019) 924,042.14 925,086.38 926,213.26 18.6
MAPSO (Amjady and Soleymanpour 2010) 924,636.88 926,496 927,431 NA
DRQEA (Wang et al. 2012) 925,485.21 NA NA 7.5
MHDE (Lu et al. 2010) 925,547.31 NA NA 9
IPSO (Hota et al. 2009) 925,978.84 NA NA 31
RQEA (Wang et al. 2012) 926,068.33 NA NA 7.6
RCGA–AFSA (Fang et al. 2014) 927,899.872 927,693.764 928,025.343 NA
DE (Wang et al. 2012) 928,662.84 NA NA 8.7
RCGA (Fang et al. 2014) 930,565.242 930,966.356 931,427.212 NA
0
500
1000
1500
2000
2500
1 2 3 4 5 6 7 8 9 10 11 12 13 14 15 16 17 18 19 20 21 22 23 24
Generation
(MW)
Time (hour)
Hydro 4
Hydro 3
Hydro 2
Hydro 1
Thermal
Fig. 6 Hourly optimal power
generation of hydro and thermal
units for test system 1 case 2
0 500 1000 1500 2000 2500 3000
0.9
1
1.1
1.2
1.3
x 10
6
Iteration
Total
cost
($)
Fig. 7 Optimal cost of STHS problem for case 2 of test system 1
16238 M. Mohamed et al.
123
16. hourly water discharge and the power transmission losses are
shown in Table 16. The LAPO algorithm is the best for solving
the STHS problem by obtaining the minimal total fuel cost with
efficiency as shown in Table 17. The minimum cost obtained
by LAPO is 39,691.86 $ which helps in daily saving the cost by
234.87 $ as compared the RCGA-IMM (Nazari-Heris et al.
2017a). The optimal results obtained by LAPO method satisfy
all constraints of STHS problem considering valve point
loading effect and the power transmission losses. The optimal
power generation for hydrothermal units is shown in Fig. 10. It
is clearly seen from Fig. 10 that the total power generation
satisfies the power load demand. Figure 11 shows convergence
characteristicsofSTHSproblemforcase 2oftestsystem2.The
power transmission loss coefficients are as follows:
Bij ¼
0:34 0:13 0:09 0:01 0:08 0:01 0:02
0:13 0:14 0:10 0:01 0:05 0:02 0:01
0:09 0:10 0:31 0:00 0:01 0:07 0:05
0:01 0:01 0:00 0:24 0:08 0:04 0:07
0:08 0:05 0:01 0:08 1:92 0:27 0:02
0:01 0:02 0:07 0:04 0:27 0:32 0:00
0:02 0:01 0:05 0:07 0:02 0:00 1:35
2
6
6
6
6
6
6
6
6
6
6
6
4
3
7
7
7
7
7
7
7
7
7
7
7
5
104
MW1
ð20Þ
Boj ¼ 0:75 0:06 0:7 0:03 0:27 0:77 0:01
½
106
ð21Þ
B00 ¼ 0:55 MW ð22Þ
4.3 Test system 3
Test system 3 consists of four hydro and ten thermal power
generating units. Here valve point loading effect of thermal
plants is considered, but the power transmission loss is not
considered. The data of this system have been taken from
Ref. (Mandal and Chakraborty 2008). The optimal cost
obtained by LAPO method for this system is 165,675.084
$. The hourly water discharge of hydro units and the
optimal power generation scheduling of hydro and thermal
0
200
400
600
800
1000
1200
1400
1 2 3 4 5 6 7 8 9 10 11 12 13 14 15 16 17 18 19 20 21 22 23 24
Generation
(MW)
Time (hour)
Hydro 4
Hydro 3
Hydro 2
Hydro 1
Thermal 3
Thermal 2
Thermal 1
Fig. 8 Hourly optimal power
generation of hydro and thermal
units for test system 2 case 1
0 500 1000 1500 2000 2500 3000
3.5
4
4.5
5
5.5
6
6.5
7
x 10
4
Iteration
Total
cost
($)
Fig. 9 Optimal cost of STHS problem for case 1of test system 2
16240 M. Mohamed et al.
123
18. units are shown in Table 18 and 19. It can be observed
from Tables 18 and 19 that the power load demand during
24-h scheduling time is satisfied by total power generation
of four hydro units and ten thermal unit. Table 20 shows
the results obtained by different methods for test system 3.
The convergence characteristics of the proposed method
for this system are presented in Fig. 12. The optimal hourly
hydro and thermal power generation for each hour for test
system 3 is shown in Fig. 13.
Table 17 Comparison of the best results of the STHS problem for case 2 of test system 2
Algorithm Minimum cost
($)
Average cost
($)
Maximum cost
($)
Computation
time(s)
LAPO 39,691.86 40,150.23 40,563.5 7.5328
RCGA-IMM (Nazari-Heris et al. 2017a) 40,483.26196 NA NA NA
RCGA-RTVM (Haghrah et al. 2014) 40,486.6676 NA NA NA
Improved DE (Basu 2014b) 40,627.92 40,708.53 40,860.70 627.06
RCGA–AFSA (Fang et al. 2014) 40,913.828 41,235.72 41,362.575 NA
ACABC (Liao et al. 2013) 41,074.42 NA NA 16
MDNLPSO (Rasoulzadeh-Akhijahani and Mohammadi-Ivatloo
2015)
41,183 41595 41994 192
CPSO (Wu et al. 2019) 41,215.47 41682.92 41843.55 45.5
DRQEA (Wang et al. 2012) 41,435.76 NA NA 18
MCDE (Zhang et al. 2015) 41,586.18 42,022.67 42,365.84 100.05
ACDE (Lu et al. 2010) 41,593.48 NA NA 29
MHDE (Lakshminarasimman and Subramanian 2006) 41,856.50 NA NA 31
QTLBO (Roy et al. 2013) 42,187.49 42,193.46 42,202.75 NA
DE (Wang et al. 2012) 42,801.04 NA NA 21
ALO (Dubey et al. 2016) 42,833.908 NA NA 55.63
RCGA (Fang et al. 2014) 42,886.352 43,261.912 43,032.334 NA
CABC (Liao et al. 2013) 43,362.68 NA NA 21
DE (Mandal and Chakraborty 2009) 43,500.00 NA NA 72.9570
IPSO (Swain et al. 2011) 44,321.236 NA NA NA
DE (Lakshminarasimman and Subramanian 2006) 44,526.10 NA NA NA
EP (Basu 2004a) 45,063.04 NA NA NA
Fig. 10 Hourly optimal power
generation of hydro and thermal
units for test system 2 case 2
16242 M. Mohamed et al.
123
19. 4.4 Spillage effect
The spillage effect appears in the third hydropower only
(Kang et al. 2017), an quantity suitable of spillage from the
third hydropower plant will lead to more hydropower
production. The problem formulation of the STHS involves
the spillage effect in Eq. (3), so the spillage rate for the
hydraulic system is taken into account in short-term
hydrothermal. The STHS problem involving the spillage
effect has been solved with the proposed algorithm LAPO.
The spillage effect is taken on two test systems. Table 21
shows the effect of the spillage at different test system.
Moreover, the minimum fuel cost reduces with the pres-
ence of spillage effect compared to the spillage effect not
taking into account in short-term hydrothermal. The min-
imum cost value with considering the spillage effects
illustrates in Table 21. Table 22 illustrates the spillage
0 500 1000 1500 2000 2500 3000
3.5
4
4.5
5
5.5
6
6.5
7
x 10
4
Iteration
Total
cost
($)
Fig. 11 Optimal cost of STHS problem for case 2 of test system 2
Table 18 Optimal water
discharge and power generation
of hydro units for test system 3
Hours (h) Water discharge rates (104
m3
/s) Hydro plant power generation (MW)
Plant 1 Plant 2 Plant 3 Plant 4 Plant 1 Plant 2 Plant 3 Plant 4
1 11.660 12.757 29.986 9.538 91.787 79.899 0.000 169.112
2 9.634 14.997 29.970 7.152 83.435 79.521 0.000 136.154
3 6.237 14.973 29.987 7.661 62.614 74.452 0.000 136.285
4 8.207 14.908 17.102 7.967 75.858 72.369 37.725 131.459
5 5.402 14.973 29.959 15.492 55.715 72.462 0.000 219.372
6 12.716 9.468 14.811 16.966 92.170 55.575 45.658 245.181
7 7.543 14.925 10.112 10.320 70.159 72.393 50.191 204.712
8 12.436 14.931 29.965 11.903 90.047 72.402 0.000 226.682
9 12.394 14.881 18.114 20.282 88.697 72.330 41.897 304.037
10 11.741 9.678 20.047 17.257 86.681 56.551 37.258 281.721
11 10.496 14.974 14.595 21.218 83.329 72.464 56.297 293.952
12 11.588 14.935 17.550 12.999 86.208 72.408 53.622 249.307
13 12.686 14.990 29.998 22.011 87.918 72.486 0.000 312.352
14 12.561 11.202 14.130 21.883 87.359 62.854 60.839 309.742
15 10.622 9.711 17.746 15.658 82.112 56.704 57.874 268.119
16 13.021 13.738 18.970 21.129 86.624 70.256 56.324 300.998
17 14.866 14.983 18.466 20.720 86.639 72.476 58.537 308.891
18 12.503 14.953 29.974 17.282 84.501 72.434 0.000 283.482
19 14.208 10.966 21.739 19.979 86.515 61.972 47.161 299.075
20 8.983 14.975 17.290 19.772 72.618 72.465 62.561 297.025
21 14.713 11.351 12.981 22.524 86.643 63.395 64.299 306.165
22 11.263 12.472 20.979 24.904 81.501 67.044 53.678 320.156
23 14.989 14.986 15.978 24.957 86.622 72.480 64.816 316.434
24 9.920 14.827 19.095 12.504 91.104 80.674 48.342 226.653
Lightning attachment procedure optimization algorithm for nonlinear non-convex short-term… 16243
123
21. effect on the optimal hydro and thermal power generation
for case 1 of test system 1.
5 Conclusion
In this paper, the optimal solution of the nonlinear non-
convex STHS problem has been solved LAPO as a recent
optimization technique. To examine the effectiveness of
the proposed LAPO algorithm, three different test systems
consisting of multi-chain cascaded of hydro power plants
and different thermal units have been used. The effect of
the valve point loading effect and power system trans-
mission losses has been considered. Moreover, the per-
formance of proposed algorithm has been compared with
various well-known optimization techniques: IHS and
0 500 1000 1500 2000 2500 3000 3500 4000 4500 5000
1.6
1.7
1.8
1.9
2
2.1
2.2
2.3
2.4
2.5
2.6
x 10
5
Iteration
Total
Cost
($)
Fig. 12 Optimal cost of STHS problem for test system 3
0
500
1000
1500
2000
2500
1 2 3 4 5 6 7 8 9 10 11 12 13 14 15 16 17 18 19 20 21 22 23 24
Power
Generation
(MW)
Time (Hour)
Hydro4
Hydro3
Hydro2
Hydro1
Thermal 10
Thermal 9
Thermal 8
Thermal 7
Thermal 6
Thermal 5
Thermal 4
Thermal 3
Thermal 2
Thermal 1
Fig. 13 Hourly optimal power
generation of hydro and thermal
units for test system 3
Table 21 Spillage reduces fuel
cost
No allowed spillage allowed spillage
Test system 1 Case 1 871,910.67 867,946.554
Test system 1 Case 2 881,184.5 877,858.408
Test system 2 case 1 38,800.75 38,615.12
Test system 2 case 2 39,691.86 39,512.974
Lightning attachment procedure optimization algorithm for nonlinear non-convex short-term… 16245
123
22. RCGA-IMM. However, the numerical results and simula-
tions prove the efficacy and superiority of the proposed
algorithm compared with these techniques. Using the
proposed algorithm, the minimum cost value for test sys-
tem 1 without considering the valve point loading effects is
3483.56 $/day compared to the best technique, while the
total daily saving is 234.87 $ for test system 2 with con-
sidering the valve point loading effect and transmission
power losses. Moreover, the proposed algorithm succeeded
to minimize the fuel cost with the presence of the spillage
effect compared to the spillage effect not taking into
account in short-term hydrothermal.
Compliance with ethical standards
Conflict of interest Authors declare that they have no conflict of
interest.
Ethical approval This article does not contain any studies with human
participants or animals performed by any of the authors.
References
Amjady N, Soleymanpour HR (2010) Daily hydrothermal generation
scheduling by a new modified adaptive particle swarm opti-
mization technique. Electr Power Syst Res 80:723–732
Basu M (2004a) An interactive fuzzy satisfying method based on
evolutionary programming technique for multiobjective short-
term hydrothermal scheduling. Electr Power Syst Res
69:277–285
Basu M (2014b) Improved differential evolution for short-term
hydrothermal scheduling. Int J Electr Power Energy Syst
58:91–100
Bhattacharjee K, Bhattacharya A, nee Dey SH (2014a) Oppositional
real coded chemical reaction based optimization to solve short-
term hydrothermal scheduling problems. Int J Electr Power
Energy Syst 63:145–157
Bhattacharjee K, Bhattacharya A, nee Dey SH (2014b) Real coded
chemical reaction based optimization for short-term hydrother-
mal scheduling. Appl Soft Comput 24:962–976
Table 22 Optimal water discharge of hydro and thermal power generation for case 1 of test system 1 (spillage allowed)
Hours Water discharge rates (104
m3
/s) Hydro plant power generation (MW) Thermal plant
generation (MW)
Total power
generation (MW)
Plant 1 Plant 2 Plant 3 Plant
4
Plant 1 Plant 2 Plant 3 Plant 4
1 22.634 13.576 14.518 12.984 243.4163 37.38161 82.86337 94.6085 911.7275 1370
2 23.4960 11.171 14.771 14.987 213.0707 38.6427 77.89915 93.58441 966.7954 1390
3 24.979 11.664 15 14.939 199.592 38.66687 73.1265 89.32474 959.2355 1360
4 24.982 11.318 14.995 14.550 199.5931 41.11937 72.49432 86.62499 890.1698 1290
5 24.972 11.241 14.997 14.997 288.5681 43.78345 72.49611 86.62053 798.4858 1290
6 24.999 11.766 14.972 14.967 327.85 38.65367 72.46136 86.62597 884.345 1410
7 24.937 10.522 14.965 14.994 327.6711 41.29368 72.45078 86.6211 1121.93 1650
8 24.988 13.808 14.999 14.658 327.8173 47.03159 72.49915 86.63928 1465.984 2000
9 25 11.944 14.977 14.983 327.85 46.12701 72.46866 86.62326 1706.914 2240
10 24.953 11.481 14.986 14.939 327.7174 38.6749 72.48053 86.63055 1794.529 2320
11 24.998 11.080 14.997 14.993 327.8467 45.63519 72.49612 86.6212 1697.264 2230
12 24.967 10.331 14.998 14.960 314.5057 51.04109 72.49722 86.62732 1785.329 2310
13 24.993 12.810 14.984 14.924 327.8315 54.73438 72.47763 86.63274 1688.324 2230
14 24.998 12.617 14.997 14.948 327.8448 56.61566 72.4961 86.62921 1656.4 2200
15 24.995 12.996 14.972 14.933 311.2562 58.28221 72.46148 86.63147 1601.369 2130
16 24.996 10.193 14.937 14.954 327.8389 56.864 72.41142 86.62824 1526.201 2070
17 24.989 13.399 14.985 14.656 327.8088 60.75642 72.47954 86.63915 1582.261 2130
18 24.996 13.698 14.9733 14.894 327.6919 61.78703 72.4625 86.63648 1591.384 2140
19 24.998 13.961 14.999 14.994 327.8464 62.50069 72.49865 86.62101 1690.533 2240
20 24.981 12.3001 14.994 14.929 327.7981 53.81097 72.4921 86.63204 1739.171 2280
21 24.994 11.4123 14.979 14.856 327.8337 38.6727 72.4709 86.64003 1714.364 2240
22 24.997 11.218 14.993 14.796 327.8438 45.98091 72.49087 86.64331 1587.036 2120
23 24.999 11.208 14.983 14.788 327.8495 38.64956 72.47675 86.64351 1324.382 1850
24 24.999 12.510 14.979 14.982 303.55 58.88895 80.91757 107.0022 1039.554 1590
16246 M. Mohamed et al.
123
23. Catalão JPS, Pousinho HMI, Mendes VMF (2011) Hydro energy
systems management in Portugal: profit-based evaluation of a
mixed-integer nonlinear approach. Energy 36:500–507
Chang W (2010) Notice of retraction optimal scheduling of
hydrothermal system based on improved particle swarm opti-
mization. In: Power and energy engineering conference
(APPEEC), 2010 Asia-Pacific, pp 1–4
Chang GW, Aganagic M, Waight JG, Medina J, Burton T, Reeves S,
Christoforidis M (2001) Experiences with mixed integer linear
programming based approaches on short-term hydro scheduling.
IEEE Trans Power Syst 16:743–749
Dieu VN, Ongsakul W (2009) Improved merit order and augmented
Lagrange Hopfield network for short term hydrothermal
scheduling. Energy Convers Manag 50:3015–3023
Dubey HM, Pandit M, Panigrahi B (2016) Ant lion optimization for
short-term wind integrated hydrothermal power generation
scheduling. Int J Electr Power Energy Syst 83:158–174
Fang N, Zhou J, Zhang R, Liu Y, Zhang Y (2014) A hybrid of real
coded genetic algorithm and artificial fish swarm algorithm for
short-term optimal hydrothermal scheduling. Int J Electr Power
Energy Syst 62:617–629
Gouthamkumar N, Sharma V, Naresh R (2015) Disruption based
gravitational search algorithm for short term hydrothermal
scheduling. Expert Syst Appl 42:7000–7011
Haghrah A, Mohammadi-ivatloo B, Seyedmonir S (2014) Real coded
genetic algorithm approach with random transfer vectors-based
mutation for short-term hydro–thermal scheduling. IET Gener
Transm Distrib 9:75–89
Homem-de-Mello T, De Matos VL, Finardi EC (2011) Sampling
strategies and stopping criteria for stochastic dual dynamic
programming: a case study in long-term hydrothermal schedul-
ing. Energy Syst 2:1–31
Hota P, Chakrabarti R, Chattopadhyay P (1999) Short-term
hydrothermal scheduling through evolutionary programming
technique. Electr Power Syst Res 52:189–196
Hota P, Barisal A, Chakrabarti R (2009) An improved PSO technique
for short-term optimal hydrothermal scheduling. Electr Power
Syst Res 79:1047–1053
Kang C, Guo M, Wang J (2017) Short-term hydrothermal scheduling
using a two-stage linear programming with special ordered sets
method. Water Resour Manage 31:3329–3341
Lakshminarasimman L, Subramanian S (2006) Short-term scheduling
of hydrothermal power system with cascaded reservoirs by using
modified differential evolution. IEE Proc Gener Transm Distrib
153:693–700
Liao X, Zhou J, Ouyang S, Zhang R, Zhang Y (2013) An adaptive
chaotic artificial bee colony algorithm for short-term hydrother-
mal generation scheduling. Int J Electr Power Energy Syst
53:34–42
Lu Y, Zhou J, Qin H, Wang Y, Zhang Y (2010) An adaptive chaotic
differential evolution for the short-term hydrothermal generation
scheduling problem. Energy Convers Manag 51:1481–1490
Mahor A, Rangnekar S (2012) Short term generation scheduling of
cascaded hydro electric system using novel self adaptive inertia
weight PSO. Int J Electr Power Energy Syst 34:1–9
Malik TN, Zafar S, Haroon S (2016) Short-term economic emission
power scheduling of hydrothermal systems using improved
chaotic hybrid differential evolution. Turk J Electr Eng Comput
Sci 24:2654–2670
Mandal K, Chakraborty N (2008) Differential evolution technique-
based short-term economic generation scheduling of hydrother-
mal systems. Electr Power Syst Res 78:1972–1979
Mandal K, Chakraborty N (2009) Short-term combined economic
emission scheduling of hydrothermal power systems with
cascaded reservoirs using differential evolution. Energy Convers
Manag 50:97–104
Mandal KK, Chakraborty N (2011) Short-term combined economic
emission scheduling of hydrothermal systems with cascaded
reservoirs using particle swarm optimization technique. Appl
Soft Comput 11:1295–1302
Mandal KK, Basu M, Chakraborty N (2008) Particle swarm
optimization technique based short-term hydrothermal schedul-
ing. Appl Soft Comput 8:1392–1399
Narang N, Dhillon J, Kothari D (2014) Scheduling short-term
hydrothermal generation using predator prey optimization tech-
nique. Appl Soft Comput 21:298–308
Nazari-Heris M, Mohammadi-Ivatloo B, Haghrah A (2017a) Optimal
short-term generation scheduling of hydrothermal systems by
implementation of real-coded genetic algorithm based on
improved Mühlenbein mutation. Energy 128:77–85
Nazari-Heris M, Mohammadi-Ivatloo B, Gharehpetian G (2017b)
Short-term scheduling of hydro-based power plants considering
application of heuristic algorithms: a comprehensive review.
Renew Sustain Energy Rev 74:116–129
Nazari-Heris M, Babaei AF, Mohammadi-Ivatloo B, Asadi S (2018)
Improved harmony search algorithm for the solution of non-
linear non-convex short-term hydrothermal scheduling. Energy
151:226–237
Nematollahi AF, Rahiminejad A, Vahidi B (2017) A novel physical
based meta-heuristic optimization method known as lightning
attachment procedure optimization. Appl Soft Comput
59:596–621
Nematollahi AF, Rahiminejad A, Vahidi B (2019) A novel multi-
objective optimization algorithm based on Lightning Attachment
Procedure Optimization algorithm. Appl Soft Comput
75:404–427
Ramesh P (2016) Short term hydrothermal scheduling in power
system using improved particle swarm optimization. Int J Adv
Eng Technol 602:606
Rasoulzadeh-Akhijahani A, Mohammadi-Ivatloo B (2015) Short-term
hydrothermal generation scheduling by a modified dynamic
neighborhood learning based particle swarm optimization. Int J
Electr Power Energy Syst 67:350–367
Roy PK (2013) Teaching learning based optimization for short-term
hydrothermal scheduling problem considering valve point effect
and prohibited discharge constraint. Int J Electr Power Energy
Syst 53:10–19
Roy PK (2014) Hybrid chemical reaction optimization approach for
combined economic emission short-term hydrothermal schedul-
ing. Electr Power Compon Syst 42:1647–1660
Roy PK, Sur A, Pradhan DK (2013) Optimal short-term hydro-
thermal scheduling using quasi-oppositional teaching learning
based optimization. Eng Appl Artif Intell 26:2516–2524
Swain R, Barisal A, Hota P, Chakrabarti R (2011) Short-term
hydrothermal scheduling using clonal selection algorithm. Int J
Electr Power Energy Syst 33:647–656
Türkay B, Mecitoğlu F, Baran S (2011) Application of a fast
evolutionary algorithm to short-term hydro-thermal generation
scheduling. Energy Sour Part B 6:395–405
Wang Y, Zhou J, Mo L, Zhang R, Zhang Y (2012) Short-term
hydrothermal generation scheduling using differential real-coded
quantum-inspired evolutionary algorithm. Energy 44:657–671
Wood AJ, Wollenberg BF (2003) Power generation, operation and
control. Wiley, NewYork
Wu H, Guan X, Zhai Q, GAO F (2009) Short-term hydrothermal
scheduling using mixed-integer linear programming. Proceed-
ings of the CSEE 29:82–88
Wu Y, Wu Y, Liu X (2019) Couple-based particle swarm optimiza-
tion for short-term hydrothermal scheduling. Appl Soft Comput
74:440–450
Lightning attachment procedure optimization algorithm for nonlinear non-convex short-term… 16247
123
24. Zaghlool MF, Trutt F (1988) Efficient methods for optimal scheduling
of fixed head hydrothermal power systems. IEEE Trans Power
Syst 3:24–30
Zhang J, Wang J, Yue C (2011) Small population-based particle
swarm optimization for short-term hydrothermal scheduling.
IEEE Trans Power Syst 27:142–152
Zhang J, Wang J, Yue C (2012) Small population-based particle
swarm optimization for short-term hydrothermal scheduling.
IEEE Trans Power Syst 27:142–152
Zhang J, Lin S, Qiu W (2015) A modified chaotic differential
evolution algorithm for short-term optimal hydrothermal
scheduling. Int J Electr Power Energy Syst 65:159–168
Zhou J, Liao X, Ouyang S, Zhang R, Zhang Y (2014) Multi-objective
artificial bee colony algorithm for short-term scheduling of
hydrothermal system. Int J Electr Power Energy Syst 55:542–553
Publisher’s Note Springer Nature remains neutral with regard to
jurisdictional claims in published maps and institutional affiliations.
16248 M. Mohamed et al.
123