2. HUMAN PERFORMANCE IN THE NUCLEAR INDUSTRY
2
operating experience, all members could then
work together to achieve the highest possible
standards of nuclear safety.
The Institute of Nuclear Power
Operations (INPO), founded in December
1979, established a Special Review
Committee on Human Performance in late
1993. This committee, along with several
working groups, was asked to identify actions
to bring about continued improvement in
human performance within the commercial
nuclear power industry [1]. It was this
document, which was adopted and reviewed
by WANO to form the basis, in 2002, for
improving human performance [2].
III. HUMAN PERFORMANCE
IMPROVEMENT
There is now good evidence through
human performance improvement to
demonstrate the benefits to safety, production
and output.
In the UK over a 2-year period, the
performance of key performance indicators
(KPI's) were ahead of WANO “Best in Class”
targets for 2004/05. This was attributed to the
business improvements at that time.
Implementing and reinforcing the Human
Performance error prevention process had a
bearing on these results, Non-outage defects
backlog reduced by 55%, Accident frequency
rate reduced by 40%, Unplanned automatic trip
rate reduced by 30%, Work schedule adherence
was 28% better [3]
Human error contributes to around 80%
of nuclear events in the industry, the remaining
20% attributable to equipment / plant failures.
This not only has a bearing on the performance
of the facilities themselves, but the overall
public perception of the nuclear industry. Of the
identified human errors, 30% of the mistakes
were down to the individuals and 70% due to
the organisations failing to prevent the errors.
This is shown in Fig. 1. [4]
Fig. 1. Contribution of human error to the
occurrence of events. [4]
IV. WHY CONCENTRATE ON HUMAN
PERFORMANCE?
Human beings are fallible, they make
mistakes, and even with the best intentions
something can invariably go wrong.
“People know the right thing to do for
any situation in three ways.” First, instinct
triggers automatic responses. This is a fixed
reaction ’hard wired’ in the human mind that
elicits a special response, such as the dilation of
the eyes as one walks into bright sunlight. No
learning is required. Second, a suitable response
is determined by learning either by education,
by trial and error, or from others' experiences.
Examples include reading a book on finances,
learning to ride a bicycle, reading operating
experience reports, or learning the expectations
of a new employer or work group. Finally,
thinking is a process of building idea upon idea
to make sense of a situation. Thinking gathers
data to generate cues that may help a person
recognize a familiar pattern about what to do.
Thinking generates new ideas coupled with new
knowledge leads to better understanding [5].
The skills, knowledge and attitudes of
individuals take time to change. It is for this
3. STEVEN M. KONCZ
3
reason that effective barriers must be put in
place. Managers implement and strengthen
defenses, they reinforce error-prevention
techniques and maintain the standards and
expectations for staff.
All WANO member nuclear plants must
aspire to the following human performance
objective;
"The behaviors of all personnel result in
safe and reliable station operation. Behaviors
that contribute to excellence in human
performance are reinforced to continuously
strive for event-free station operations" [2].
The criteria contained within this
performance objective are assessed during peer
reviews and its effectiveness reported. There
are two Nuclear Plant Event (NPE) definitions
associated with human performance.
- NPE08, “Human error which degraded
nuclear safety related systems”
- NPE09, “Human error which could have
degraded nuclear safety related systems”
If you look at the timeframe of when human
performance error prevention was introduced and
concentrate on the years 1992 to 2006, it is
interesting to see the reduction in events at U.S.
nuclear plants. This is shown in Fig. 2. [6]
Fig. 2. Significant Events at U.S. Nuclear Plants:
Annual Industry Average, Fiscal Year 1992-2006 [6]
Significant Events are events that meet
specific NRC criteria, including degradation of
safety equipment, a reactor scram with
complications, an unexpected response to a
transient, or degradation of a fuel or pressure
boundary. Significant events are identified by
NRC staff through detailed screening and
evaluation of operating experience.
V. ERROR PREVENTION TECHNIQUES
& BARRIERS
In order to understand which error
prevention techniques are most applicable, one
must first understand what enablers can
contribute to errors.
12 main error enablers were identified
and focused on as shown in Table I [7].
Table I. The Error Enablers
Time Pressure Distractions/Interruptions
Fatigue/High
workload
Inexperience/Lack of
knowledge
Complacency Poor communication
Stress Lack of assertiveness
Resource planning Lack of Teamwork
Lack of awareness Norms
Plant trip risk procedures were assessed
and each error enabler considered for the
current task. Suitable barriers were then applied
and reviewed in action.
Barriers
There are many barriers to prevent
things from going wrong, they can be
Organisational, Procedural and Physical. The
most important aspect is all barriers set by
management are reinforced at every
opportunity. It would be their expectation for
4. HUMAN PERFORMANCE IN THE NUCLEAR INDUSTRY
4
staff to adhere to procedural usage,
encouraged to have a questioning attitude and
to stop when they are unsure.
Organisational
The organisational barriers are the ones
embedded within the company’s systems. This
makes it less likely that a plant modification
occurs without drawing changes being in place
coupled with operational and maintenance
procedures. There are many interconnected
systems that will not allow the next step to take
place until it is satisfied all the key elements to
a successful outcome are met. This cascades
down to the competency levels of the person
writing the work order instruction.
The organisational barriers can contain
latent errors. These are hidden deficiencies in
the process or values that provoke an error or
cause the defense to break down. The
organisation also influences the culture at its
locations through the reinforcement of its
standards and expectations. People are
encouraged to work in a blame free culture but
not to the extent where they are unaccountable
for their actions. One of the main organisational
barriers which sets the benchmark for all
expectations is training. Shortfalls in training or
a lack of training reduces the effectiveness of
the understanding of what is required.
Procedural
There are many procedural barriers in
common use across industry. They hold the
individual responsible for their use. The
following typical work task and barriers used
will highlight possible areas for concern.
A work task can be broken down into 3
areas; Pre-work, Work and Post work.
Pre-work – The barrier used at this point
is the Pre-Job Briefing. Pre-work discussions
are carried out when there is potential to impact
on safety. Everyone associated with the work is
involved. The roles and responsibilities are
defined. The critical tasks and each step
identified. The work instructions and
procedures are verified and common
understanding checked. This barrier use may be
mandatory depending on the task.
Using prior knowledge, operational or
maintenance can be utilised at this point. It
demonstrates we are prepared to learn from past
experience and use it effectively. Prior
knowledge can be in database format or
personal experience. Whatever method is used,
it should capture previous incidents and near
misses.
Stop, Think, Act, Review (S.T.A.R.) or
Take 2 / 5 minutes to assess the work area are
part of the self checking barrier. This can be
formalised by filling in a check sheet to
demonstrate its use. Confirmed
communications is essential use at this point, to
ensure the correct plant item is worked on.
It is evident the individual plays a major
part in effectively utilising the barriers. If they
have not taken personal ownership of the
process and endeavor to use it, there is scope
for errors occurring. When people work around
these barriers there is scope for error.
Work – The barriers used at this point
can contain mandatory actions, depending on
the work instruction. Mandatory actions
typically occur during the verification
practices such as Peer Checking, Independent
Verification or Concurrent / Simultaneous
Verification. Confirmed communications is
also crucial during the work to exchange the
right information at the right time. Place
keeping is another specific barrier employed
during critical tasks to ensure the correct
action is made at the right step. Task
Observations are carried when work is taking
place. This is an opportunity to carry out a
formal or informal review of the complete
scope of works. It is a business improvement
tool, used to capture the safety culture
5. STEVEN M. KONCZ
5
surrounding the task. A formal study of the
work process also checks the standards &
expectations are being met.
Post work – This is an area where a Post-
Job Review takes place to determine if there are
any areas for improvement or worthy of note
for the next time. Using this barrier enhances
the operating / maintenance experience data
gathering and can lead to further training,
where appropriate. It is also a documented
opportunity to facilitate continuous
improvement processes.
Physical
Physical barriers are the ones which
prevent entry to areas that require specific access
permissions. The permit for work system is the
procedural aspect that controls this type of
barrier. Boundary enclosures and containment
buildings fall into this category also.
All of the barriers discussed were utilised
in specific ways in the British Energy, Human
Performance Awareness Workshops. Similar
barriers are used in WANO member nuclear
power facilities, they are shown in Table II. [7].
Table II. Error Prevention Tools
Pre-Job Briefing Use of Operating
Experience
Procedural Use and
Adherence
Self checking
(S.T.A.R.)
Questioning Attitude
(Stop When Unsure)
Peer-Checking
Independent
Verification
Clear Communication
Techniques
Post-Job Brief Task Observation
VI. ERROR PREVENTION THE NEXT
STEP
It is well recognised that human
performance error prevention hinges on the
behaviour of individuals. It is this behaviour
which drives them to implement the error
prevention tools or choose not to utilise them.
Self ownership of the processes and
methodologies employed to prevent error are
essential. Observing these behaviors can take
place at the point of work or checked remotely
through documented evidence of the barrier
being used.
If we look at the point of work risk
assessment Take 2, which encourages the person
to take two minutes and review the potentials for
error, the documented evidence can take the
form of a tick sheet. This barrier is open to any
one of the error precursors stopping it from
taking place, such as time pressure, complacency
or high workload. If no one double checks it
took place, it could lead to an event. Adding in
an error prevention tool such as Independent
Verification (I.V.), would make this process
more robust. It would only lengthen the risk
assessment time slightly and possibly take three
minutes with independent verification taking
place or Take 3 and I.V. Although this could
depend upon the working party numbers, it could
be planned into the work pack. This is an
example of behaviour being observed and an
additional barrier put in place.
Since people choose their behaviour at
any given time, it is perhaps worth using the
questioning attitude barrier but applying it to
oneself prior to engagement with the task. A
prompt to make the person think how their
behaviour will affect the task. A very simple
example is will I rush this job if I start it 30
minutes from meal time or end of shift? If a
behaviour check is covered before a critical
task, it may lead to the understanding that they
could be distracted due to a personal issue
playing on their mind. Carrying out a formal
self behaviour check is another way to enhance
the error prevention process.
In the age of personal data devices and
WiFi interconnectivity, there is now scope for
6. HUMAN PERFORMANCE IN THE NUCLEAR INDUSTRY
6
central databases with operating experience and
error prevention tools to be available at the
point of work, hazardous areas obviously
excluded.
VII. CONCLUSION
Management commitment to focus on
human performance, in particular error
prevention and effective incident barriers, were
the catalysts to improvements in this area.
Through external peer reviews and
benchmarking current best practices, the UK
nuclear industry took a collaborative approach
to bring their power stations up to the expected
standards. They continue to maintain those
standards and strive to exceed expectations.
There are select businesses which invest
directly in their staff by focusing on their innate
human ability to make mistakes and how to
take steps to prevent them from occurring.
Within a rational, unified, goal-seeking
organisation, business improvement must have
an understanding of human performance. It is
this understanding that can lead to improved
business operations. Trending of human
performance errors should form part of the key
performance indicators (KPI’s). This data can
be derived from a robust route cause analysis
process, which is performed by suitable
qualified experienced persons.
Refreshing and repackaging the use of
the error prevention tools, is essential for the
success of the process and also facilitates
continuous improvement. Readdressing how the
barriers are used in particular situations can
contribute to the As Low As Reasonably
Practicable (ALARP), process.
A formal behaviour self check, will make
people think of additional barriers to use
dependent upon how they may feel on the day.
Only they truly know what is going on in their
own mind.
To avoid complacency with the known
error prevention tools in use, revisiting all
methodologies used and looking for ways to
improve are advised. Reviewing when things go
right as well as wrong should also be trended to
capture good practices for replication.
ACKNOWLEGEMENTS
The author would like to thank Ms Liesa
Platten, of Synergy, Perth and Mr Joe Wade
Human Performance Engineering Pty Ltd,
Mandurah for independent verification of the
readability of this document.
REFERENCES
[1]. Institute of Nuclear Power Operations,
Excellence in Human Performance, INPO,
Atlanta, 1997.
[2]. World Association of Nuclear Operators,
Principles for Excellence in Human
Performance, WANO-GL 2002-02, 2002.
[3]. The ARUP Journal 1/2006 Table 2, pg 15,
2006.
[4]. International Atomic Energy Agency,
Managing Human Performance to Improve
Nuclear Facility Operation, No NG-T-2.7, pg 1,
2013.
[5]. Practical Thinking, Edward de Bono, pg 11- 17,
1971.
[6]. Nuclear Regulatory Committee (NRC)
Information Digest, 2006.
[7]. British Energy Group PLC, Human
Performance Awareness Workshops, 2003.
8. CODES FOR NPP SEVERE ACCIDENT SIMULATION…
8
Table I. Codes developed at IBRAE RIAN in cooperation with Russian and foreign institutions
Emergency stage Basic IBRAE RAN codes Partners
Early stage of reactor core degradation
SVECHA, QUENCH,
MFPR
NRC/IPSN/EC
FZK/RIAR
Late stage of reactor core degradation CONV2D&3D LOHEY OECD/RRC KI/ IPSN
Interaction of melt with concrete and
catcher
RASPLAV/SPREAD SPbAEP, NITI, AEP
Containment mechanics CONT REA/AEP, NRC/DOE
Thus, in the late 1990s, the works on
development of the Russian code for safety
analysis of new designs of NPP with VVER in
conditions of severe accidents were started
upon the initiative of JSC "SPbAEP" in
cooperation of expert teams from IBRAE RAN,
Russian Federal Nuclear Center “All-Russian
Research Institute of Experimental Physics”
(FSUE RFNC VNIIEF) and National Research
Center «Kurchatov Institute» (NRC KI). Later,
this code, which received the name SOCRAT,
started to be applied also for safety assessment
of the VVER projects operated or constructed
in Russia. In 2010, the basic version of the code
SOCRAT was certified by the Russian
regulator (Rostehnadzor). Since 2011, the work
has been conducted on developing and
validation of the advanced version of the code
that allows assessments of the radiological
consequences of severe accidents. The quality
of the models and validation allow considering
the SOCRAT as a best-estimate code.
Integration of numerous physical models into
one code provides end-to-end modelling of all
essential stages of severe accidents and
obtaining of the entire picture of the accident
evolution from a moment of its occurrence
(initiating event) up to release of radioactive
fission products out of the NPP containment
into the environment.
Thermohydraulic models of the
integrated code SOCRAT describe the behavior
of the two-phase coolant with non-condensable
gases in the core, primary and secondary
circuits of a reactor installation at all stages of
severe accident including stage of total core un-
cover and stage of in-vessel melt retention.
They include the various modes of coolant
flow, interphase interactions, various modes of
heat exchange with walls of hydraulic channels,
friction at channel walls, presence of non-
condensable gases, coolant ejection under
containment. Also, the models of the SOCRAT
code allow describing the operation of pumps,
valves, hydraulic reservoirs and other elements
of reactor installation equipment. The set of the
basic elements used to model the input deck of
the primary and secondary circuits, allows
describing the tracing of any hydraulic loops
with the accuracy that is sufficient for modern
calculations of severe accidents.
Thermohydraulic processes in a system
of communicating containment rooms in are
modelled self-consistently using the integrated
in SOCRAT containment codes KUPOL-M and
ANGAR, representing the certified codes with
lumped parameters.
Physical mutually-consistent models
describing the processes of fuel cladding
9. ARKADIY E. KISELEV
9
oxidation by steam, thermomechanical behavior
of fuel rods and absorbers, melting of reactor
core and other in-vessel materials, melt
relocation are used for numerical analysis of
severe accidents at a stage of reactor core
degradation. While doing this, the real material
composition of the reactor core is being taken
into account.
Code SOCRAT allows modelling the
processes of melt interaction with water at a
stage of melt retention in the lower plenum,
formation and distribution of a corium liquid
phase, stratification of metal and oxide
components, reactor pressure vessel
degradation and melt release into containment.
The basic NPP objects that are modelled
by the code SOCRAT in the advanced version
are presented in Fig. 1. They are as follows:
- Fuel;
- Fuel assemblies;
- Reactor core and in-vessel structures;
- Reactor coolant system including safety
systems;
- Steam generator and main steam line;
- Containment.
Fig. 1. Phenomena modeled in SOCRAT
10. CODES FOR NPP SEVERE ACCIDENT SIMULATION…
10
Fig. 2. Main processes simulated in the layer of homogeneous melt
The basic physical models of the
integrated code SOCRAT at in-vessel stage of
accident are presented below:
The advanced version of the integrated
code SOCRAT allows carrying out calculations
of parameters required for assessing the
radiological consequences of severe beyond
design-basis accidents at NPP with VVER
reactors and, in addition to the basic version,
describes in details the following processes:
- Buid-up of radioactive fission products
(FP) in fuel and their release into the fuel rod’s
gas gap;
- Transport and sedimentation of
radioactive fission products in various physical
and chemical forms in the reactor primary
circuit and in the containment;
- Release of radioactive fission products
into environment.
Permanent validation of the SOCRAT
code as well as of its physical models is one of
the most important stages of the development
and application. Models and algorithms of the
SOCRAT code have passed all-round
assessment against large data set, received in
separate effect tests and integral experiments
performed in Russia and abroad.
The experimental programs that were
used for the code validation are as follows:
CORA, QUENCH (Germany), PHEBUS
(France), RASPLAV, MASCA (Russia -
OECD), ISTC/PARAMETER, ERCOSAM-
SAMARA (joint Rosatom-Euroatom project),
LOFT, PBF, international standard problem
ICSP MASLWR, international benchmark
BSAF (analysis of the accident at the
Fukushima Daiichi NPP).
Fig. 3 shows the calculated and measured
temperatures of the surface of the fuel assembly
simulator in the PARAMETER/SF1
experiment. The PARAMETER program
investigates phenomena associated with re-
flooding of a degrading VVER like core under
postulated severe accident conditions, in an
early phase when the geometry is still mainly
intact. The figure confirms that the SOCRAT
code correctly reflects the dynamics of the fuel
assembly temperature behavior at all stages of
the experiment (heating up, oxidation, and
overheated core re-flood) under conditions of
the presence of chemical power sources and
convection and radiation heat exchange. This
results from a sufficiently large set of models of
SOCRAT code and their validation in a wide
range of initial data.
11. ARKADIY E. KISELEV
11
Fig. 3. Modeling of fuel assembly temperature behavior in the PARAMETER/SF1 experiment /2/
Other example of SOCRAT validation is
participation in cooperation with JSC «OKB
“GIDROPRESS”» at all stages of the
international standard problem (ISP)
«Evaluation of Advanced Thermohydraulic
System Codes for Design and Safety Analysis
of Integral Type Reactors». In this exercise, an
accident with a feed-water loss in the secondary
circuit (test SP2) and a maneuvering mode of
the reactor operation (test SP3) were
investigated in a series of two integrated
experiments on scale model of perspective
reactor MASLWR with passive safety systems.
Comparison of the calculated and measured
pressures of the primary circuit and
temperatures in containment for the SP2 test is
demonstrated in Fig. 4а. The close agreement
between the experimental and calculated data
testifies the correct and consistent work of
models of coolant flow and heat exchange in
the presence of non-condensable gases that is of
special importance for a reactor installation
with passive safety systems. Fig. 4b presents
the coolant temperature at the entrance to
reactor core and its flow rate for the SP3 test.
Modelling of this test resulted in a good
agreement with the results of measurements of
not only temperature, but also flow rate
parameters of two-phase coolant of the primary
circuit in the natural circulation mode. As a
whole, the SOCRAT code is capable to
simulate the thermohydraulic behavior of a
reactor installation even prior to the beginning
of essential reactor core degradation.
a) b)
Fig. 4. Modelling of the primary circuit pressure and containment temperature in the SP-2 test (a) and the
primary circuit coolant temperature and its flow rate in the SP-3 test (b)
0 2000 4000 6000 8000 10000 12000 14000 16000
Time, s
0
400
800
1200
1600
2000
2400
2800
Temperature,K
Cladding
2nd
row 1250mm
Experiment_2212,5
Experiment_2412,5
Experiment_2512,5
SOCRAT
ICARE
RELAP
MAAP4
12. CODES FOR NPP SEVERE ACCIDENT SIMULATION…
12
The code went through the practical test
and approbation in 2011, when a severe
accident stroke the Japanese NPP “Fukushima-
Daiichi” on March 11. The express analysis
was conducted at IBRAE RAN using the
integral SOCRAT code /3/. The possible
consequences of the accident, the forecast and
characteristic times of emergency process
development in reactor cores and SNF pools for
the power units 1-4 were estimated /Fig.5/.
Unit # SOCRAT Timing Real timing
1 12.03 16:25 12.03 15:36
2
(peak of pressure in containment after water ingression
in the core)
15.03 05:45 15.03 06:14
3 14.03 08:00 14.03 11:01
4 15.03 21:00 15.03 06:00
Fig. 5. Estimated amount of hydrogen generated at Unit 3 by the time of explosion
The following sequence of processes was
analyzed:
- Decrease of the coolant level in reactor
core;
- Increase of containment pressure;
- Temperature increase and hydrogen
generation;
- Release of hydrogen and fission
products;
- Further degradation of reactor core.
Fig. 5 shows the calculated and real
moments of hydrogen explosion at different
units. Comparison of the calculated and
measured data for the mass level of coolant in
the reactor core of the Unit 2 and for the
pressure in the primary circuit for the Unit 3 is
shown in Fig. 6. The figure demonstrates that
the SOCRAT code qualitatively describes the
processes of heating, degradation and
reflooding of reactor core. The calculations
were based on the assumptions that the power
of decay heat release corresponded to the
typical BWR project, and data on water
13. ARKADIY E. KISELEV
13
injection in the reactor coolant system and on
safety system operation corresponded to
TEPCO evidences that were available at the
time of the accident.
a) b)
Fig. 6. Comparison of the operational characteristics of the BWR-4 reactor installation measured during the
accident at the NPP Fukushima Daiichi with those calculated using the SOCRAT code: (a) Change of a water
level in the reactor core of 3rd
power unit; (b) Change of pressure in the primary circuit of 2nd
power unit
IBRAE RAN has continued this work by
joining the OECD-NEA Benchmark Study of
the Accident at the Fukushima Daiichi Nuclear
Power Station (BSAF) Project conducted by
Tokyo Engineering Power Company (TEPCO)
and the Nuclear Energy Agency of the
Organization for Economic Co-operation and
Development (NEA/OECD).
Today SOCRAT code is widely used
by the leading Russian design and scientific
organizations for analysis of beyond design-
basis severe accidents at NPP with reactors
on thermal neutrons with water coolant, for
assessment of hydrogen safety, efficiency of
melt retention systems, and for analysis of
efficiency of NPP passive safety systems.
The typical thermohydraulic model of the
primary circuit of VVER-1000/В-320 reactor is
presented in Fig. 7. It allows a quite detailed
modeling of beyond design-basis accidents with
loss of coolant in the primary circuit in a wide
range of locations and diameters of leaks.
The full list of the SOCRAT code
applications is quite wide. It can be noted that it
is used for the following units with VVER
reactor: VVER-440/230 (Kola NPP), VVER-
1000/В320 (the Balakovo NPP), VVER-
1000/В428 (China), VVER-1000/В412 (India),
VVER-1500/В448, VVER-1200/В392м
(NVNPP-2), VVER-1200/В491 (LNPP-2).
Presently, the code is used at SPbAEP,
AEP, OKB GP, NRC KI, IPPE, and is
transferred to MPEI as a tool of training of
students and post-graduate students.
In 2012, IBRAE RAN experts prepared
and conducted a course of lectures for the
Vietnamese specialists that were trained at the
Central Institute for Advanced Training
(TsIPK) Obninsk, Russia: Training course:
“Application of computer codes for safety
analysis of NPPs. Deterministic Safety Analysis
and code SOCRAT”. This course included 2
weeks of 96 hrs training. Of them, the lectures
took about 55 hrs, practical work - 41 hrs, and
one day was devoted to testing.
14. CODES FOR NPP SEVERE ACCIDENT SIMULATION…
14
Fig. 7. Typical nodalization scheme of VVER-1000 reactor installation with passive safety systems used in the
SOCRAT code
The further development of the SOCRAT
code includes the following:
1. Improvement of the current version of
the integrated code SOCRAT, participation in
international benchmarks in order to verify the
code, adaptation of physical models and
computing algorithms for various designs of
reactors with thermal neutrons and water
coolant, preparation and training of new users.
2. Development of the new version of the
integrated code SOCRAT-BN for modelling of
physical processes in reactors with fast neutrons
and sodium coolant, that is being done based
upon practical experience received by the
IBRAE RAN.
REFERENCES
[1]. Bolshov L., Strizhov V., Kisselev A. Severe
accident codes status and future development. //
Nuclear Engineering and Design, v. 173,
P.247-256, 1997.
[2]. M. Steinbrück, J. Birchley, A.V. Boldyrev,
A.V. Goryachev, M. Grosse, T.J. Haste, 1, Z.
Hózer, A.E. Kisselev, V.I. Nalivaev, V.P.
Semishkin, L. Sepold, J. Stuckert, N. Vér and
M.S. Veshchunov, High-temperature oxidation
and quench behaviour of Zircaloy-4 and E110
cladding alloys // PROGRESS IN NUCLEAR
ENERGY Volume: 52 Issue: 1 Pages: 19-36
Published: JAN 2010.
[3]. Dolganov K.S., Kapustin A. V., Kisselev A. E.,
Tomashchik D. Yu., Tsaun S. V., Yudina T. A.,
Real-Time Calculation of the Accident at the
Fukushima-1 NPP (Japan) Using the Sokrat
Code//ATOMIC ENERGY Volume: 114 Issue: 3
Pages: 161-168 Published: JUL 2013.
16. CALCULATION OF EXCORE DETECTOR WEIGHTING FUNCTIONS…
16
[1] or the current PGSFR design [3][4].
Especially, the BFS-76-1A, which stands for
the current PGSFR core, is a mockup of 300
MWe class TRU burner design without a
blanket, simultaneously loaded with uranium
and U-Pu metal fuels, and characterized by a
low conversion ratio, a high burnup reactivity
swing, and the consequent deep insertion of the
primary control rods at the beginning of the
equilibrium cycle. Reactor physics experiments
in the BFS-76-1A were aimed to obtain
measured data on critical mass, spectral indices,
fission rate distribution, sodium void and axial
expansion effects, and control rod mockup
worth. In particular, the information on control
rod mockup worth is very important and
requires careful evaluation because of its safety
implications.
For that reason, a dynamic rod worth
simulation method applicable to SFRs needs to
be developed and then applied to the BFS-76-
1A for validating the measured control rod
mockup worths. To simulate the pseudo excore
detector signals needed for inferring the
dynamic worth of control rods during the rod
drop experiments, the excore detector spatial
weighting functions which represent individual
contributions from specific core locations, i.e.,
fuel assemblies, fuel rods or portions of rods,
to the detector signal are required in advance
[5-8]. It should be noted that the power
regulation system of a fast reactor is based on
the signals of excore neutron detectors. The
detector signal contribution from each fuel
assembly depends not only on the power of the
fuel assembly but also on its position in the
core. The excore detector spatial weighting
functions establish correspondence between the
spatial core power distribution and the signal
of excore detectors.
In this paper, the excore detector spatial
weighting functions for the BFS-76-1A were
calculated and evaluated for further use in the
dynamic rod worth simulation. For generation
of the spatial weighting functions, all fuel
assemblies were considered and each of them
was divided into ten horizontal layers. Then the
spatial weighting functions for individual fuel
assembly horizontal layers at RCP (Reactor
Critical Point) and at the condition under
which one control rod group was fully inserted
into the core while other control rods at RCP
were determined using the MCNP5 150-group
adjoint calculations and inter-compared. The
results show that the spatial weighting
functions were relatively insensitive to the
control rods position during the rod drop
experiments and therefore those weighting
values at RCP can be applied in the dynamic
rod worth simulation for the BFS-76-1A.
The calculation methodology is
presented in Section II. The results are
provided and discussed in Section III. Finally,
concluding remarks are drawn in Section IV.
II. CALCULATION METHODOLOGY
The BFS-76-1A mockup consists of 326
LEZ-Pu assemblies, 488 LEZ-U assemblies,
322 HEZ-Pu assemblies, 648 HEZ-U
assemblies, and the outer layers of relector,
B4C shield, and radial shield assemblies as
shown in Fig. 1, where two excore neutron
detectors were located outside the radial shield
and symmetrically in the radial direction for
this study (In Fig. 1: 101= LEZ-Pu; 201=
LEZ-U; 301= HEZ-Pu; 401= HEZ-U; 501,
601= primary, secondary control rods; 701=
reflector; 801= radial shield; 901= B4C shield;
10= void; LEZ and HEZ= Low and High
Enrichment Zones). In the vertical direction,
each detector is located ~10 cm above the
bottom of the active core. The detectors are the
17. PHAM NHU VIET HA, MIN JAE LEE, SUNGHWAN YUN, SANG JI KIM
17
BF3 proportional counters. They are cylinders
of BF3 with a radius of 2.5 cm and a height of
40 cm. The cylinders are covered by a
polyethylene moderator layer with a thickness
of 5.0 cm to enhance the detector sensitivity.
The excore detector response at arbitrary
time t is defined by [6]
∫ (1)
where is the core power at position r
and time t; the spatial weighting function
at postion r; V the total core volume; it should
be noted that the unit of is arbitrary.
In practice, the spatial weighting
functions for the excore detectors can be
generated using either the point kernel method
[5], the discrete ordinate transport method [6],
or the Monte Carlo method [7][8]. It is noted
that an advantage of the Monte Carlo method is
the capability of modeling reactor
configurations with arbitrary geometrical
complexity. With the Monte Carlo method, one
can also choose either the forward method or
the adjoint method. The Monte Carlo forward
method allows the calculation of the weighting
function value of a given point in the reactor
and therefore gives more detailed results than
the adjoint method. Additionally, the forward
method makes it possible to avoid the
approximations which stem from the
homogenization of the cross sections of the
assembly material and from the use of group-
wise data. Nevertheless, since the calculation
of the weighting function is a fixed-source
neutron transport problem, the adjoint method
is much faster than the forward method.
Especially, it will be very time-consuming to
generate the weighting functions using the
forward method if a large number of the
specific core locations are taken into account.
Because of a much longer mean free
path of neutrons in fast systems (~10 cm as
compared to ~1 cm in PWRs), the neutrons
from both the innermost fuel assemblies and
the distant ones have higher possibility to leak
out of the core and be “seen” by the excore
detector. Thus, all fuel assemblies of the BFS-
76-1A (1784 assemblies) were taken into
account for calculating their contributions to
the detector response; whereas only the
contributions from the peripheral fuel
assemblies located close to the detector are
considered significant for PWRs. Therefore,
the Monte Carlo adjoint method, which is
much faster than the forward method as
discussed above, will be applied in the
calculation of the weighting functions for the
BFS-76-1A using the well known MCNP5
Monte Carlo N-Particle Transport Code
[9][10]. Based on the adjoint method, the
spatial weighting function is given by [6].
∫ (2)
where is the spatial weighting factor at
position ri, the fission energy spectrum,
and the adjoint flux at position ri and
neutron energy E.
For the calculation of the weighting
functions, each fuel assembly (FA) of the
BFS-76-1A (indexed by (i,j)) was divided
into 10 horizontal layers (each layer was
indexed by k, k = 1, 2, …, 10). Based on Eq.
(2), the three-dimensional spatial weighting
functions of each FA layer (i,j,k) for each
detector at RCP (Reactor Critical Point- at
which all secondary control rods were
withdrawn out of the core and all primary
control rods inserted into the core ~42% of
the core height) and at the condition under
which one control rod group (Group 1, 2, or
18. CALCULATION OF EXCORE DETECTOR WEIGHTING FUNCTIONS…
18
3; see Fig. 1) was fully inserted into the core
while other control rods at RCP (hereafter
called the case G1IN, G2IN, or G3IN
respectively) were generated (using the
MCNP5 150-group adjoint calculations) and
normalized over the whole core by
∫
∑ ∫
∑
∑ ∑
(3)
where is the fission spectrum at energy
group g and the adjoint flux at the FA
layer (i,j,k) at energy group g. Thereafter,
these weighting functions were averaged
over the two symmetric detectors to relieve
the effect of core radial position on the
detector response. In the MCNP5 150-group
adjoint calculations, the neutron microscopic
cross-sections for 150 neutron energy groups
from the ENDF/B-VII.0 library were used.
To simulate the rod drop experiments, it
is expected that a set of the spatial weighting
functions insensitive to the control rods
position can be generated. On that account, the
Assembly Weighting Functions (AWFs) and
Axial Weighting Functions (also called the
Shape Annealing Functions or SAFs) at RCP
and at G1IN, G2IN, or G3IN were determined
and inter-compared so as to select an
appropriate set of the spatial weighting
functions for the dynamic rod worth
simulation. The reason for the evaluation of the
AWFs and SAFs instead of the three-
dimensional weighting functions generated
using Eq. (3) is explained as follows.
Because the three-dimensional spatial
weighting functions were calculated using
MCNP5 and a very large number of FA layers
were considered herein (1784 x 10 = 17840
layers), it is not intuitive and extremely time-
consuming to compare these weighting
functions (17840 values for each set of
weighting functions) at different control rod
positions, such as at RCP and G1IN. Instead,
the AWFs and SAFs at RCP and at G1IN,
G2IN, or G3IN, were determined and inter-
compared.
The AWF for the FA (i,j) which
represents the detector response contributions
from individual FAs is calculated by Eq. (4).
∑ (4)
The SAF for the core layer (k) which
represents the relative importance of core axial
position to the detector response is calculated
by Eq. (5).
∑ (5)
III. RESULTS AND DISCUSSION
The AWFs for the excore detector at
RCP were illustrated in Fig. 2. The relative
differences of AWFs at RCP and at G1IN,
G2IN, or G3IN were provided in Figs. 3-5. The
SAFs at RCP and G1IN, G2IN, or G3IN were
shown and compared in Figs. 6-8. It is noted
that all the spatial weighting functions were
obtained, in this study, with a relative error
(fractional standard deviation) of less than
~0.035 (3.5%), provided the number of
histories to be run in the MCNP5 calculations
of a billion.
Fig. 2 signifies that the contributions
from the internal fuel assemblies or distant
ones must be taken into account for an accurate
prediction of the detector response. It can be
seen that the weighting function decreased
from the outermost fuel assemblies close to the
detector towards the innermost fuel assemblies
or those located further from the detector; for
instance, it was reduced about one order after
~10 layers of fuel assemblies.
19. PHAM NHU VIET HA, MIN JAE LEE, SUNGHWAN YUN, SANG JI KIM
19
From Figs. 3-5, it can be found that
the relative difference between AWFs at
RCP and at G1IN, G2IN, or G3IN was on
average less than ~2.5% for the outer fuel
assemblies or those close to the detector
whereas it could reach up to ~22/39/49% for
a few inner assemblies located near the
dropped control rods (G1IN/G2IN/G3IN,
respectively). However, such difference of
at most ~22/39/49% can be practically
neglected in the calculation of the detector
response because the detector response
contributions from these inner assemblies
near the dropped control rods were at least
about one order smaller than those from the
assemblies located near the excore detector
(see Fig. 2).
Figs. 6-8 show that the SAFs have a
bottom-peaked shape because the two
symmetric detectors were axially located just
~10 cm above the active core bottom (the
length of excore detector is 40 cm whereas the
active core height is ~82.144 cm). As is seen in
those figures, the SAF at RCP slightly
overestimates that at G1IN/G2IN/G3IN for the
core axial position below RCP and vice versa
for the core axial position above RCP.
Generally, the relative difference of SAFs at
RCP and at G1IN, G2IN, or G3IN was within
at most 1.8% and can be neglected.
Hence, it was practically considered that
the spatial weighting functions are relatively
insensitive to the control rods position during
the rod drop experiments and those values at
RCP can be applied in the dynamic rod worth
simulation for the BFS-76-1A.
Fig. 1. BFS-76-1A radial core layout
20. CALCULATION OF EXCORE DETECTOR WEIGHTING FUNCTIONS…
20
Fig. 2. AWFs at RCP (up) and a partial zoom-in (down), x10-2
21. PHAM NHU VIET HA, MIN JAE LEE, SUNGHWAN YUN, SANG JI KIM
21
Fig. 3. Relative difference of AWFs at RCP and G1IN (up) and a partial zoom-in (down), %
22. CALCULATION OF EXCORE DETECTOR WEIGHTING FUNCTIONS…
22
Fig. 4. Relative difference of AWFs at RCP and G2IN (up) and a partial zoom-in (down), %
23. PHAM NHU VIET HA, MIN JAE LEE, SUNGHWAN YUN, SANG JI KIM
23
Fig. 5. Relative difference of AWFs at RCP and G3IN (up) and a partial zoom-in (down), %
24. CALCULATION OF EXCORE DETECTOR WEIGHTING FUNCTIONS…
24
Fig. 6. SAFs at RCP and G1IN and their relative
difference (%)
Fig. 7. SAFs at RCP and G2IN and their relative
difference (%)
Fig. 8. SAFs at RCP and G3IN and their relative
difference (%)
IV. CONCLUSIONS
The excore detector spatial weighting
functions for the BFS-76-1A were generated
using the MCNP5 150-group adjoint
calculations and evaluated in this study. For
generation of the weighting functions, all fuel
assemblies were taken into account and each of
them was divided into ten horizontal layers. To
choose an appropriate set of the spatial
weighting functions for further use in the
dynamic rod worth simulation for the BFS-76-
1A, the assembly weighting functions and the
shape annealing functions at RCP (Reactor
Critical Point) and at the condition under
which one control rod group was fully inserted
into the core while other control rods at RCP
were determined and inter-compared instead of
extremely large numbers of the calculated
three-dimensional weighting functions. The
results indicate that the weighting functions
were relatively insensitive to the control rods
position during the rod drop experiments and
consequently those weighting values at RCP
can be applied in the dynamic rod worth
simulation and evaluation for the BFS-76-1A.
In future work, a dynamic rod worth simulation
study based on those spatial weighting
functions will be performed for validating the
measured rod worths of the BFS-76-1A.
Finally, this work provides a basis for
generation and evaluation of the excore
detector spatial weighting functions for a SFR
and will be applied for further analysis of the
detector response aimed at evaluating the
worth of control rods for safety design of the
PGSFR and at designing a robust neutron
flux/power monitoring system for the PGSFR.
ACKNOWLEGEMENTS
This work was supported by the
National Research Foundation of Korea (NRF)
grant funded by the Korea government (MSIP).
(No. NRF-2012M2A8A2025622).
-0.6
-0.4
-0.2
0.0
0.2
0.4
0.07
0.08
0.09
0.10
0.11
0.12
0 1 2 3 4 5 6 7 8 9 10 11
Relativedifference(%)
ShapeAnnealingFunction
Fractional core height
G1IN
RCP
difference
-0.8
-0.6
-0.4
-0.2
0.0
0.2
0.4
0.6
0.07
0.08
0.09
0.10
0.11
0.12
0 1 2 3 4 5 6 7 8 9 10 11
Relativedifference(%)
ShapeAnnealingFunction
Fractional core height
G2IN
RCP
difference
-2.0
-1.5
-1.0
-0.5
0.0
0.5
1.0
1.5
0.07
0.08
0.09
0.10
0.11
0.12
0 1 2 3 4 5 6 7 8 9 10 11
Relativedifference(%)
ShapeAnnealingFunction
Fractional core height
G3IN
RCP
difference
25. PHAM NHU VIET HA, MIN JAE LEE, SUNGHWAN YUN, SANG JI KIM
25
REFERENCES
[1]. D. H. Hahn et al., “Advanced SFR Design
Concepts and R&D Activities,” Nuclear
Engineering and Technology, 41(4), 427-446,
2009.
[2]. Y. I. Kim et al., “Preliminary Conceptual
Design Report of Gen-IV SFR Demonstration
Plant,” KAERI/TR-4335/2011, Korea Atomic
Energy Research Institute, 2011.
[3]. J. Chang, “Status of Fast Reactor Technology
Development in Korea,” The 45th IAEA
TWG-FR Meeting, Beijing, China, June 20-22,
2012.
[4]. H. Joo, “Status of Fast Reactor Technology
Development in Korea,” The 46th IAEA
TWG-FR Meeting, Vienna, Austria, May 21-
24, 2013.
[5]. M. W. Crump and J. C. Lee, "Calculation of
Spatial Weighting Functions for Ex-Core
Detectors," Nuclear Technology, 41, 1978, 87-
96, 1978.
[6]. J. G. Ahn and N. Z. Cho, "Generation of
Spatial Weighting Functions for Ex-core
Detectors by Adjoint Transport Calculation,"
Nuclear Technology, 103, 114-121, 1993.
[7]. T. Berki, "Calculation of Spatial Weighting
Functions for Ex-core Detectors of VVER-440
Reactors by Monte Carlo Method,"
International Conference: Nuclear Energy for
New Europe 2003, Portorož, Slovenia,
September 8-11, 2003.
[8]. G. Farkas et al., "Computation of Ex-core
Detector Weighting Functions for VVER-440
Using MCNP5," Nuclear Engineering and
Design, 261, 226-231, 2013.
[9]. X-5 Monte Carlo Team, "MCNP- A General
N-Particle Transport Code, Ver. 5 - Vol. I:
Overview and Theory," LA-UR-03-1987, Los
Alamos National Laboratory, 2003.
[10]. J. C. Wagner et al., "MCNP:
Multigroup/Adjoint Capabilities," LA-12704,
Los Alamos National Laboratory, April 1994.
27. LUONG MANH HUNG, TRAN NGOC VUONG
27
Cadmium dissolution: cadmium in the
cadmium containing residue is transferred to
solution by using dilute sulphuric acid
Cd + H2SO4 CdSO4 + H2 (1)
Other metallic impurities are dissolved in
the solution according to the reaction
Me + H2SO4 MeSO4 + H2 (2)
Purification of cadmium sulphate
solution: Adjust the pH of the obtained solution
to remove iron, aluminum by hydrolysis. Other
impurities such as Cu can be removed by
cementation using Cd powder:
Me2+
+ Cd Me + Cd2+
Electrolysis of cadmium sulphate
solution to obtain metallic cadmium:
Cathode reaction:
Cd2+
+ 2e-
Cd
Eo = -0.4V (3)
Anode reaction:
20H-
- 2e-
H20 + 1
/202
E0 = 1.23V (4)
Generally, electrolysis reaction of
cadmium sulfate solution can be discribed as
follows:
CdS04 + H20 Cd + H2S04 + 1
/202 - Q
(5)
During the electrolysis of an aqueous
solution of cadmium sulphate, metals more
electropositive than cadmium (e.g. Cu) will
plate at the cathode in addition to cadmium,
while zinc will not plate at the cathode due to
more electronegative (Eo = -0.76V) than
cadmium So the presence of zinc in the
solution has no significant effect on the quality
of cadmium obtained. Cadmium metal
produced by this method has a high purity (Cd
> 99%).
II. EXPERIMENTALS
A. Preparation of cadmium sulphate solution
Cadmium residues composition is mainly
Zn 13%; Fe 0.85%; Pb 0.25% and other
impurities such as Al, Ni, Cu, with very small
amounts. The residue will be dissolved by
sulphuric acid. Cadmium, zinc and some other
metallic impurities will be together dissolved
by sulphuric acid. The removal of Al and Fe
from the solution is easier by using hydrolysis
method, by adjusting pH of the solution to pH
5.2 - 5.4, Al and Fe precipitate as Al(OH)3 and
Fe(OH)3 then will be removed from the
solution. Ni and Cu can be removed by
cementation method. Zn will remain in the
solution. The optimum conditions for cadmium
dissolution are as follows:
- Solid/liquid ratio: 1/5.
- Concentration of sulfuric acid 140 g / l.
- Temperature: 700
C.
- Time of digestion: 4h.
Under these conditions, cadmium
recovery is up to 90%; The obtained cadmium
sulphate solution contains: Cd 80 g/L, Zn 20
g/L, the impurities such as Fe, Cu, Al, Ni are of
trace amount.
B. Cadmium electrolysis
The feed electrolyte was prepared as
discribed above. The cadmium Electrolysis was
studied with the experimental conditions are as
follows: The cathode current density 35-60
A/m2
; Concentration of in electrolyte feed 30-
70 g/l of cadmium, 90-150 g/l of free H2SO4;
Temperature of the electrolyte: 25-60 0
C and
gelatin concentration: 0 to 0.3 g/l.
Bench scale electrolysis was carried out
in a cell of inert plastic construction with
working volmes of 800 ml, using lead alloy
(Pb/Ca/Sn) anodes. Aluminum alloy (HS1A)
28. THE RECOVERY OF METALLIC CADMIUM FROM THE CADMIUM CONTAINING RESIDUE…
28
was used for the cathode. The cathode current
density was 35- 60A/m2
. Operating current was
calculated assuming a current efficiency of
80%. Cell voltage was approximately 2.4V in
all tests. The temperature during the tests
ranged from 25 to 60o
C.
Power to the cell was provided by a
constant current DC rectifier supply.
Electrolyte was fed continuous in to the
cell, and allowed to overflow to maintain a set
cathode immersion level and the cell was
operated for 4h in batch mode to bring the cell
contents to the spent electrolyte conditions for
continuous mode.
At the end of that time, the cathode was
removed, weighed and cleaned. The plated
cadmium was dried to determined the weigh
and the actual current efficiency and with that
information, the flow of electrolyte for the
continuous cycle was corrected.
The current efficiency was calculated by
using Faraday law of electrolysis. Faraday's
laws can be summarized by
H = mr / m
where:
m is the mass of the substance (theoretically)
liberated at an electrode in grams
mr is the practically obtained mass of the
substance at an electrode.
I is the constant current of electrolysis
F = 96485 C mol−1
is the Faraday constant
M is the molar mass of the substance ;
z is the valency number of ions of the
substance (electrons transferred per ion);
t is the total time the constant current was
applied;
H is the current efficiency .
For cadmium electrolysis, M=112.41g; z=2.
The plated cadmium at the cathode will
be analyzed by ICP-MS to determine the
contents of cadmium and other impurity
elements.
III. RESULTS AND DISCUSSION
A. Effects of organic additives
The effect of an organic additive gelatin
on the electrolysis of cadmium from acidic
sulfate solutions are studied.
Experimental conditions:
- Current density 50 A/m2
.
- Cadmium concentration in the electrolyte: 50 g/l.
- The concentration of free H2SO4 : 90 g/l.
- Temperature of electrolyte: 35 0
C.
Experimental results are presented in Figure 1.
CurrentefficiencyH,%
Concentration of gelatin, g/l
85
87
89
91
93
95
0 0.1 0.2 0.3 0.4
H
Fig.1: Effect of the concentration of gelatin to the current efficiency
29. LUONG MANH HUNG, TRAN NGOC VUONG
29
It is observed that addition of gelatin
increases the current efficiency and decreases
the energy consumption. Gelatin when present
in the solution polarizes the cathode causing the
electroreduction of cadmium at more negative
potentials. The presence of gelatin affects the
degree of crystallinity of the electrodeposits
indicating that the deposits are also more
ductile. Scanning electron micrographs of
cadmium deposits obtained in the presence of
magnafloc show that compact deposits are
formed with an instantaneous nucleation and
growth mechanism. It is evident that the
presence of gelatin decreases the number of
grains and increases the sizes of the crystallites.
Since cadmium is very prone to dendritic
deposition. The cadmium precipitate create
multiple spikes, thickness of the cadmium layer
are different. To overcome this drawback, a
small amount of gelatin can be added as a
surface-active substances into electrolyte
solution. From Figure 1, it is found that the
concentration of gelatin 0.1 g/l to achieve the
highest current efficiency. When the gelatin
concentration exceeds 0.1 g/l, the current
efficiency decreases due to reducing of
polarization.
B. Effect of cadmium concentration
Experimental conditions:
- Current density 50 A/m2
.
- Cadmiumconcentration in the
electrolyte solution: 30 - 80 g/l.
- The concentration of free H2SO4 : 90 g/l.
- Electrolysis temperature : 35 0
C.
- The concentration of gelatin: 0.1 g/l
Experimental results are presented in
Figure 2.
82
83
84
85
86
87
88
20 30 40 50 60 70 80 90
H
Fig. 2. The effect of cadmium concentration on the current efficiency
From Figure 2, we see that, when the
cadmium concentration in solution increased
from 30 to 60 g/l, the current efficiency
increases. When cadmium concentration is
higher than 70 g/l, the current efficiency does
not increase but somewhat diminished.
C. Effect of free acid concentration
Experimental conditions:
- Current density 50 A/m2
.
- Cadmiumconcentration in the
electrolyte solution: 50 g/l.
- The concentration of free H2SO4 : 90 -
150 g/l.
- Electrolysis temperature : 35 0
C.
- The concentration of gelatin: 0.1 g/l
Experimental results are presented in
Figure 3.
Concentration of Cd, g/l
Currentefficiency,%
30. THE RECOVERY OF METALLIC CADMIUM FROM THE CADMIUM CONTAINING RESIDUE…
30
88
90
92
94
90 100 110 120 130 140 150 160
H
From Figure 3, when increasing free acid
concentration, the current efficiency increased.
Maximum of current efficiency is reached when
H2SO4 concentration is about 120 g/l. When
further increasing the solution acidity, the
current efficiency decreased due to the
liberation of hydrogen. Hence the choice of free
concentration of H2SO4 in the electrolyte
solution is 120 g/l. The current efficiency
reached 93.20 %.
It was determined that working with a
solution in the feed of more than 30 g/L of
cadmium and between 100 to 120 g/L of
sulphuric acid, it was possible to obtain plated
cadmium without dendritic deposition and with
a higher current efficiency.
D. Effect of current density
Experimental conditions:
- Current density 35 - 60A/m2
.
- Cadmiumconcentration in the
electrolyte solution: 30 - 80 g/l.
- The concentration of free H2SO4: 90 g/l.
- Electrolysis temperature : 35 0
C.
- The concentration of gelatin: 0.1 g/l
Experimental results are presented in
Figure 4
84
86
88
90
92
94
30 40 50 60 70
H
H
Fig. 4. The effect of current density
From Figure 4, when changing current
density in the range of 35-50 A/m2
, the current
efficiency increased from 84.91% to 91.31%.
However, when the current density is up to 60
A/m2
, the current has also increased, but not
significantly. Hence the choice of current
Current density DK, A/m2
Currentefficiency,%
Currentefficiency,%
Concentration of H2SO4, g/l
Fig. 3. Effect of H2SO4 concentration to current efficiency
31. LUONG MANH HUNG, TRAN NGOC VUONG
31
density of 50 A/m2 for cadmium electrolysis
process is suitable.
Smooth cathode deposits of cadmium
were difficult to produce. This was attributed to
the nature of the electrolyte.
Progressive improvements were
however achieved and a better deposit was
obtained at higher current efficiency as
changes were progressively made to the
electrolyte acidity;
E. Effect of the temperature
Experimental conditions:
- Current density: 50 A/m2
.
- Cadmium concentration in the
electrolyte: 50 g/l.
- The concentration of H2SO4: 120 g/l.
- The concentration of gelatin: 0.1 g/l
Experimental results are presented in
Figure 5.
From Figure 5, when increasing the
temperature of electrolyte, the current
performance significantly reduced at
temperatures above 400
C. Heating the
electrolyte can increase electric conductivity,
increase the liberation of gases and reduce the
electric potential of electrolysis cells. But the
heating increases the electrolytic dissociation of
hydration ions, reduces dessired effect of
surface-active substances, therefore chemical
polarization can be reduced. Heating promote
diffuser, convection, hydrogen liberation and
leading to reducing current efficiency. Thus the
electrolysis temperature should be kept lower
than 400
C.
III. CONCLUSIONS
Based on the experimental results carried
out in this work, the optimum conditions for
cadmium recovery by electrolysis are as
follows:
- Current density : 50 A/m2
.
- Concentration of cadmium in the
electrolyte: 50 g / l.
- Concentration of H2SO4 : 120 g/l.
- Temperature : < 40 0
C.
- Concentration of gelatin: 0.1 g/l.
In the conditions listed above, the electric
current performance is 90% or higher.
Currentefficiency,%
Temperature, 0
C
Fig. 5. The effect of temperature to the current efficiency
82
84
86
88
90
92
94
20 30 40 50 60 70
H
32. THE RECOVERY OF METALLIC CADMIUM FROM THE CADMIUM CONTAINING RESIDUE…
32
REFERENCES
1. Dinh Pham Thai, Nguyen Kim Thiet. Theory of
metallurgical processes - Electrolysis, Viet Nam
education publishing house, Ha Noi, 1997.
2. Le Xuan Khuong, Truong Ngoc Than. Theory of
metallurgical processes - hydrometallurgical,
Viet Nam education publishing house, Ha Noi,
1997.
3. Phung Viet Ngu, Preparation of zinc, Publisher
University and vocational schools, Ha Noi,
1981.
4. Pham Xuan Kinh, Final report entitled "Study on
the recovery of rare elements: Cd, In the
intermediate residue of electrolytic zinc plant
Company in Song Cong – Thai Nguyen”, 2008.
5. Mohammad Sadegh Safarzadeha,b
, Davood
Moradkhania, b, c
, The electrowinning of cadimi
in the presence of zinc.Hydrometallugy, Volume
105, Issues 1-2, December 2010.
34. ION EXCHANGE RESIN SELECTION FOR CONCENTRATION AND PURIFICATION OF URANIUM...
34
UO2
2+
UO2(SO4) [UO2(SO4)2]2-
[UO2(SO4)3]4-
In conventional conditions of uranium
leaching by means of sulphuric acid, the
formation of [UO2(SO4)3]4-
complex is
favorable, concentration ratio [UO2(SO4)3]4-
/[UO2(SO4)2]2-
is 7/1 and [UO2(SO4)3]4-
/UO2(SO4) is 50/1. The higher the concentration
ratio SO4
2-
/U6+
in the solution the equilibrium
will be fowarded to increasing the
concentration of [UO2(SO4)3]4-
complex in the
solution. The ion exchange reaction between
resin and uranyl complexes occurs as follows:
4RCl + [UO2(SO4)3]4-
R4UO2(SO4)3 + 4Cl-
Additionally, the complex formation of
some impurities in the solution (eg. iron) can be
found, so the ion exchange reactions between
those complexes and resin can be occurred
depending on the impurity affinity and
concentration. Some other impurities that can
be adsorbed by resin under other mechanisms
(eg. aluminum).
Nitrate, sulphate and chloride solution
can be use for uranium elution.
III. ION EXCHANGE RESINS AND
URANIUM SOLUTION
Two types of ion exchange resin Indion
GS300 and Purolite A400 have been tested to
selecting an appropriate resin for the
concentration and purification of leaching
solution containing uranium.
A. Indion GS300
Indion GS 300 is a strong base Type I
anion exchange resin, containing quaternary
ammonium groups. It is based on crosslinked
polystyrene and has a gel structure with high
mechanical strength. GS300 is a product of Ion
Exchange Group, manufactured in India and
exported to the United States, Britain, Japan,
Russia, Thailand, Philippines, Malaysia and
others. Indion GS300 has a high exchange-
capacity, high mechanical strength and a good
regeneration efficiency. With a uniform particle
size, Indion GS300 is often used to high flow
rate solution. When saturated exchange resins
can be regenerated by means of sodium
chloride solution.
Table I. Indion GS300 characteristics
Polymer structure Crosslinked Polystyrene Divinylbenzene
Ionic form Cl-
, OH-
Total capacity 1.2 eq/l
Moisture retention 48 - 54%
Particle size range 16 - 50 mesh (0.3 - 1.2 mm)
Maximum temperature limit 70o
C
pH range 0-14
Shipping weight 640 g/l
B. Purolite A400
Purolite A400 (table II) is a strong base
anion exchange resin, containing quaternary
ammonium groups. It is based on crosslinked
styren-divinylbenzene and has a gel structure.
Purolite A400 is a product manufactured in
England.
35. LE QUANG THAI et al.
35
Table II. Purolite A400 characteristics
Polymer structure Polystyrene crosslinked with DVB
Functional groups Type 1 quaternary ammonium
Ionic form Cl-
Shipping weight 680 - 715 g/l
Specific gravity Approx. 1.08
Particle size range 16 - 50 mesh (0.3 - 1.2 mm)
Moisture retention 48 - 54%
Total capacity 1.3 eq/l
Maximum temperature limit 100o
C
According to the characteristics of the
above resins (total sorption capacity 1.2 - 1.3
eq/l, particle size 0.3 - 1.2 mm, maximium
temperature limit 60°C, etc.) the technical data
of these resins are similar to Amberlite IRA-
420 which has been used popularly for
treatment of uranium leaching solution.
Moreover, these resins are much cheaper (about
90,000 - 100,000 VND/kg) than Amberlite
IRA-420.
C. Leaching solution
Uranium solution for resin test is Palua
sandstone heap leach solution using sulphuric
acid as leaching agent; The uranium
concentration is 0.7 g/l, pH 1.3, Fe 6.4 g/l with
some other impurities.
IV. EXPERIMENT
In addition to comparing resin
characteristics, resin price, the authors have
focused on investigating the sorption capacity
of uranium and impurities (such as iron), the
sorption curve and elution curve for Palua
sandstone leaching solution.
The experiments to test the uranium
sorption capacity, impurities sorption capacity
and to establish sorption, elution curves have
been carried out on a single column of 2 cm
diameter, resin volume of 100 ml (bed volume
(BV) 100 ml). The resin preconditioning has
been made by using 2M sulfuric acid solution
and then washed with distilled water. pH of the
solution is adjusted to a predetermined value by
using NaOH diluted solution.
During the sorption stage, uranium
solution is pumped to the top of ion exchange
column, through the resin layer and flows to the
column bottom until the uranium concentration
in effluent solution equals to the concentration
of feeding solution. After the soption phase, the
resin layer is washed with a solution of sulfuric
acid 1/1000 (volume) for separating off the
feeding solution in the column. Then uranium
desorption was conducted by using a mixture of
1M of NaCl and 0.05M of H2SO4 [1, 2, 3].
Uranium, iron and other impurities containing
in the eluate solution will be determined to
calculate the resin sorption capacity of uranium,
iron. For experiments to establish sorption and
elution curves, the composition of eluate
solution will be analysed just after a few of bed
volumes.
Each experiment was conducted on both
resins. From the data obtained, the appropriate
conditions and the applicability of each type of
resin have been identified.
36. ION EXCHANGE RESIN SELECTION FOR CONCENTRATION AND PURIFICATION OF URANIUM...
36
V. RESULTS AND DISCUSSION
A. Effect of pH on the sorption capacity of
the resin
First of all leached solution is adjusted
to a pH value of 1.2 by NaOH solution. Then
the solution is pumped through the resin bed at
a rate corresponding to retention time of 8
minutes. Similar experiments were conducted
with solutions of pH = 1.4, pH = 1.6 and pH =
1.8. From obtained results, the sorption capacity
of the resins are calculated and given in the
following table:
pH 1.2 1.4 1.6 1.8
Loading
(g U/l of wet resin)
GS300 28.5 39.1 46.8 50.2
A400 27.1 38.3 43.4 47.7
It can be seen that uranium loading of the
two resins tends to increase with increasing pH
of solution. Uranium loading of GS300 resin
increases from 28.5 to 50.2 gU/l of wet resin
when pH of solution increases from 1.2 to 1.8.
Similarly, uranium loading of A400 resin
increases from 27.1 to 47.7 gU/l. However, in
the pH range from 1.6 to 1.8 uranium loading of
the two resins does not increase significantly. In
the same experimental conditions, uranium
loading of GS300 resin is little higher than
A400 resin.
According to previous studies elsewhere,
when pH increases to 1.8 or higher, some
impurities will be precipitated within the resin
bead in the sorption stage. So, in the sorption
stage we should proceed with solution of pH =
1.6.
In the previous research results, for the
similar solution uranium loading of IRA-420
resin reached 55 gU/l at pH of 1.6. Thus, the
uranium loading of A400 resin is only equal to
80% of IRA-420 resin, while uranium loading
of GS300 resin was 85%.
Because total capacity of IRA-420,
GS300 and A400 resin is the same, so the
difference in uranium loading of GS300 and
A400 resin comparing to IRA-420 resin is of
other impurities. This proves that GS300 and
A400 resins has lower selectivity than IRA-420
resin.
B. Sorption curves
Leached solution adjusted to a pH
value of 1.6 was pumped through resin bed
at a rate corresponding to retention time of 2
minutes. Uranium concentrations in effluent
at different bed volumes were analyzed.
Similar experiments were conducted with
retention time of 4 and 8 minutes. Relation
of uranium concentrations in effluent and the
volumes of effluent is shown in the
following figures:
Uranium loading of A400 resin with different retention
time
0
0.1
0.2
0.3
0.4
0.5
0.6
0.7
0 20 40 60 80 100 120 140
Effluent volume (resin bed volume)
EffluentconcentrationU(g/l)
8min.
4min.
2min.
37. LE QUANG THAI et al.
37
Uranium loading of GS300 resin with different
retention time
0
0.1
0.2
0.3
0.4
0.5
0.6
0.7
0 20 40 60 80 100 120 140
Effluent volume (resin bed volume)
EffluentconcentrationU(g/l)
8min.
4min.
2min.
Experimental results show that, similarly
to IRA-420, the sorption curve of two resins
can be divided into three parts: first, most of the
uranium is sorbed in resin beads so uranium
concentration in effluent is very low and
changes slowly. In the next section (after
breakthrough point), uranium concentration
increase very fast. In the last section, uranium
concentration varies slowly and resin beads
reach state of uranium saturation.
When retention time increases,
breakthrough volume increases: with retention
time of 2 - 4 minutes, breakthrough point
appears at about volume of 5- 10 resin bed
volume (BV) for A400 and GS300 resins.
However, when increasing the retention time
of 8 minutes, for A400 resin breakthrough
point appears at about 30 BV and for GS300
resin at about 40 BV. So with the two resins,
retention time of 8 minutes is appropriate.
Under this condition, GS300 resin will be
saturated with uranium at volume of 80BV and
A400 - 120 BV.
C. Elution curves
Saturated resin war washed by diluted
H2SO4 solution (1/1000) to remove all leached
solution from the resin bed. Then the resin was
eluted by NaCl 1M + H2SO4 0.05M solution to
recover uranium with retention time of 10
minutes. From uranium concentration in each
bed volume of eluate, elution curve for each
resin was plotted. The results are described in
the following figure:
Uranium elution curves of A400 and GS300
0
2
4
6
8
10
12
0 2 4 6 8 10 12 14 16 18 20
Eluate volume (resin bed volume)
EluateconcentrationgU/l
A400
GS300
Results show that in the same condition,
elution curves of GS300 and A400 resin are
divided into two stages. In the first one, most of
the uranium is eluted from the resin in about
first 10 BV. Later stage, to elute the entire
uranium, relatively large volume of eluant is
needed. Elution process can be completed in
15-20 BV of eluate.
VI. CONCLUSIONS
1. pH of solution effected significantly
on the uranium loading of GS300 and A400
resin. Suitable pH of solution for these two
resins is 1.6. Under this condition, uranium
loading of GS300 resin was 46.8 g U/l and that
of A400 resin was 43.4 g U/l, accounted for
approximately 80-85% to the uranium loading
of Amberlite IRA-420 resin. The shape of
uranium loading curve is similar to that with
Amberlite IRA-420 resin, retention time of
solution was 8 minutes (while the IRA-420
resin Amberlite only 3.5 - 4 minutes).
38. ION EXCHANGE RESIN SELECTION FOR CONCENTRATION AND PURIFICATION OF URANIUM...
38
2. By using conventional eluant, nearly
all of the uranium can be eluted from the resin
with 15 - 20 bed volumes of eluant.
3. Although the uranium loading is
lower, we may still use GS300 and A400 resins
for concentration and purification of leached
solution because these resins are imported and
sold popularly in Vietnam with cheaper price.
However, due to the lower sorption capacity as
well as slower kinetic sorption and eluation
characteristics, the overal benefit must be
evaluated carefully in term of the operation of
the whole IX system before deciding to use
these resins.
REFERENCES
1. Le Quang Thai, Le Xuan Thanh, Adsorption of
uranium with fixed bed exchange ion column
from sandstone leach solution, Journal of
Chemistry, No.43, pages 298-301, 3/2005.
2. Le Quang Thai, Le Xuan Thanh, The influent
factors on uranium adsorption ability of
Amberlite IRA-420 from Pa Lua sandstone leach,
Journal of Chemistry and Application, No. 3(39),
pages 36-40, 2005.
3. Le Quang Thai, Le Xuan Thanh, Elution of
saturated with uranium resin on fixed bed
column system, Journal of Chemistry and
Application, No. 5(41), pages. 29-31, 2005.
4. IAEA, Manual on Laboratory Testing for
Uranium Ore Processing, Austria, pages 61-85;
117-118, 1990.
5. Merritt R.C., The Extractive Metallurgy of
Uranium, First printing, Library of Congress
Catalog Card No. 71-157076, USA, 1971.
40. STUDY ON TREATMENT OF RADIOACTIVE LIQUID WASTE FROM URANIUM ORE PROCESSING …
40
and in particular radioactive liquid waste are
thriving and gradually replace the older
technology.
The objective of the article:
Founding the appropriate technology
conditions for the application of nano oxide
iron to treat the liquid waste from uranium ore
processing. Proposing a feasible technological
process for treatment of liquid waste from
uranium ore processing to meet the discharge
criteria into the environment of QCVN
40:2011.
The contents of the article:
- Overview document of identity, application of
nano oxide iron materials to be used for sewage
treatment of uranium ore processing;
- Survey of affective factors for the adsorption
capacity of nano Fe3O4 KT for uranium in the
sample preparative solution;
- Test on the real liquid radioactive waste of
uranium ore processing;
- Comparison of two types of nano applications
from Vietnamese nano oxide ferromagnetic
(NiFe2O4, Fe3O4) and 2 types of Slovakian nano
oxide ferromagnetic (NiFe2O4, Fe3O4) to treat
radioactive waste of uranium ore processing;
- Proposing a technological process to apply
nano oxide ferromagnetic to the treatment for
liquid waste of uranium ore processing.
II. EXPERIMENT AND RESULTS
Researching method is the study of
adsorption process in static conditions (working
in batches). After the pH value of the research
solution was adjusted to the appropriate value,
filtered and added the nano magnetite adsorbent
was into the limpid solution. The solution was
stirred or shaked. After a time, the radioactive
elements and heavy metals in solution was
adsorbed on nano ferromagnetic materials. The
separation solid - liquid phase is easy made by
using magnets. The uranium adsorption
capacity of nano magnetite was shown by the
adsorption process efficiency:
η = (1)
η – Adsorption process capacity;
Ai - Uranium content in the solution before
adsorption;
Aa - Uranium content in the solution after
adsorption.
In the experiment, uranium content in
the solution was analyzed by photometric
method on colorimetric Jenway 6300
spectrophotometer.
Chemical, equipment and measuring
instruments:
- Agitator with controled speed (Heidol RZR
2020);
- pH meter (Handulab pH11- SCHOTT);
- Scales (Precisa xt220A); Oven (Memmert
800); Permanent magnets
- Colorimeter Jenway 6300 Spectrophotometer;
Analyzer total radioactivity α, β: MPC-2000; ICP-
MS analyzer (Analysis Centre - Institute for
Technology of Radioactive and Rare)
- Pure Salt UO2 (NO3) 2.6H2O, Fe3O4 (KT,
VN); Uranium acetate salt: pure UO2
(CH3COO) 2.2H2O
- HCl, pure NaOH, pure CaO, the liquid waste
of uranium ore processing.
Case contents
To accomplish the proposed objectives,
on the basis of the review of radioactive waste
and the method for waste treatment, we choose
the method using Vietnamese nano oxide
ferromagnetic materials Fe3O4 KT to study the
possibilities uranium adsorption capacity of
41. VUONG HUU ANH et al.
41
infusion solutions (uranium acetate solution) by
means of mixing batch to get the experimental
parameters, then tested the ability to remove the
radioactive elements in the real liquid waste
treatment of uranium ore processing.
A. Investigation effect of technology
parameters to the uranium adsorption
capacity of nano oxide ferromagnetice
materials in the sample solution preparation
(using pure salt UO2(CH3COO)2.2H2O to
prepare liquid experiments).
Based on experience and research
materials, The speed of stirring 120 rounds /
minute was chosen.
Nano oxide ferromagnetic materials
used as a laboratory chemical parameters - in
accordance with Table I below:
Table I: Characterization of 4 types of nano oxide ferromagnetic materials
Number Materials Type Particular size (nm) Specific surface area (m2
/g)
1 Fe3O4 Viet Nam 80 - 100 50 - 70
2 NiFe2O4 Viet Nam 70 - 90 60 - 80
3 Fe3O4 (Slovakia) 20 - 30 100 - 110
4 NiFe2O4 (Slovakia) 15 - 20 100– 120
a. Investigated the effect of mixing time on
uranium adsorption capacity of nano
magnetite:
The solutions for experiments were
prepared from standard uranium salt. The time of
each experiment was changed which the period of
30 minutes, 1 hour, 2 hours, 3 hours, 4 hours.
The dependence on contact time to
adsorption processing is shown in Fig 1.
Fig. 1. The dependence of adsorption processing on time
(T= room temperature, nk=120 rounds/minute, Uinitial=5.15 mg/L, moxit=0.1g)
Comment: The data from Figure 1
revealed that uranium uptake reached
equilibrium after mixing time about 2 hours.
The uranium sorption efficiency was constant
after increased mixing time from 3 to 4 hours.
b. Investigated the effect of pH value of the
solution on the uranium adsorption capacity
of nano oxide ferromagnetic materials
The experiments were conducted with
uranium acetate standard salt solution. The pH
value of the solutions was changed with values:
6.5; 7; 7.5; 8; 8.5; 9 with the stirring time of 2
hours.
The dependence on pH of adsorption
performance of material is shown in Figure 2
42. STUDY ON TREATMENT OF RADIOACTIVE LIQUID WASTE FROM URANIUM ORE PROCESSING …
42
Fig. 2. The dependence of adsorption performance of material on pH to
(T= room temperature, nk=120 rounds/minute, Uinitial=5.15 mg/L, moxit=0.1g)
Comment: The data from Fig 2 revealed
that the highest sorption efficiency (97.3%)
could be observed on pH value of 8 with
mixing time about 2 hours.
c. Investigate the influence of uranium
concentration in solution on the adsorption
capacity of nano oxide ferromagnetic
The research team conducted
experiments with standard uranium acetate with
saline concentration values (mg / l) are 2.58;
5.15; 7.73; 10.3; 12.88; 15.45 in stirring period
of 2 hours and the amount of nano oxide
ferromagnetic is 0.1g.
The dependence on initial uranium
concentration of adsorption capacity of the
material is shown in Figure 3.
Fig. 3. The dependence of adsorption capacity of the material on initial uranium concentration to
(T= room temperature, nk=120 rounds/minute, Uinitial=5.15 mg/L, moxit=0.1g)
Comment: The data from Fig 3 revealed
with mixing time about 2 hours, the pH value of
8 could be maximum adsorbed initial Uranium
concentration 5.35mg on 0.1g nano Fe3O4 KT
100708 (expression clearly on experimental 3).
However, the uranium adsorption efficiency
was not increased with increasing continuous
uranium concentration.
B. Experimental adsorption capacity of nano
magnetite materials in real liquid radioactive
waste from uranium ore processing.
43. VUONG HUU ANH et al.
43
Real sample of liquid radioactive waste
was taken from the Central laboratory for
processing of radioactive ore at Institute for
Technology of Radioactive and Rare Elements.
Liquid waste has pH = 2.2 and the composition
of liquid waste was showed in table II
Table II. Compositions of initial liquid waste solution from uranium ore processing
Number Elements Concentration Unit Analysis Method
1 Fe 1536.4 mg/l ICP-MS
2 Al 1454.4 mg/l ICP-MS
3 Cr 4.12 mg/l ICP-MS
4 Mn 1046.8 mg/l ICP-MS
5 Mg 287.2 mg/l ICP-MS
6 Zn 278.84 mg/l ICP-MS
7 As 8.856 mg/l ICP-MS
8 U 154.4 mg/l ICP-MS
9 Total activity α 2988.01 Bq/l
MPC-2000 measure total
activity α,β
10 Total activity β 29696.96 Bq/l
MPC-2000 measure total
activity α,β
The data from Table II revealed that
liquid waste from uranium ore processing have
the low of pH value, the high content of heavy
metal concentration and total activity α, β.
After adjusting pH of the liquid waste
with a solution by lime (Ca(OH)2) to pH 8.0
and separated solid – liquid by filtration.
Solution after precipication and filtering at pH
= 8.0 has composition as follows:
Table III. Compositions of liquid waste solution after preliminary precipitate at pH 8
Number Name of Elements Concentration Unit Analysis method
1 Fe 20.76 mg/l
Jenway 6300
Spectrophotometer
2 U 4.75 mg/l
Jenway 6300
Spectrophotometer
3 Total activity α 57.86 Bq/l
MPC-2000 measure total
activity α,β
4 Total activity β 575.07 Bq/l
MPC-2000 measure total
activity α,β
Comments: the data from Table III
revealed that heavy metal concentrations and
total activity α, β after preliminary precipitate in
pH 8 were still higher than Vietnamese
discharge environment standards QCVN 40:
2011.
From the solution was preliminary
precipitated at pH 8.0 , the nano oxide
ferromagnetic material was added into liquid
waste to deep treatment of uranium ore
processing (The concentration of Fe3O4: 1
gram; Liquid waste volume: 1 liter; Adsorption
temperature: room temperature; Adsorption
time: 2 hours; Stirring speed: 120 rounds /
minute).
44. STUDY ON TREATMENT OF RADIOACTIVE LIQUID WASTE FROM URANIUM ORE PROCESSING …
44
Table IV. Compositions of liquid waste after Preliminary precipitate and deeply treatment by nano magnetite material
Number Elements Concentration Unit Analysis method
1 Fe 0.542 mg/l ICP-MS
2 Al 0.66 mg/l ICP-MS
3 Cr 0.001 mg/l ICP-MS
4 Mn 0.009 mg/l ICP-MS
5 Mg 0.23 mg/l ICP-MS
6 Zn 0.025 mg/l ICP-MS
7 As 0.006 mg/l ICP-MS
8 U 0.014 mg/l ICP-MS
9 Total activity α 0.097 Bq/l
MPC-2000 measure total
activity α,β
10 Total activity β 0.985 Bq/l
MPC-2000 measure total
activity α,β
Comments: The data from Table IV
revealed that liquid waste from uranium ore
processing after preliminary precipitate and
deeply treatment by nano ferromagnetic
material was reached discharge environment
standard of QCVN 40:2011.
C. Comparing the applicability of 4 different
materials for the liquid waste treatment of
uranium ore processing
The research team examined the
adsorptive capacity of 4 different materials
and tested them with liquid waste from
uranium ore processing wich was preliminary
precipitated at pH 8. The results are given in
the following table:
Table IV. Adsorption capacity of differently materials
Number Materials Type
Particular
size (nm)
Specific surface
area (m2
/g)
Adsorption capacity
(mg/g)
1 Fe3O4 Vietnam 80 - 100 50 - 70 53.5
2 NiFe2O4 Vietnam 70 - 90 60 - 80 58.5
3 Fe3O4 Slovakia 20 - 30 100 - 110 82.2
4 NiFe2O4 Slovakia 15 - 20 110 - 120 86.5
Table V. Compare the results of treatment of 4 categories materials
Number Materials Type
Weight
materials (g)
The total activity
of α (Bq/l)
The total activity
of β (Bq/l)
1 Fe3O4 Vietnam 1 0.097 0.985
2 NiFe2O4 Vietnam 1 0.089 0.865
3 Fe3O4 Slovakia 0.5 0.092 0.95
4 NiFe2O4 Slovakia 0.5 0.085 0.876
45. VUONG HUU ANH et al.
45
Liquid Wate
pH = 2.2
Preliminary
precipitation pH = 8.0
NaOH
Divide solid – liquid
and flush
Adsorption by nano
oxide magnetite
Divide solid – liquid
Analysis testCement of sludge
Crating
temporary
storage
Disposal near the surface
Nano oxide
magnetite
(NiFe2O4)
Discharged
Waste
sludge
Waste
sludge
Wastewater
Liquid
no
satisfy
standard
Comment: From the data shows a
comparison between two kinds of Vietnam and
two types of Czechs that these of Czechs have
higher usability. But the main solution is the
cost of this kind almost double the price of 2
Vietnamese types. So, the material Vietnamese
NiFe2O4 was selected for application to handle
liquid waste for uranium ore processing.
D. Proposed technology process for the
application of nano oxide ferromagnetic
materials to treat liquid radioactive waste
from processing of uranium ores
The applicability of nano oxide
ferromagnetic material for adsorption uranium
from uranium solution and uranium ore
processing uranium was assessed. Propose
process treatment liquid waste from uranium
ore processing with the application of nano
oxide ferromagnetic was submited.
From an examination of the affective
parameters to the adsorption of nano oxide
ferromagnetic for uranium solution and test for real
liquid waste of uranium ore processing. We have a
proposed process using of nano oxide
ferromagnetic to handle liquid waste from the of
uranium ore processing.
Fig.4. Technology process for treatment liquid radioactive waste generated from uranium ores processing.
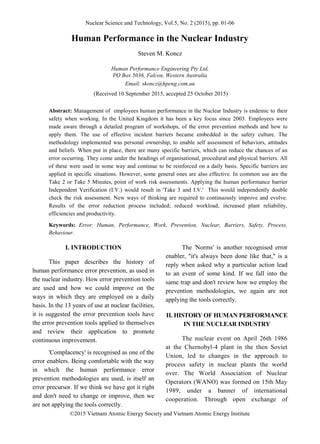
![HUMAN PERFORMANCE IN THE NUCLEAR INDUSTRY
2
operating experience, all members could then
work together to achieve the highest possible
standards of nuclear safety.
The Institute of Nuclear Power
Operations (INPO), founded in December
1979, established a Special Review
Committee on Human Performance in late
1993. This committee, along with several
working groups, was asked to identify actions
to bring about continued improvement in
human performance within the commercial
nuclear power industry [1]. It was this
document, which was adopted and reviewed
by WANO to form the basis, in 2002, for
improving human performance [2].
III. HUMAN PERFORMANCE
IMPROVEMENT
There is now good evidence through
human performance improvement to
demonstrate the benefits to safety, production
and output.
In the UK over a 2-year period, the
performance of key performance indicators
(KPI's) were ahead of WANO “Best in Class”
targets for 2004/05. This was attributed to the
business improvements at that time.
Implementing and reinforcing the Human
Performance error prevention process had a
bearing on these results, Non-outage defects
backlog reduced by 55%, Accident frequency
rate reduced by 40%, Unplanned automatic trip
rate reduced by 30%, Work schedule adherence
was 28% better [3]
Human error contributes to around 80%
of nuclear events in the industry, the remaining
20% attributable to equipment / plant failures.
This not only has a bearing on the performance
of the facilities themselves, but the overall
public perception of the nuclear industry. Of the
identified human errors, 30% of the mistakes
were down to the individuals and 70% due to
the organisations failing to prevent the errors.
This is shown in Fig. 1. [4]
Fig. 1. Contribution of human error to the
occurrence of events. [4]
IV. WHY CONCENTRATE ON HUMAN
PERFORMANCE?
Human beings are fallible, they make
mistakes, and even with the best intentions
something can invariably go wrong.
“People know the right thing to do for
any situation in three ways.” First, instinct
triggers automatic responses. This is a fixed
reaction ’hard wired’ in the human mind that
elicits a special response, such as the dilation of
the eyes as one walks into bright sunlight. No
learning is required. Second, a suitable response
is determined by learning either by education,
by trial and error, or from others' experiences.
Examples include reading a book on finances,
learning to ride a bicycle, reading operating
experience reports, or learning the expectations
of a new employer or work group. Finally,
thinking is a process of building idea upon idea
to make sense of a situation. Thinking gathers
data to generate cues that may help a person
recognize a familiar pattern about what to do.
Thinking generates new ideas coupled with new
knowledge leads to better understanding [5].
The skills, knowledge and attitudes of
individuals take time to change. It is for this](data:image/gif;base64,R0lGODlhAQABAIAAAAAAAP///yH5BAEAAAAALAAAAAABAAEAAAIBRAA7)