1. SCIRT, The Construction Industry Health and Safety
Leaders
E. R. Gualter and T. L. Wilkins
Final Year Projects, 2015
Dept. of Civil and Natural Resources Engineering
University of Canterbury
Project Supervisor: Dr. E. Scheepbouwer
Keywords: Workplace Health and Safety, Key Performance Indicator (KPI), Alliance, Construction Industry,
Safety Management
ABSTRACT
In the last five years the New Zealand construction industry has taken steps to improve its health and safety
performance in an attempt to meet the standard set by the likes of Australia and the United Kingdom. The Government
formed the Business Leaders’ Health and Safety Forum to encourage the chief executives and managing directors of
New Zealand companies to take ownership of workplace health and safety. In the wake of the 2011 Canterbury
earthquakes, the Stronger Christchurch Infrastructure Rebuild Team (SCIRT) was formed. The alliance has had a
strong safety focus throughout its duration. This study investigated the positive effects that SCIRT has had on the
health and safety performance within the New Zealand construction industry. SCIRT intentionally created a business
model where innovations from each contractor were shared. This contributed to the learning legacy of the project,
which will ultimately benefit the health and safety performance of the New Zealand construction industry. SCIRT’s
health and safety performance has been proven to exceed that of the set New Zealand benchmark published in the
Benchmarking Report by the Business Leaders’ Health and Safety Forum. The strongest factor influencing this was
the number of reported lead indicators, also exceeding that of the New Zealand benchmark. Key performance
indicators that influenced the workload of contractors were used to encourage a proactive health and safety culture,
hence motivating this success. Investigations into using key performance indicators more frequently in other forms of
contracting is the next logical research step.
1. INTRODUCTION
1.1. Background
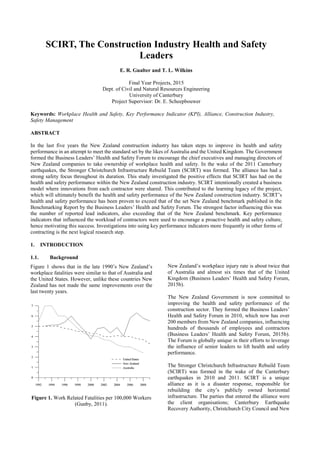
Figure 1 shows that in the late 1990’s New Zealand’s
workplace fatalities were similar to that of Australia and
the United States. However, unlike these countries New
Zealand has not made the same improvements over the
last twenty years.
Figure 1. Work Related Fatalities per 100,000 Workers
(Gunby, 2011).
New Zealand’s workplace injury rate is about twice that
of Australia and almost six times that of the United
Kingdom (Business Leaders’ Health and Safety Forum,
2015b).
The New Zealand Government is now committed to
improving the health and safety performance of the
construction sector. They formed the Business Leaders’
Health and Safety Forum in 2010, which now has over
200 members from New Zealand companies, influencing
hundreds of thousands of employees and contractors
(Business Leaders’ Health and Safety Forum, 2015b).
The Forum is globally unique in their efforts to leverage
the influence of senior leaders to lift health and safety
performance.
The Stronger Christchurch Infrastructure Rebuild Team
(SCIRT) was formed in the wake of the Canterbury
earthquakes in 2010 and 2011. SCIRT is a unique
alliance as it is a disaster response, responsible for
rebuilding the city’s publicly owned horizontal
infrastructure. The parties that entered the alliance were
the client organisations; Canterbury Earthquake
Recovery Authority, Christchurch City Council and New
2. Zealand Transport Agency (NZTA) joined by civil
engineering construction companies City Care, Downer,
Fletcher Construction, Fulton Hogan and
McConnell Dowell (SCIRT, 2014).
The five principal contractors were ranked and allocated
work based on the key performance indicators (KPI) and
key result areas (KRA); safety, value, our team, customer
satisfaction and environment (SCIRT, n.d.). Companies
were also encouraged to share ideas and innovations
through the jointly agreed performance indicators, so that
one company’s good idea could be implemented
throughout the alliance.
1.2. Aims and Objectives
The purpose of this project was to identify the effect that
the SCIRT alliance has had on the New Zealand
construction industry’s health and safety performance
and to determine if and how these effects can be
replicated in other alliances and projects around the
country.
The objectives of this project were to:
Demonstrate that SCIRT has, on average, over the
duration of the alliance performed better than the
Benchmarking Report produced by the Business
Leaders’ Health and Safety Forum.
Investigate what SCIRT has done differently to
create a more mature safety culture than other
alliances/projects in New Zealand.
Identify how other organisations could replicate
SCIRT’s health and safety initiatives to improve
their own health and safety performance.
1.3. Safety Culture Maturity Model (SCMM)
In the journal article Safety Culture – Theory and
Practise, Patrick Hudson proposed that organisational
safety culture could be divided into five stages of
maturity, shown in Figure 2. He suggested that all
organisations fit into the model depending on their
attitudes and values towards workplace health and safety.
Figure 2 illustrates this hierarchy and is referred to during
the qualitative analysis. Dr Mark Fleming defines each of
the five stages as follows (Fleming, 2014):
In a pathological culture, there is little or no concern
for safety. Safety rules and regulations are just seen
as a barrier to getting the job done.
In a reactive culture there is an acceptance that the
organisation should try to prevent accidents.
In a calculative culture, the focus is on employee
engagement and ensuring a systematic approach to
safety.
A proactive culture is typified by a collective effort
to prevent harm.
The generative tier of the model is an idealised or
aspirational level. As organisations approach this
level of maturity, they become more aware of their
weaknesses and therefore organisations at this level
would not describe themselves as having a
generative culture.
Figure 2. The Safety Culture Ladder, Maturity Model
(adapted from Lawrie et al., 2006).
From literature it can be assumed that SCIRT has a safety
culture maturity that is approaching proactive culture.
2. METHODOLOGY
Data was obtained from SCIRT records and the
Benchmarking Report published by the Business
Leaders’ Health and Safety Forum. Statistical analyses
were performed on the data to demonstrate SCIRT had
exceeded the performance of the set New Zealand
benchmark.
A qualitative survey of health and safety representatives
from both client organisations and principal contractors
was undertaken. This was conducted to gauge their
understanding of SCIRT’s performance and their
perception of why the observed improvements occurred.
3. DATA
The quantitative data from SCIRT and the Business
Leaders’ Health and Safety Forum included a count for
commonly measured health and safety statistics. These
included lost time injuries, medically treated injuries,
total recordable injuries and near miss events.
To ensure that the classification of terms used in this
report was consistent between the organisations. The
following definitions were used for this project:
PATHALOGICAL | Who cares as long as
we’re not caught
REACTIVE | We do a lot, but only if an
accident occurs
CALCULATING | We have systems for
managing all risks – lots of audits and H&S
professionals chasing statistics
PROACTIVE | We work on the remaining
problems we find
GENERATIVE | H&S is how we do business
IncreasinglyInformed
IncreasingTrust&Accountability
3. Lost Time Injury (LTI) - A work-related injury,
illness or disease that prevented a return to work
for one day/shift or more.
Medically Treated Injury (MTI) - When an
employee or contractor received any medical
treatment from a Registered Medical
Professional as a result of a work-related injury,
illness or disease that was beyond the scope of
first aid.
Total Recordable Injuries (TRI) - Includes
medically treated injuries, return to work
injuries, lost time injuries and fatal injuries.
Near Miss Event - A documented event where
property damage, system failure, environmental
conditions, injury or illness was likely to occur.
For the purpose of this study, the Benchmarking Report
produced by the Business Leaders’ Health and Safety
Forum in 2015 was assumed to represent the performance
of New Zealand’s construction industry. The
Benchmarking Report collected data from construction
companies throughout New Zealand of varying sizes and
work types; thus it can be reasonably assumed that the
sample data is representative of the entire industry.
Therefore the contents of the Benchmarking Report will
be referred to as the New Zealand benchmark.
The data from SCIRT has not been verified by any other
organisation and hence the accuracy of it is the most
critical assumption to the analysis. It is also worth noting
that, whilst the SCIRT data is only representative of
horizontal infrastructure works, the Benchmarking
Report is representative of the entire construction
industry – both horizontal and vertical works.
4. STATISTICAL ANALYSIS
4.1. Frequency Rate
In order to statistically analyse the data samples, it was
necessary to create non-dimensionalised parameters. A
frequency rate (FR) per 200,000 hours worked was
calculated for each health and safety parameter.
4.2. T-Test
A t-test was used to determine if the two data sets were
reliably different from each other. The independent
sample t-test was used as it was assumed that the two data
sets were continuous, independent and normally
distributed (McCarthy, B. C 2013). The samples were
said to be reliably different if the p value, the probability
that the pattern of data in the sample could be replicated
by random data, was less than 5%.
4.3. Null Hypothesis
The null hypothesis stated that there was no reliable
difference between SCIRT and the New Zealand
benchmark. Rejecting the null hypothesis would indicate
that the two groups were reliably different (Motulsky, H
2010).
The p-value produced infers the likelihood that the null
hypothesis was true. It was assumed that the null
hypothesis was false if p < 0.05 and therefore the null
hypothesis could be rejected. As the p values obtained
from the t-tests varied between 2.8x10⁻⁷
and 1.8x10⁻³
the
null hypothesis could be confidently rejected.
4.4. Bootstrap Resampling
Bootstrapping is a method of creating additional data sets
to estimate the distribution. The new data sets are formed
through random selection from the original set. It is most
often used for deriving confidence intervals of a
parameter such as a mean, median or correlation
coefficient.
A confidence range for the TRI performance of SCIRT
compared with the New Zealand benchmark was
determined using two 500 sample bootstrap simulations.
The results illustrate the magnitude to which SCIRT’s
performance exceeded the New Zealand benchmark.
4.5. Monte Carlo Simulations
Monte Carlo simulation is a numerical process of
repeatedly calculating a mathematical problem in which
the random variables of the problem are simulated from
random number generators. In this sense, each Monte
Carlo Simulation produces a result which can be
considered parallel with a single observation from a
physical experiment in reality. For this analysis 5000
simulations were calculated to represent 5000 months of
health and safety data.
The simulations were used to illustrate different
combinations of occurrence and severity frequencies.
This was performed to determine the number of days of
lost production per month due to injuries.
5. RESULTS AND DISCUSSION
5.1. Direct Comparison
The New Zealand benchmark’s average FR for each
parameter was calculated over 13 quarters. SCIRT’s
average quarterly FR for each parameter was calculated
and plotted against the New Zealand benchmark average.
A trend line for SCIRT’s data was also plotted so the
averages could be compared.
Figure 3 shows SCIRT’s average quarterly FR compared
to the New Zealand Benchmark. To date it can be seen
that every quarter the SCIRT alliance performed better
than the New Zealand average. The trend seen in the data
illustrates a continued improvement and less recorded
injuries.
4. Figure 3. Total Recordable Injury Average Quarterly
Frequency Rate.
As the safety culture in the New Zealand construction
industry matures reaching new tiers on the SCMM, the
number of injuries will decrease and ideally approach
zero. The relationship between increasing safety maturity
culture and the number of injuries is expected to be
logarithmic approaching an asymptote at zero, as there
will always be a number of incidents. A logarithmic trend
was selected as it clearly depicts human behaviours. The
trend shown on Figure 3 illustrates a continuous
improvement but as seen by the blue bars the data did not
always succumb to this trend.
Monthly hours worked increased from approximately
50,000 in 2011 and 2012 to over 150,000 hours
throughout 2013 and 2014. A larger workforce was
required to increase the alliance’s capacity. National and
international recruitment brought staff into SCIRT from
around New Zealand and the world. A challenge for the
construction project was the continued influx of new
workers of varying background and skill. The increased
work rate and the changing dynamic of the international
workforce could explain the increased number of injuries
during this period. Improvement within the alliance
caused the frequency of injuries to decrease towards the
end of 2014 rather than a decrease in size or an increase
in skilled labour.
Figure 4 demonstrates a similar trend to that of Figure 3,
in terms of improvement and overall betterment. Again,
in can be seen that in early 2013 there was an increase in
the number of injuries, which as stated above could be
explained by the increased size of the workforce.
Figure 4. Average Quarterly Medically Treated Injury
Frequency Rate.
It can be seen in Figure 5 that LTI data is more sporadic
than the other parameters. This figure does not account
for the seriousness of the incident i.e. the number of days
lost, only the fact there was an incident. The greater
distribution within the data is due to the potential skew
that a single event can have on the general trend. Again,
it can be observed that SCIRT exceeded the performance
of the set New Zealand benchmark. The trend line and
bar plot also illustrates a substantial improvement over
time.
Figure 5. Average Quarterly Lost Time Injury
Occurrence Frequency Rate.
All three figures show positive results for the SCIRT
alliance in that they have exceeded the performance of
the set New Zealand benchmark. The trend lines also
show that SCIRT has continually improved over the
duration of the project.
The sharing of ideas and innovations amongst competing
parties is unique in New Zealand. It is an intentional
component of the alliance’s business model, and
contributes to the learning legacy, improving the New
Zealand construction industry.
0
1
2
3
4
TRI/200,00hoursworked
SCIRT SCIRT Log Trend
0.0
0.5
1.0
1.5
2.0
MTI/200,000hoursworked
SCIRT SCIRT Log Trend
0.0
0.2
0.4
0.6
0.8
1.0
LTI/200,000hoursworked
SCIRT SCIRT Log Trend
New Zealand Benchmark
New Zealand Benchmark
New Zealand Benchmark
5. 5.2. Data Reliability
The t-tests were carried out to ensure that the SCIRT data
was reliably different from the New Zealand benchmark.
Table 1 shows the results from the TRI t-test. The t-stat
indicates that the two sets of data are 5.84 times as
different from each other. As mentioned above, the p-
value is less than 0.05 and hence the null hypothesis
could be rejected.
Table 1. T-Test Results for Total Recordable Injuries.
SCIRT TRI NZ TRI
Mean 2.005 3.421
Variance 0.185 2.582
Standard Deviation 0.430 1.607
Observations 37 48
T Stat 5.84
P (Two-Tail) 0.00000028
Similarly, the t-stat for the MTI data indicates that the
data was reliably different. The p-value is sufficiently
smaller than 0.05, therefore the null hypothesis for the
medically treated injuries can also be rejected.
Table 2. T-Test Results for Medically Treated Injuries.
SCIRT MTI NZ MTI
Mean 1.408 2.014
Variance 0.102 1.495
Standard Deviation 0.320 1.223
Observations 37 48
T Stat 3.29
P (Two-Tail) 0.0018
The LTI severity and LTI occurrence FR were both
investigated to determine a range for the total number of
days lost per month due to injuries. Modelling these
parameters together calculated the expected range of lost
time injury days.
Table 3. T-Test Results for Lost Time Injuries
(Occurrence).
SCIRT LTI NZ LTI
Mean 0.597 0.939
Variance 0.033 0.064
Standard Deviation 0.181 0.253
Observations 37 47
T Stat 3.40
P (Two-Tail) 0.0013
Table 4. Lost Time Injury (Severity).
SCIRT LTI NZ LTI
Mean 6.338 6.190
Variance 4.97 9.139
Standard Deviation 2.230 3.023
Observations 37 47
The t-tests show that the SCIRT and New Zealand
benchmark LTI data sets were reliably different and
aging the null hypotheses were rejected. This can be said
for both the LTI occurrence and severity frequency rate.
5.3. Confidence Interval
Bootstrap resampling was performed on the SCIRT and
New Zealand benchmark TRI data. This involved
resampling the original data until it formed a new set that
was the same size. This was performed 500 times and the
average taken of each new data set produced. The
variations in the data set’s averages were tallied and the
results can be seen in Figure 6.
Figure 6. Bootstrap resampling for the average TRI
frequency rate per month.
Figure 6 illustrates the expected monthly average TRI per
200,000 hours worked. It shows that SCIRT’s average is
considerably lower than that of the New Zealand
benchmark. Table 5 provides the exact confidence range
for the average monthly TRI frequency. It should be
noted that SCIRT’s upper confidence bound of 2.10 is
significantly less than the New Zealand benchmark lower
bound of 2.98. These results imply that there is very high
certainty that SCIRT performs to a higher standard than
the New Zealand benchmark.
Table 5. 95% confidence interval for the average Total
Recordable Injuries per month.
95% Confidence Interval
SCIRT 1.84 – 2.10
NZ Benchmark 2.98 – 3.90
0
50
100
150
200
250
Mean TRI/ 200,000 hours worked
SCIRT NZ Benchmark
6. 5.4. Lost Time Injuries – Duration
Four Monte Carlo simulations were run with the SCIRT
and New Zealand benchmark LTI information. One pair
of simulations was the LTI occurrence FR (Table 3) the
other was the LTI severity FR (Table 4). Each simulation
calculated these for each organisation. The two
simulations were then combined to calculate the
distribution of the total number of LTI days per month.
Figure 7. Monte Carlo Simulation of Lost Time Injury
(Days) per month.
Figure 7 illustrates the simulations results. It can be seen
that the peak of SCIRT’s normally distributed data is less
than that of the New Zealand benchmark’s. SCIRT’s
monthly frequency rates (FR) range between 0 and 10
days whereas the upper limit of the New Zealand
benchmark simulations reached over 12 lost time injury
days per month. This showed that SCIRT has less LTI
days per month than the average construction project in
New Zealand. However, as mentioned above, this
statistic is susceptible to a single event skewing the data
due to the limited data sample.
5.5. Continuous Improvement
The qualitative survey was targeted at individuals in
senior health and safety management positions in
Downer, Fletcher Construction, Fulton Hogan,
McConnell Dowell and NZTA.
The surveyed industry representatives agreed that SCIRT
had exceeded the health and safety performance of the
construction sector in New Zealand. While improvement
was noted, SCIRT as a horizontal infrastructure alliance
does not represent any vertical construction. Correlations
and forecasting performance for vertical infrastructure
projects based on these results must be conducted with
caution.
A number of policies and procedures unique or new to
SCIRT have been identified as improvements compared
with previous approaches to construction practices.
Although this has been acknowledged as a contributing
factor towards SCIRT’s development, lead indicators
have been identified as the major basis of improvement.
Client organisations, such as NZTA have driven the
advanced alliance model in the SCIRT project to align
with the Government’s objectives of reducing workplace
fatalities and serious harm by 25%. They are also
influenced by their own goals of achieving zero harm by
2020 (NZTA, 2014). NZTA as a client are looking for
good lead indicator data as it is internationally recognised
that this improves lag measurements (which can be easily
measured).
Table 6. Lead and Lag indicators (adapted from NZTA,
2014).
Lead Indicators Lag Indicators
Number of Drug and
Alcohol tests
Number of Fatal
Incidents
Proportion of drug and
alcohol tests that are
negative
Number of Serious
Harm incidents
Number of site health and
safety audits
Number of LTI
Number of safety briefings Number of MTI
Number of near misses Number of First Aid
Injuries
Number of positive
reinforcements
Number of staff on
reduced/alternate
duties
Number of traffic
management inspections
Number of significant
environmental
incidents
Number of Safety in Design
Workshops (Designers only)
Number of
Underground service
strikes
Number of Safety in Design
Reviews (Design only)
Number of Overhead
Service strikes
Number of sub-contractor
reviews
Number of property
damage incidents
Number of stop work
actions
Total recordable
frequency rate
Table 6 lists the lead and lag health and safety indicators
as identified by NZTA in their 2014-2020 strategic plan.
These lead indicators are similar to those that SCIRT has
measured. Significant improvement in injury data could
be seen as reported near misses increased illustrated in
Figure 8, Figure 9 and Figure 10.
Industry has found that reporting lead indicators not only
results in a decreased number of injuries but also
reductions in plant damage, environmental incidents and
quality improvements. All lead indicators are important
but this study has only investigated the influence of near
miss reporting.
0
100
200
300
400
500
600
Mean FrequencyRate - LTI days/month
SCIRT NZ Benchmark
7. Figure 8. Near Miss Reporting’s Influence on Total
Recordable Injuries.
Figure 8, Figure 9 and Figure 10 illustrate a negative
correlation between the lead and lag indicators, such that
an increase in lead indicators results in a decrease in the
lag measurements. Both client organisations and
principal contractors in the qualitative survey reinforced
this correlation. It was mutually agreed that a focus on
lead indicators, particularly near misses, has driven
improvement, removed risk and contributed to lower
injury rates.
Figure 9. Near miss reporting’s Influence on Lost Time
Injuries.
SCIRT used KPI’s/KRA’s to motivate the alliance and
contractors to encourage safe and reliable operations,
contributing to the development of a strong safety
focused culture. The industry experts surveyed agreed
that KPI’s/KRA’s are a good starting point to initiate the
process of health and safety improvement, and that they
recognise the positives, rather than focusing on the
negatives. However, ideally, reporting near misses and
other lead indicators would result in innovations being
implemented due to the benefit to the team being safer,
more efficient, and better for business, rather than
because there is opportunity for reward.
The KPI/KRA scheme also created a culture within the
alliance where ideas and innovations were shared
amongst all parties. The sharing is an intentional part of
the alliance’s business model, and contributes to the
learning legacy, which will benefit the New Zealand
construction industry.
The importance of front line leaders encouraging their
teams to look for improvement opportunities was
emphasised by SCIRT. The Business Leaders’ Health
and Safety Forum has also highlighted this fact through
their desire to involve CEO’s and other business leaders
in the daily health and safety culture.
SCIRT considered reported near misses as opportunities
for improvement; many other New Zealand organisations
see them as a measure of weakness. It is anticipated this
attitude is more common in smaller organisations, which
are on the lower levels of the safety culture maturity
model (SCMM), Figure 2.
Figure 10. Near Miss reporting’s Influence on
Medically Treated Injuries.
From the qualitative results, it is thought that the SCIRT
alliance performs at a proactive level in the SCMM, seen
in Figure 2. The five delivery teams within the alliance
most likely operate between the calculative and proactive
levels on the SCMM scale. Due to their countrywide
nature of the operations, it is challenging for management
to implement and oversee such culture changes in their
business as usual operations.
Medium to small size contractors, subcontracted to the
SCIRT alliance have been required to participate and
meet the standards of SCIRT’s proactive safety
principles. It is anticipated that these companies will have
developed a more mature safety culture due to their
involvement in the alliance.
6. CONCLUSIONS AND RECOMMENDATIONS
SCIRT has exceeded the health and safety performance
published by the Business Leaders’ Health and Safety
Forum that was assumed as the New Zealand benchmark
for this analysis. This was seen in all of the direct
comparisons of medically treated injuries, lost time
injuries and total recordable injures. Analysis showed
that the health and safety results from SCIRT were
indeed significantly different compared to the New
Zealand benchmark.
0.0
1.0
2.0
3.0
4.0
0
100
200
300
400
NearMissFR
Near Miss TRI
TRIFR
0.0
0.5
1.0
1.5
2.0
0
100
200
300
400
NearMissFR
Near Miss LTI
LTIFR
0.0
1.0
2.0
3.0
0
100
200
300
400
NearMissFR
Near Miss MTI
MTIFR
8. To provide a level of confidence additional to the direct
comparison bootstrap resampling of the total recordable
injuries was conducted. This compared the possible
variation in the means of the resampled data sets. The
results showed that with very high certainty SCIRT
performed better than the New Zealand benchmark.
A Monte Carlo simulation illustrated the number of days
where there was a loss in performance due to injury. The
simulations showed that SCIRT would experience
notably fewer lost time injury days compared with the
New Zealand benchmark.
Although new policies and procedures were identified as
advances from previous techniques and responsible for
workplace safety improvements, the strongest factor
influencing SCIRT’s performance was the focus on lead
indicators. A lead indicator, such as a reported near miss
event, is looking for opportunities to improve and reduce
risk. Where there was a focus on lead indicator reporting,
not only a decrease in injuries observed but improvement
had also been noticed in areas such as plant damage,
environmental incidents and quality.
In SCIRT KPI’s and KRA’s within their business model
specifically addressed health and safety results, which led
to an increased frequency of lead indicator reporting.
Interviews with industry participants showed that KPI’s
were a good starting point to initiate the process of health
and safety improvement as they recognised a positive
safety culture rather than focusing on the
negatives. Ideally, reporting and other positive
innovations would be implemented due to the benefit to
the team rather than due to monetary reward.
The culture that the alliance has created is considered to
be in the fourth tier on the safety culture maturity model.
This culture is characterised by a highly proactive safety
culture that is always looking for opportunities to
improve.
Further research into how KPI’s could be integrated into
other forms of contracting would be the next logical
research step. This would be valuable to helping the New
Zealand Government reach their goal of zero harm
workplaces.
Implementing safety initiatives into smaller companies
that currently have a less mature safety culture would
further benefit the country’s health and safety
performance.
7. ACKNOWLEDGMENTS
The authors would like to thank Dr. Eric Scheepbouwer
for his support as academic supervisor.
Mandy Bertie, David Hanham and Rod Cameron from
SCIRT for access to their performance information and
general support.
Representatives from City Care, Downer, Fletcher
Construction, Fulton Hogan, McConnell Dowell, New
Zealand Transport Agency, ACC and the Business
Leaders’ Health and Safety Forum for their assistance
and support throughout this project.
8. REFERENCES
Business Leaders’ Health and Safety Forum (2015a),
Benchmarking Report, zeroharm.org
Business Leaders’ Health and Safety Forum (2015b),
Strategic Plan 2015-2017, zeroharm.org, pg 4-6
Fleming M (2014), Confidential Reporting: Why it’s a
Sign of Cultural Maturity, CIRAS.org.uk
Gunby, P (2011), How Bad is the State of Occupational
Fatalities in New Zealand? New Zealand Journal
of Employment Relations 36(1), 280-284, 35-51
Hudson, P (2001), Safety Culture - Theory and Practice,
Centre for Safety Science, Leiden University
Hudson (2001), Safety Culture – Theory and Practise,
Centre for Safety Science, Leiden University.
Table 5, Page pg 8/8
Lawrie, M., Parker, D., & Hudson P. (2006),
Investigating Employee Perceptions of a
Framework of Safety Culture Maturity, Safety
Science, 44, 259-279
McCarthy, B. C (2013), https://www.ohio.edu/plantbio/
staff/mccarthy/quantmet/lectures/ttest.pdf, 21, 22
Motulsky, H (2010), Intuitive Biostatistics, A Non-
mathematical Guide to Statistical Thinking,
Oxford University Press, 387-389
New Zealand Transport Agency (2014), Strategic Plan
2014-2020,
nzta.govt.nz/__data/assets/pdf_file/0017/52424/Z
ero-Harm-Strategic-Plan-2014-2020.pdf
Parker, Lawrie, & Hudson (2006), Safety Management
and Safety Culture, The Long, Hard and Winding
Road
SCIRT (2014), The Value of SCIRT,
strongerchristchurch.govt.nz, 49-64
SCIRT (n.d), SCIRT Key Result Areas,
strongerchristchurch.govt.nz