Download to read offline


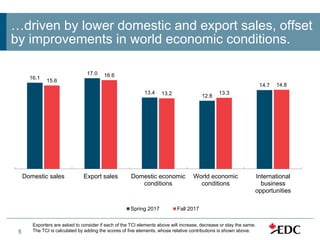


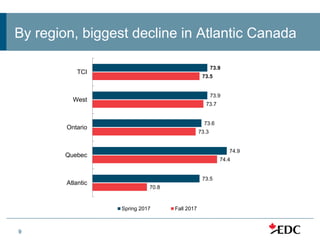


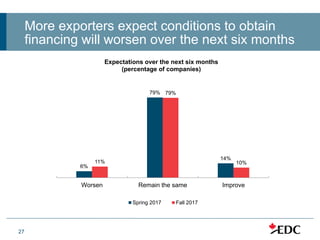


The Fall 2017 Trade Confidence Index (TCI) from Export Development Canada revealed a slight decrease in exporter confidence, primarily due to domestic and export sales pressures, though most respondents expect conditions to remain stable or improve. Key concerns among exporters include the negative impact of NAFTA negotiations and challenges in entering new markets, particularly China. Despite uncertainties, Canadian firms are increasingly focusing on European markets post-CETA implementation, with a noted emphasis on the need for skilled labor and investment challenges abroad.


