SlideShare a Scribd company logo
1 of 7
Download to read offline
Tomeetatestindicatorforgrades
3-8and10,atleast75%ofstudents
testedmustscoreproficientorhigher
onthattest.Otherindicatorrequirementsare:
11thgradeOhioGraduationTests,85%;Attendance
Rate, 93%; Graduation Rate, 90%.
State
Indicators
2011-2012 School Year Report Card
The state requirement is 75 percent
The state requirement is 85 percent
The state requirement is 93 percent
The state requirement is 90 percent
3rd Grade Achievement
1.	Reading
2.	Mathematics
4th Grade Achievement
3.	Reading
4.	Mathematics
5th Grade Achievement
5.	Reading
6.	Mathematics
7.	Science
6th Grade Achievement
8.	 Reading
9.	 Mathematics
7th Grade Achievement
10.	Reading
11.	Mathematics
8th Grade Achievement
12.	Reading
13.	Mathematics
14.	Science
Ohio Graduation Tests (10th Grade)
15.	Reading
16.	Mathematics
17.	Writing
18.	Science
19.	 Social Studies
Ohio Graduation Tests (11th Grade)
20.	Reading
21.	Mathematics
22.	Writing
23.	Science
24.	 Social Studies
Attendance Rate
25.	 All Grades
2010-11 Four-Year Graduation Rate
26.	School
The state requirement is 75 percent
The six designations are
• Excellent with Distinction
• Excellent
• Effective
• ContinuousImprovement
• Academic Watch
• Academic Emergency
Value-AddedAdequate
YearlyProgress
Performance
Index
Indicators
TheSchoolReportCardforthe
2011-2012schoolyearshows
theprogressschoolshavemade
basedonfourmeasuresof
performance.
Thecombinationofthefour
measuresisthebasisfor
assigningstatedesignations
todistricts,buildingsand
communityschools.
Your School’s
Designation: Performance
Index
State
Indicators Performance
Index
OntheWeb:reportcard.ohio.gov
State
Indicators
(0-120 points)
*
Your School
2011-2012
Your District
2011-2012
State
2011-2012
Percentage of Students at and above the Proficient Level
Any result at or above the state standard is indicated by a .
-- = Not Calculated/Not Displayed when there are fewer than 10 in the group.
Cumulative results for students who took the tests as 10th or 11th graders.
*
Current Principal:
Current Superintendent:
Value-Added
Component
Score
= met
+ = above
– = below
Value-Added
Measure
Value-Added
Component
Score
= met
+ = above
– = below
Value-Added
Measure
AYP
IRN# 002709
Big Walnut High School
PO Box 5001, Sunbury, OH 43074-5001—Grades 9-12—Delaware County
Excellent
12
Met
--
StevenJ.Mazzi(740)965-3010
StephenP.Fujii(740)965-3766
Number of State
Indicators
Met out of 12
109.0
91.8%
88.6%
95.4%
90.4%
92.2%
88.8%
90.7%
94.6%
87.4%
86.4%
83.1%
93.8%
90.6%
92.5%
95.6%
95.6%
96.9%
92.0%
96.5%
79.0%
79.8%
83.3%
78.4%
76.8%
67.5%
72.5%
86.7%
79.9%
79.5%
73.6%
83.0%
79.6%
71.5%
86.0%
82.6%
87.1%
76.7%
81.6%
--
--
--
--
--
--
--
--
--
--
--
--
--
--
95.6%
95.6%
96.9%
92.0%
96.5%
94.9%
95.8%
95.8%
95.3%
94.8%
92.6%
89.9%
93.0%
85.6%
87.8%
94.9%
95.8%
95.8%
95.3%
94.8%
95.4% 94.5%93.8%
92.9% 79.7%92.9%
2
All students in the school for a full academic year are included in the results.
The State
Indicators
are based on state
assessments, as well
as on attendance and
graduationrates.
Toearnanindicator
forAchievementor
GraduationTests,at
least75% ofstudents
mustreach proficient
orabovefor the given
assessment. For
the 11th grade Ohio
GraduationTests
indicators,acumulative
85%passagerateforeach
assessmentis required.
State
Indicators
Your School’s Assessment Results Over Time
Big Walnut High School, Delaware County
3
Overall Composite
Scores reflect grade level and overall composite
ratings for the 2011-2012 school year.
Value-Added Measure
Grade 4 Grade 5 Grade 6 Grade 7 Grade 8
Reading
Mathematics
On the Web: reportcard.ohio.gov
Yourschool’sValue-Addedratingrepresentstheprogressyour
schoolhasmadewithitsstudentssincelastschoolyear.
Incontrast,achievementscoresrepresentstudents’performance
atapointintime. Ascoreof“Above”indicatesgreaterthanoneyearof
progresshasbeenachieved;“Met”indicatesoneyearofprogresshas
beenachieved;“Below”indicateslessthanoneyearofprogresshasbeen
achieved.Value-Addedresultsarecomputedonlyforbuildingsthatinclude
sufficienttestingdataforstudentsinanygrade4through8.
Met
Expected Growth
=
- Below
Expected Growth
=
+ Above
Expected Growth
=
Legend
Performance Index
Performance Level Across Grades
3-8 and 10 for All Tested Subjects
(Includes every student enrolled in
the school for a full academic year)
X =WeightPercentage Points
Your School’s Performance Index
Performance Index Calculations
for the 2011-2012 School Year
0.0
0.3
0.6
1.0
1.1
1.2
Untested
Limited
Basic
Proficient
Accelerated
Advanced
X
X
X
X
X
X
=
=
=
=
=
=
ThePerformance
Index reflects the
achievementofeverystudent
enrolledforthefullacademic
year.ThePerformanceIndex
isaweightedaveragethatincludes
alltestedsubjectsandgradesand
untestedstudents.Thegreatest
weightisgiventoadvancedscores
(1.2);theweightsdecreaseforeach
performancelevelandaweightof
zeroisgiventountestedstudents.
Thisresultsinascalefrom0to120
points.ThePerformanceIndexcanbe
comparedacrossyearstoshow
schoolachievementtrends.
Performance
Index
2011-2012 2010-2011 2009-2010
Performance Index Over Time
Note: Value-Added results are computed only for buildings that include students in grades 4 through 8.
Value-Added
Component
Score
= met
+ = above
– = below
d
e
w
Value-Added
Measure
Big Walnut High School, Delaware County
0.0
1.4
3.3
20.4
36.5
38.3
0.0
0.4
2.0
20.4
40.2
46.0
109.0
109.0 103.6 101.8
All
Students
All
Students
Asian or
Pacific Islander
Asian or
Pacific Islander
Econ.
Disadvtgd
Econ.
Disadvtgd
Multi-Racial Multi-RacialHispanic Hispanic
Students with
Disabilities
Students with
Disabilities
Limited English
Proficient
Limited English
Proficient
White,
non-Hispanic
White,
non-Hispanic
American Indian/
Alaska Native
American Indian/
Alaska Native
Black,
non-Hispanic
Black,
non-Hispanic
4
Grades 3-8 and 10
Reading
and
Mathematics
Adequate Yearly
Progress
All Students
PercentProficientPercentTested
Economically Disadvantaged
Asian/Pacific Islander
Black, non-Hispanic
American Indian/Alaska Native
Hispanic
Multi-Racial
White, non-Hispanic
Students with Disabilities
Limited English Proficient
Reading
Mathematics
Reading
Mathematics
Graduation Rate
Attendance Rate*
Legend
Adequate Yearly Progress (AYP)
Reading
Proficiency:
Mathematics
Proficiency:
Reading
Participation:
Mathematics
Participation:
Attendance
Rate:
AYP Determination
by Indicator
Graduation
Rate:
AYP Determination
by Subgroup
AYP
Determination
for Your School:
This legend explains terms used in the above chart that describe whether each student group met this year’s AYP goals.
For test indicators, AYP can be met in one of four ways:
1) meeting the AYP targets with current year results;
2) meeting the AYP targets with two-year combined results;
3) meeting the improvement requirements of Safe Harbor;
4) meeting the AYP targets with projected results.
Class of 2010 Five-Year Graduation Rate Information
For the non-test attendance rate indicator, AYP can be met in one of three ways:
1) meeting the AYP target with the current year results;
2) meeting the AYP target with two-year combined results;
3) making improvement over the previous year.
For the non-test graduation rate indicator, AYP can be met in one of two ways:
1) meeting the AYP target with the current year results;
2) making a 2 percentage point improvement over the previous year.
Attendance Rate is evaluated only for the All Students subgroup.*
NR
N/A
Met
Not Met
Not Required – This indicator was not evaluated for this subgroup because the subgroup size was smaller than the minimum number needed to achieve a statistically
reliable result. 30 students is the minimum size for the proficiency and non-test indicators, while 40 is the minimum size for the participation rate indicators.
This subgroup met AYP for this indicator with its current year, two-year combined, Safe Harbor, or growth measure results.
This subgroup did not meet AYP for this indicator.
Not applicable.
Class of 2011 Four-Year Graduation Rate Information
Met
Met
Met
Met
Met
NR
NR
NR
NR
NR
NR
NR
NR
NR
NR
NR
NR
NR
NR
NR
NR
Met
Met
Met
Met
Met
NR
NR
NR
NR
Met NR NR NR NR NR NR Met NR NR
Met Met NR NR NR NR NR Met Met NR
Met
Met
Met
Met
Met
N/A
Met
Big Walnut High School, Delaware County
N/A
95.0%92.9%
----
----
----
----
----
----
81.3%83.8%
86.1%78.8%
95.0%92.6%
-- = Not Calculated/Not Displayed when there are fewer than 10 in the group.
Reading
Writing
Mathematics
Science
Social Studies
Reading
Writing
Mathematics
Science
Social Studies
Reading
Writing
Mathematics
Science
Social Studies
Reading
Writing
Mathematics
Science
Social Studies
Reading
Writing
Mathematics
Science
Social Studies
Black,
non-Hispanic
American
Indian/
Alaska Native
Asian or
Pacific
Islander
Hispanic
Multi-
Racial
White,
non-Hispanic
Non-
Disabled
Students
Students
with
Disabilities
Migrant
Non-
Econ.
Disadvtgd
Econ.
Disadvtgd
Limited
English
Proficient
Female Male
Your School’s Percentage of Students at Each Performance Level
Percentage of Students Scoring Limited
Percentage of Students Scoring Basic
Percentage of Students Scoring Proficient
Percentage of Students Scoring Accelerated
Percentage of Students Scoring Advanced
State and Federally Required School Information
5
Number of Limited English Proficient Students
Excluded from Accountability Calculations
Average Daily
Student
Enrollment
Black,
non-
Hispanic
American
Indian or
Alaska Native
Asian or
Pacific
Islander
Hispanic Multi-Racial
White,
non-
Hispanic
Students
with
Disabilities
Migrant
Economically
Disadvantaged
Limited
English
Proficient
Your School’s Students 2011-2012
Underthefederal
NoChildLeftBehind
Act, states are
required to report
certaindataabout
schoolsandteachers.
Datapresentedhere
areforreporting
purposesonlyand
arenotusedinthe
computationofthe
statedesignation
fordistrictsand
schools.
Your BuildingYour Building’s Poverty Status*: District
Percentage of teachers with at least a Bachelor’s Degree
Percentage of teachers with at least a Master’s Degree
Percentage of core academic subject elementary and secondary classes
not taught by highly qualified teachers
Percentage of core academic subject elementary and secondary classes
taught by properly certified teachers
Percentage of core academic subject elementary and secondary classes taught
by teachers with temporary, conditional or long-term substitute certification/licensure
School Teacher Information
*High-poverty schools are those ranked in the top quartile based on the percentage of economically disadvantaged students. Low-poverty schools are those ranked in the bottom quartile based on the percentage of economically disadvantaged students.
-- = Not Calculated/Not Displayed when there are fewer than 10 in the group.
921
--
Big Walnut High School, Delaware County
Low Poverty
--
--
--
--
--
--
--
--
--
--
--
--
--
--
--
--
--
--
--
--
--
--
--
--
--
--
--
--
--
--
--
--
--
--
--
--
--
--
--
--
--
--
--
--
--
--
--
--
--
--
--
--
--
--
--
--
--
--
--
--
--
--
--
--
--
--
--
--
--
--
--
--
--
--
--
--
--
--
--
--
--
--
--
--
--
--
--
--
--
--
--
--
--
--
--
--
--
--
--
--
--
--
--
--
--
--
--
--
--
--
--
--
--
--
--
--
--
--
--
--
--
--
--
--
--
1.4
0.9
2.4
0.9
1.9
2.8
2.4
1.9
6.6
1.9
22.2
27.4
16.5
15.6
20.8
39.6
65.1
24.5
29.7
22.2
34.0
4.2
54.7
47.2
53.3
0.0
0.0
0.0
0.0
0.0
1.0
0.0
0.5
5.1
1.5
19.5
22.6
14.9
12.8
19.0
41.0
73.3
23.1
30.8
21.5
38.5
4.1
61.5
51.3
57.9
9.7
6.5
16.1
6.5
12.9
16.1
16.1
12.9
19.4
3.2
38.7
54.8
25.8
32.3
35.5
29.0
19.4
35.5
22.6
32.3
6.5
3.2
9.7
19.4
16.1
--
--
--
--
--
--
--
--
--
--
--
--
--
--
--
--
--
--
--
--
--
--
--
--
--
1.0
1.0
1.5
1.0
1.0
2.1
1.5
2.1
5.1
2.1
21.5
23.6
14.4
14.9
18.5
40.0
69.2
26.2
30.3
24.6
35.4
4.6
55.9
48.7
53.8
3.2
0.0
6.5
0.0
6.5
9.7
6.5
3.2
19.4
0.0
25.8
48.4
29.0
19.4
38.7
35.5
45.2
16.1
25.8
12.9
25.8
0.0
45.2
35.5
41.9
--
--
--
--
--
--
--
--
--
--
--
--
--
--
--
--
--
--
--
--
--
--
--
--
--
0.9
0.0
1.8
0.0
1.8
4.5
1.8
1.8
7.3
3.6
17.3
18.2
18.2
18.2
22.7
35.5
73.6
21.8
28.2
20.9
41.8
6.4
56.4
46.4
50.9
1.7
1.7
2.6
1.7
1.7
1.7
2.6
2.6
6.9
0.0
26.7
35.3
14.7
12.9
19.8
43.1
58.6
27.6
31.0
25.0
26.7
1.7
52.6
47.4
53.4
1.6% -- -- 2.1% 3.7% 91.8% 13.5% -- 13.1% --
100.0% 100.0%
63.7% 60.7%
0.6% 0.2%
99.1% 99.6%
0.0% 0.0%
6
1. IfaschoolmeetsAYPinthecurrentyear,itcanbe
ratednolowerthanContinuousImprovement.
2. IfanExcellentorEffectiveschooldoesnotmeetAYP
forthesametwo(ormore)subgroupsforthree
consecutiveyears,itsratingwillbedecreasedto
EffectiveorContinuousImprovement(respectively).
Oncethepreliminarydesignationisdetermined,Value-Added,
thefourthmeasureintheaccountabilitysystem,isevaluated
todeterminetheimpact(ifany)ontheschool’sfinal
designation.
1. Ifyourschool’sdesignationeitherisincreasedordecreased
duetoAYP,Value-Addedhasnoimpactonthedesignation
andthepreliminarydesignationbecomesthefinaldesignation.
2. Ifyourschoolexperiencesaboveexpectedgrowthinthe
currentyear,yourschool’sfinaldesignationwillincrease
byonedesignation.
3. Ifyourschoolexperiencesbelowexpectedgrowthforat
leasttwoconsecutiveyears,yourschool’sfinal
designationwilldecreasebyonedesignation.
Thepreliminarydesignationresultsfromidentifyingthe
highervaluebetweenthepercentageofindicatorsmet
byyourschoolandyourschool’sPerformanceIndex.
AYPthenisevaluatedtodetermineitseffectonthe
preliminarydesignation. Therearetwowaysinwhich
AYPcanaffectthepreliminarydesignation.
Determiningyourschool’sreportcarddesignationisamulti-stepprocess. Thefirststepistodetermineapreliminarydesignation,which
isbasedonthefollowingcomponents:1)thepercentageofindicatorsmet,2)thePerformanceIndexand3)AYPdetermination.
Determining Your School’s Designation
Indicators Met Performance Index AYP Designation Preliminary Designation
94%-100% 100 to 120or
or
or
or
or
and
and
and
and
and
andand
Met or Not Met Excellent or Effective
75%-93.9%
0%-74.9%
50%-74.9%
31%-49.9%
0%-30.9%
90 to 99.9
80 to 89.9
0 to 89.9
70 to 79.9
0 to 69.9
Met or Not Met
Not Met
Not Met
Not Met
Met
Effective or Continuous Improvement
Academic Watch
Academic Emergency
Continuous
Improvement
=
=
=
=
=
=
Preliminary Designation Value-Added Measure* Final Designation
Excellent
Effective
Continuous Improvement
Academic Watch
Academic Emergency
Above expected growth in the current year
and
and
and
and
and
Excellent with Distinction
Effective
Above expected growth in the current year
Excellent
Continuous Improvement
Academic Emergency
Academic Watch
Academic Emergency
Continuous Improvement
Academic Watch
Effective
*Inallothercases,Value-Addedwillhavenoimpactonthedesignationandthepreliminarydesignationwillbecomethefinaldesignation.
or
or
or
or
or
Value-Added
Component
Score
= met
+ = above
– = below
Below expected growth for 2 consecutive years
Big Walnut High School, Delaware County
7
The National Assessment of Educational Progress (NAEP),
oftenreferredtoas“TheNation’sReportCard,”istheonlynationallyrepresentativeand
continuingassessmentthatenablesthecomparisonofperformanceinOhioandotherstates
invarioussubjectareas.Schoolsandstudentswithineachstateareselectedrandomlyto
beapartoftheassessment.Notallstudentsinthestateorinaparticularschooltakethe
assessment.Dataarereportedatthestatelevelonly,andtherearenoindividualstudentor
evenschoolsummaryresults.Theassessmentsareconductedinmathematics,reading,science,
writing,thearts,civics,economics,geographyandU.S.history.
ToviewOhio’smostrecent
NAEPresults,goto:
andsearchforkeyword“NAEP”
http://education.ohio.gov
Big Walnut High School, Delaware County

More Related Content

What's hot

MCAS and PARCC Results - Spring 2016
MCAS and PARCC Results - Spring 2016MCAS and PARCC Results - Spring 2016
MCAS and PARCC Results - Spring 2016Franklin Matters
 
Using Teacher Evaluation to Improve School Performance
Using Teacher Evaluation to Improve School PerformanceUsing Teacher Evaluation to Improve School Performance
Using Teacher Evaluation to Improve School Performanceseprogram
 
Student performance
Student performance   Student performance
Student performance lyacosta09
 
Assessment update february 2014
Assessment update february 2014Assessment update february 2014
Assessment update february 2014sycamorees
 
CDE Accreditation
CDE Accreditation CDE Accreditation
CDE Accreditation weldre8supt
 
Franklin School Committee: MCAS and PARCC 2015
Franklin School Committee: MCAS and PARCC 2015Franklin School Committee: MCAS and PARCC 2015
Franklin School Committee: MCAS and PARCC 2015Franklin Matters
 
MAP Growth Paths and Post-Secondary Readinessserconf file share
MAP Growth Paths and Post-Secondary Readinessserconf file shareMAP Growth Paths and Post-Secondary Readinessserconf file share
MAP Growth Paths and Post-Secondary Readinessserconf file shareDash Weerasinghe
 
Accountability update
Accountability updateAccountability update
Accountability updateKeith Eades
 
Joseph slides-for-20160601
Joseph slides-for-20160601Joseph slides-for-20160601
Joseph slides-for-20160601ald4all
 
ALD4ALL TSAS PowerPoint 20150922
ALD4ALL TSAS PowerPoint 20150922ALD4ALL TSAS PowerPoint 20150922
ALD4ALL TSAS PowerPoint 20150922ald4all
 
ALD4ALL Team Presents at AERA 2015
ALD4ALL Team Presents at AERA 2015ALD4ALL Team Presents at AERA 2015
ALD4ALL Team Presents at AERA 2015ald4all
 
RHS Explore and Plan Parent Night information presented
RHS Explore and Plan Parent Night information presentedRHS Explore and Plan Parent Night information presented
RHS Explore and Plan Parent Night information presentedjuliedecember
 
How Prodigy Helped More Texas Students Succeed
How Prodigy Helped More Texas Students SucceedHow Prodigy Helped More Texas Students Succeed
How Prodigy Helped More Texas Students SucceedProdigy Game
 
Assessment information evening 2 3-16
Assessment information evening 2 3-16Assessment information evening 2 3-16
Assessment information evening 2 3-16Kate Meakin
 
Rob\'s Presentation November 2008 Powerpoint 2003
Rob\'s Presentation November 2008 Powerpoint 2003Rob\'s Presentation November 2008 Powerpoint 2003
Rob\'s Presentation November 2008 Powerpoint 2003WSU Cougars
 

What's hot (20)

MCAS and PARCC Results - Spring 2016
MCAS and PARCC Results - Spring 2016MCAS and PARCC Results - Spring 2016
MCAS and PARCC Results - Spring 2016
 
Using Teacher Evaluation to Improve School Performance
Using Teacher Evaluation to Improve School PerformanceUsing Teacher Evaluation to Improve School Performance
Using Teacher Evaluation to Improve School Performance
 
Student performance
Student performance   Student performance
Student performance
 
Assessment update february 2014
Assessment update february 2014Assessment update february 2014
Assessment update february 2014
 
School Grades Webinar
School Grades Webinar School Grades Webinar
School Grades Webinar
 
CDE Accreditation
CDE Accreditation CDE Accreditation
CDE Accreditation
 
Franklin School Committee: MCAS and PARCC 2015
Franklin School Committee: MCAS and PARCC 2015Franklin School Committee: MCAS and PARCC 2015
Franklin School Committee: MCAS and PARCC 2015
 
Litchfield SB Testing Results 2015
Litchfield SB Testing Results 2015Litchfield SB Testing Results 2015
Litchfield SB Testing Results 2015
 
MAP Growth Paths and Post-Secondary Readinessserconf file share
MAP Growth Paths and Post-Secondary Readinessserconf file shareMAP Growth Paths and Post-Secondary Readinessserconf file share
MAP Growth Paths and Post-Secondary Readinessserconf file share
 
Accountability update
Accountability updateAccountability update
Accountability update
 
Joseph slides-for-20160601
Joseph slides-for-20160601Joseph slides-for-20160601
Joseph slides-for-20160601
 
NCCE Bylsma
NCCE BylsmaNCCE Bylsma
NCCE Bylsma
 
ALD4ALL TSAS PowerPoint 20150922
ALD4ALL TSAS PowerPoint 20150922ALD4ALL TSAS PowerPoint 20150922
ALD4ALL TSAS PowerPoint 20150922
 
ALD4ALL Team Presents at AERA 2015
ALD4ALL Team Presents at AERA 2015ALD4ALL Team Presents at AERA 2015
ALD4ALL Team Presents at AERA 2015
 
Lori PR 2012-13
Lori PR 2012-13Lori PR 2012-13
Lori PR 2012-13
 
TAMSA Slideshow
TAMSA SlideshowTAMSA Slideshow
TAMSA Slideshow
 
RHS Explore and Plan Parent Night information presented
RHS Explore and Plan Parent Night information presentedRHS Explore and Plan Parent Night information presented
RHS Explore and Plan Parent Night information presented
 
How Prodigy Helped More Texas Students Succeed
How Prodigy Helped More Texas Students SucceedHow Prodigy Helped More Texas Students Succeed
How Prodigy Helped More Texas Students Succeed
 
Assessment information evening 2 3-16
Assessment information evening 2 3-16Assessment information evening 2 3-16
Assessment information evening 2 3-16
 
Rob\'s Presentation November 2008 Powerpoint 2003
Rob\'s Presentation November 2008 Powerpoint 2003Rob\'s Presentation November 2008 Powerpoint 2003
Rob\'s Presentation November 2008 Powerpoint 2003
 

Viewers also liked (13)

BCME Summer Newsletter
BCME Summer NewsletterBCME Summer Newsletter
BCME Summer Newsletter
 
ALiCE30
ALiCE30ALiCE30
ALiCE30
 
Boletín Salvatierra de Santiago. Agosto de 2016
Boletín Salvatierra de Santiago. Agosto de 2016Boletín Salvatierra de Santiago. Agosto de 2016
Boletín Salvatierra de Santiago. Agosto de 2016
 
Debdatta dey cv
Debdatta dey cvDebdatta dey cv
Debdatta dey cv
 
Elizabeth Gai
Elizabeth GaiElizabeth Gai
Elizabeth Gai
 
Guía de fotos
Guía de fotosGuía de fotos
Guía de fotos
 
Keegan francis cv ceriticates and certified copies
Keegan francis cv ceriticates and certified copiesKeegan francis cv ceriticates and certified copies
Keegan francis cv ceriticates and certified copies
 
Nuevas Recomendaciones para la Devolución de las Cartas
Nuevas Recomendaciones para la Devolución de las CartasNuevas Recomendaciones para la Devolución de las Cartas
Nuevas Recomendaciones para la Devolución de las Cartas
 
Partes de una carta
Partes de una cartaPartes de una carta
Partes de una carta
 
NUEVO CICLO DE ENTREGA DE CORRESPONDENCIA
NUEVO CICLO DE ENTREGA DE CORRESPONDENCIANUEVO CICLO DE ENTREGA DE CORRESPONDENCIA
NUEVO CICLO DE ENTREGA DE CORRESPONDENCIA
 
Planejamento e Briefing Proativo - Parte I
Planejamento e Briefing Proativo - Parte IPlanejamento e Briefing Proativo - Parte I
Planejamento e Briefing Proativo - Parte I
 
Agência limonada Briefing Dolly
Agência limonada Briefing DollyAgência limonada Briefing Dolly
Agência limonada Briefing Dolly
 
Boi duong-hoc-sinh-gioi-toan-lop-5
Boi duong-hoc-sinh-gioi-toan-lop-5Boi duong-hoc-sinh-gioi-toan-lop-5
Boi duong-hoc-sinh-gioi-toan-lop-5
 

Similar to 002709_2011-2012_BUILD

Wyoming Accountability in Education Act - 1/16/14 Presentation
Wyoming Accountability in Education Act - 1/16/14 PresentationWyoming Accountability in Education Act - 1/16/14 Presentation
Wyoming Accountability in Education Act - 1/16/14 PresentationJay Harnack
 
Educ 6240 assignment one data overview
Educ 6240 assignment one  data overviewEduc 6240 assignment one  data overview
Educ 6240 assignment one data overviewGWU
 
Understanding Assessments
Understanding AssessmentsUnderstanding Assessments
Understanding AssessmentsJenny Shotts
 
Teacher Rating 2013-2014
Teacher Rating 2013-2014Teacher Rating 2013-2014
Teacher Rating 2013-2014Justin Rook
 
002709_2012-2013_BUILD
002709_2012-2013_BUILD002709_2012-2013_BUILD
002709_2012-2013_BUILDStephen Fujii
 
MCAS Analysis Educational Growth
MCAS Analysis Educational GrowthMCAS Analysis Educational Growth
MCAS Analysis Educational GrowthFranklin Matters
 
Readiness Matters: The Impact of College Readiness on College Persistence and...
Readiness Matters: The Impact of College Readiness on College Persistence and...Readiness Matters: The Impact of College Readiness on College Persistence and...
Readiness Matters: The Impact of College Readiness on College Persistence and...National Partnership for Educational Access
 
MCAS Presentation Nov 27, 2018
MCAS Presentation Nov 27, 2018MCAS Presentation Nov 27, 2018
MCAS Presentation Nov 27, 2018Franklin Matters
 
Cognitive Abilities Test Parent Presentation
Cognitive Abilities Test Parent PresentationCognitive Abilities Test Parent Presentation
Cognitive Abilities Test Parent PresentationHeather Callahan
 
School Effectiveness, Accountability and Improvement
School Effectiveness, Accountability and ImprovementSchool Effectiveness, Accountability and Improvement
School Effectiveness, Accountability and ImprovementMiss Beau
 
Teacher Rating 2012-2013
Teacher Rating 2012-2013Teacher Rating 2012-2013
Teacher Rating 2012-2013Justin Rook
 
Ocean City Intermediate School report card 2013-14
Ocean City Intermediate School report card 2013-14Ocean City Intermediate School report card 2013-14
Ocean City Intermediate School report card 2013-14OceanCityGazette
 
PSE 2014 Results
PSE 2014 ResultsPSE 2014 Results
PSE 2014 ResultsAdele Ramos
 
Ocean City High School report card 2013-14
Ocean City High School report card 2013-14Ocean City High School report card 2013-14
Ocean City High School report card 2013-14OceanCityGazette
 

Similar to 002709_2011-2012_BUILD (20)

Wyoming Accountability in Education Act - 1/16/14 Presentation
Wyoming Accountability in Education Act - 1/16/14 PresentationWyoming Accountability in Education Act - 1/16/14 Presentation
Wyoming Accountability in Education Act - 1/16/14 Presentation
 
Educ 6240 assignment one data overview
Educ 6240 assignment one  data overviewEduc 6240 assignment one  data overview
Educ 6240 assignment one data overview
 
Understanding Assessments
Understanding AssessmentsUnderstanding Assessments
Understanding Assessments
 
Teacher Rating 2013-2014
Teacher Rating 2013-2014Teacher Rating 2013-2014
Teacher Rating 2013-2014
 
002709_2012-2013_BUILD
002709_2012-2013_BUILD002709_2012-2013_BUILD
002709_2012-2013_BUILD
 
Growth Analysis
Growth AnalysisGrowth Analysis
Growth Analysis
 
MCAS Analysis Educational Growth
MCAS Analysis Educational GrowthMCAS Analysis Educational Growth
MCAS Analysis Educational Growth
 
Readiness Matters: The Impact of College Readiness on College Persistence and...
Readiness Matters: The Impact of College Readiness on College Persistence and...Readiness Matters: The Impact of College Readiness on College Persistence and...
Readiness Matters: The Impact of College Readiness on College Persistence and...
 
MCAS Presentation Nov 27, 2018
MCAS Presentation Nov 27, 2018MCAS Presentation Nov 27, 2018
MCAS Presentation Nov 27, 2018
 
Nat faq
Nat faqNat faq
Nat faq
 
CogAt Introduction
CogAt IntroductionCogAt Introduction
CogAt Introduction
 
Cognitive Abilities Test Parent Presentation
Cognitive Abilities Test Parent PresentationCognitive Abilities Test Parent Presentation
Cognitive Abilities Test Parent Presentation
 
School Effectiveness, Accountability and Improvement
School Effectiveness, Accountability and ImprovementSchool Effectiveness, Accountability and Improvement
School Effectiveness, Accountability and Improvement
 
Slic Vs Control Data
Slic Vs Control DataSlic Vs Control Data
Slic Vs Control Data
 
School_Quality_Guide_2014_EMS_X125
School_Quality_Guide_2014_EMS_X125School_Quality_Guide_2014_EMS_X125
School_Quality_Guide_2014_EMS_X125
 
Teacher Rating 2012-2013
Teacher Rating 2012-2013Teacher Rating 2012-2013
Teacher Rating 2012-2013
 
Ocean City Intermediate School report card 2013-14
Ocean City Intermediate School report card 2013-14Ocean City Intermediate School report card 2013-14
Ocean City Intermediate School report card 2013-14
 
PSE 2014 Results
PSE 2014 ResultsPSE 2014 Results
PSE 2014 Results
 
Ocean City High School report card 2013-14
Ocean City High School report card 2013-14Ocean City High School report card 2013-14
Ocean City High School report card 2013-14
 
CogAt Parent Presentation
CogAt Parent PresentationCogAt Parent Presentation
CogAt Parent Presentation
 

002709_2011-2012_BUILD

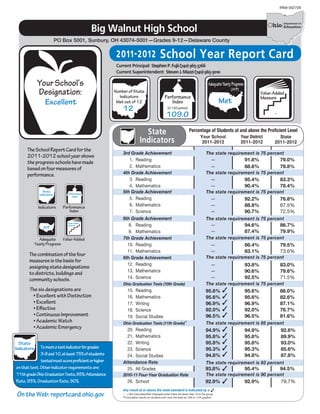
  • 1. Tomeetatestindicatorforgrades 3-8and10,atleast75%ofstudents testedmustscoreproficientorhigher onthattest.Otherindicatorrequirementsare: 11thgradeOhioGraduationTests,85%;Attendance Rate, 93%; Graduation Rate, 90%. State Indicators 2011-2012 School Year Report Card The state requirement is 75 percent The state requirement is 75 percent The state requirement is 75 percent The state requirement is 75 percent The state requirement is 75 percent The state requirement is 85 percent The state requirement is 93 percent The state requirement is 90 percent 3rd Grade Achievement 1. Reading 2. Mathematics 4th Grade Achievement 3. Reading 4. Mathematics 5th Grade Achievement 5. Reading 6. Mathematics 7. Science 6th Grade Achievement 8. Reading 9. Mathematics 7th Grade Achievement 10. Reading 11. Mathematics 8th Grade Achievement 12. Reading 13. Mathematics 14. Science Ohio Graduation Tests (10th Grade) 15. Reading 16. Mathematics 17. Writing 18. Science 19. Social Studies Ohio Graduation Tests (11th Grade) 20. Reading 21. Mathematics 22. Writing 23. Science 24. Social Studies Attendance Rate 25. All Grades 2010-11 Four-Year Graduation Rate 26. School The state requirement is 75 percent The state requirement is 75 percent The six designations are • Excellent with Distinction • Excellent • Effective • ContinuousImprovement • Academic Watch • Academic Emergency Value-AddedAdequate YearlyProgress Performance Index Indicators TheSchoolReportCardforthe 2011-2012schoolyearshows theprogressschoolshavemade basedonfourmeasuresof performance. Thecombinationofthefour measuresisthebasisfor assigningstatedesignations todistricts,buildingsand communityschools. Your School’s Designation: Performance Index State Indicators Performance Index OntheWeb:reportcard.ohio.gov State Indicators (0-120 points) * Your School 2011-2012 Your District 2011-2012 State 2011-2012 Percentage of Students at and above the Proficient Level Any result at or above the state standard is indicated by a . -- = Not Calculated/Not Displayed when there are fewer than 10 in the group. Cumulative results for students who took the tests as 10th or 11th graders. * Current Principal: Current Superintendent: Value-Added Component Score = met + = above – = below Value-Added Measure Value-Added Component Score = met + = above – = below Value-Added Measure AYP IRN# 002709 Big Walnut High School PO Box 5001, Sunbury, OH 43074-5001—Grades 9-12—Delaware County Excellent 12 Met -- StevenJ.Mazzi(740)965-3010 StephenP.Fujii(740)965-3766 Number of State Indicators Met out of 12 109.0 91.8% 88.6% 95.4% 90.4% 92.2% 88.8% 90.7% 94.6% 87.4% 86.4% 83.1% 93.8% 90.6% 92.5% 95.6% 95.6% 96.9% 92.0% 96.5% 79.0% 79.8% 83.3% 78.4% 76.8% 67.5% 72.5% 86.7% 79.9% 79.5% 73.6% 83.0% 79.6% 71.5% 86.0% 82.6% 87.1% 76.7% 81.6% -- -- -- -- -- -- -- -- -- -- -- -- -- -- 95.6% 95.6% 96.9% 92.0% 96.5% 94.9% 95.8% 95.8% 95.3% 94.8% 92.6% 89.9% 93.0% 85.6% 87.8% 94.9% 95.8% 95.8% 95.3% 94.8% 95.4% 94.5%93.8% 92.9% 79.7%92.9%
  • 2. 2 All students in the school for a full academic year are included in the results. The State Indicators are based on state assessments, as well as on attendance and graduationrates. Toearnanindicator forAchievementor GraduationTests,at least75% ofstudents mustreach proficient orabovefor the given assessment. For the 11th grade Ohio GraduationTests indicators,acumulative 85%passagerateforeach assessmentis required. State Indicators Your School’s Assessment Results Over Time Big Walnut High School, Delaware County
  • 3. 3 Overall Composite Scores reflect grade level and overall composite ratings for the 2011-2012 school year. Value-Added Measure Grade 4 Grade 5 Grade 6 Grade 7 Grade 8 Reading Mathematics On the Web: reportcard.ohio.gov Yourschool’sValue-Addedratingrepresentstheprogressyour schoolhasmadewithitsstudentssincelastschoolyear. Incontrast,achievementscoresrepresentstudents’performance atapointintime. Ascoreof“Above”indicatesgreaterthanoneyearof progresshasbeenachieved;“Met”indicatesoneyearofprogresshas beenachieved;“Below”indicateslessthanoneyearofprogresshasbeen achieved.Value-Addedresultsarecomputedonlyforbuildingsthatinclude sufficienttestingdataforstudentsinanygrade4through8. Met Expected Growth = - Below Expected Growth = + Above Expected Growth = Legend Performance Index Performance Level Across Grades 3-8 and 10 for All Tested Subjects (Includes every student enrolled in the school for a full academic year) X =WeightPercentage Points Your School’s Performance Index Performance Index Calculations for the 2011-2012 School Year 0.0 0.3 0.6 1.0 1.1 1.2 Untested Limited Basic Proficient Accelerated Advanced X X X X X X = = = = = = ThePerformance Index reflects the achievementofeverystudent enrolledforthefullacademic year.ThePerformanceIndex isaweightedaveragethatincludes alltestedsubjectsandgradesand untestedstudents.Thegreatest weightisgiventoadvancedscores (1.2);theweightsdecreaseforeach performancelevelandaweightof zeroisgiventountestedstudents. Thisresultsinascalefrom0to120 points.ThePerformanceIndexcanbe comparedacrossyearstoshow schoolachievementtrends. Performance Index 2011-2012 2010-2011 2009-2010 Performance Index Over Time Note: Value-Added results are computed only for buildings that include students in grades 4 through 8. Value-Added Component Score = met + = above – = below d e w Value-Added Measure Big Walnut High School, Delaware County 0.0 1.4 3.3 20.4 36.5 38.3 0.0 0.4 2.0 20.4 40.2 46.0 109.0 109.0 103.6 101.8
  • 4. All Students All Students Asian or Pacific Islander Asian or Pacific Islander Econ. Disadvtgd Econ. Disadvtgd Multi-Racial Multi-RacialHispanic Hispanic Students with Disabilities Students with Disabilities Limited English Proficient Limited English Proficient White, non-Hispanic White, non-Hispanic American Indian/ Alaska Native American Indian/ Alaska Native Black, non-Hispanic Black, non-Hispanic 4 Grades 3-8 and 10 Reading and Mathematics Adequate Yearly Progress All Students PercentProficientPercentTested Economically Disadvantaged Asian/Pacific Islander Black, non-Hispanic American Indian/Alaska Native Hispanic Multi-Racial White, non-Hispanic Students with Disabilities Limited English Proficient Reading Mathematics Reading Mathematics Graduation Rate Attendance Rate* Legend Adequate Yearly Progress (AYP) Reading Proficiency: Mathematics Proficiency: Reading Participation: Mathematics Participation: Attendance Rate: AYP Determination by Indicator Graduation Rate: AYP Determination by Subgroup AYP Determination for Your School: This legend explains terms used in the above chart that describe whether each student group met this year’s AYP goals. For test indicators, AYP can be met in one of four ways: 1) meeting the AYP targets with current year results; 2) meeting the AYP targets with two-year combined results; 3) meeting the improvement requirements of Safe Harbor; 4) meeting the AYP targets with projected results. Class of 2010 Five-Year Graduation Rate Information For the non-test attendance rate indicator, AYP can be met in one of three ways: 1) meeting the AYP target with the current year results; 2) meeting the AYP target with two-year combined results; 3) making improvement over the previous year. For the non-test graduation rate indicator, AYP can be met in one of two ways: 1) meeting the AYP target with the current year results; 2) making a 2 percentage point improvement over the previous year. Attendance Rate is evaluated only for the All Students subgroup.* NR N/A Met Not Met Not Required – This indicator was not evaluated for this subgroup because the subgroup size was smaller than the minimum number needed to achieve a statistically reliable result. 30 students is the minimum size for the proficiency and non-test indicators, while 40 is the minimum size for the participation rate indicators. This subgroup met AYP for this indicator with its current year, two-year combined, Safe Harbor, or growth measure results. This subgroup did not meet AYP for this indicator. Not applicable. Class of 2011 Four-Year Graduation Rate Information Met Met Met Met Met NR NR NR NR NR NR NR NR NR NR NR NR NR NR NR NR Met Met Met Met Met NR NR NR NR Met NR NR NR NR NR NR Met NR NR Met Met NR NR NR NR NR Met Met NR Met Met NR NR NR NR NR Met Met NR Met Met Met Met Met N/A Met Big Walnut High School, Delaware County N/A 95.0%92.9% ---- ---- ---- ---- ---- ---- 81.3%83.8% 86.1%78.8% 95.0%92.6%
  • 5. -- = Not Calculated/Not Displayed when there are fewer than 10 in the group. Reading Writing Mathematics Science Social Studies Reading Writing Mathematics Science Social Studies Reading Writing Mathematics Science Social Studies Reading Writing Mathematics Science Social Studies Reading Writing Mathematics Science Social Studies Black, non-Hispanic American Indian/ Alaska Native Asian or Pacific Islander Hispanic Multi- Racial White, non-Hispanic Non- Disabled Students Students with Disabilities Migrant Non- Econ. Disadvtgd Econ. Disadvtgd Limited English Proficient Female Male Your School’s Percentage of Students at Each Performance Level Percentage of Students Scoring Limited Percentage of Students Scoring Basic Percentage of Students Scoring Proficient Percentage of Students Scoring Accelerated Percentage of Students Scoring Advanced State and Federally Required School Information 5 Number of Limited English Proficient Students Excluded from Accountability Calculations Average Daily Student Enrollment Black, non- Hispanic American Indian or Alaska Native Asian or Pacific Islander Hispanic Multi-Racial White, non- Hispanic Students with Disabilities Migrant Economically Disadvantaged Limited English Proficient Your School’s Students 2011-2012 Underthefederal NoChildLeftBehind Act, states are required to report certaindataabout schoolsandteachers. Datapresentedhere areforreporting purposesonlyand arenotusedinthe computationofthe statedesignation fordistrictsand schools. Your BuildingYour Building’s Poverty Status*: District Percentage of teachers with at least a Bachelor’s Degree Percentage of teachers with at least a Master’s Degree Percentage of core academic subject elementary and secondary classes not taught by highly qualified teachers Percentage of core academic subject elementary and secondary classes taught by properly certified teachers Percentage of core academic subject elementary and secondary classes taught by teachers with temporary, conditional or long-term substitute certification/licensure School Teacher Information *High-poverty schools are those ranked in the top quartile based on the percentage of economically disadvantaged students. Low-poverty schools are those ranked in the bottom quartile based on the percentage of economically disadvantaged students. -- = Not Calculated/Not Displayed when there are fewer than 10 in the group. 921 -- Big Walnut High School, Delaware County Low Poverty -- -- -- -- -- -- -- -- -- -- -- -- -- -- -- -- -- -- -- -- -- -- -- -- -- -- -- -- -- -- -- -- -- -- -- -- -- -- -- -- -- -- -- -- -- -- -- -- -- -- -- -- -- -- -- -- -- -- -- -- -- -- -- -- -- -- -- -- -- -- -- -- -- -- -- -- -- -- -- -- -- -- -- -- -- -- -- -- -- -- -- -- -- -- -- -- -- -- -- -- -- -- -- -- -- -- -- -- -- -- -- -- -- -- -- -- -- -- -- -- -- -- -- -- -- 1.4 0.9 2.4 0.9 1.9 2.8 2.4 1.9 6.6 1.9 22.2 27.4 16.5 15.6 20.8 39.6 65.1 24.5 29.7 22.2 34.0 4.2 54.7 47.2 53.3 0.0 0.0 0.0 0.0 0.0 1.0 0.0 0.5 5.1 1.5 19.5 22.6 14.9 12.8 19.0 41.0 73.3 23.1 30.8 21.5 38.5 4.1 61.5 51.3 57.9 9.7 6.5 16.1 6.5 12.9 16.1 16.1 12.9 19.4 3.2 38.7 54.8 25.8 32.3 35.5 29.0 19.4 35.5 22.6 32.3 6.5 3.2 9.7 19.4 16.1 -- -- -- -- -- -- -- -- -- -- -- -- -- -- -- -- -- -- -- -- -- -- -- -- -- 1.0 1.0 1.5 1.0 1.0 2.1 1.5 2.1 5.1 2.1 21.5 23.6 14.4 14.9 18.5 40.0 69.2 26.2 30.3 24.6 35.4 4.6 55.9 48.7 53.8 3.2 0.0 6.5 0.0 6.5 9.7 6.5 3.2 19.4 0.0 25.8 48.4 29.0 19.4 38.7 35.5 45.2 16.1 25.8 12.9 25.8 0.0 45.2 35.5 41.9 -- -- -- -- -- -- -- -- -- -- -- -- -- -- -- -- -- -- -- -- -- -- -- -- -- 0.9 0.0 1.8 0.0 1.8 4.5 1.8 1.8 7.3 3.6 17.3 18.2 18.2 18.2 22.7 35.5 73.6 21.8 28.2 20.9 41.8 6.4 56.4 46.4 50.9 1.7 1.7 2.6 1.7 1.7 1.7 2.6 2.6 6.9 0.0 26.7 35.3 14.7 12.9 19.8 43.1 58.6 27.6 31.0 25.0 26.7 1.7 52.6 47.4 53.4 1.6% -- -- 2.1% 3.7% 91.8% 13.5% -- 13.1% -- 100.0% 100.0% 63.7% 60.7% 0.6% 0.2% 99.1% 99.6% 0.0% 0.0%
  • 6. 6 1. IfaschoolmeetsAYPinthecurrentyear,itcanbe ratednolowerthanContinuousImprovement. 2. IfanExcellentorEffectiveschooldoesnotmeetAYP forthesametwo(ormore)subgroupsforthree consecutiveyears,itsratingwillbedecreasedto EffectiveorContinuousImprovement(respectively). Oncethepreliminarydesignationisdetermined,Value-Added, thefourthmeasureintheaccountabilitysystem,isevaluated todeterminetheimpact(ifany)ontheschool’sfinal designation. 1. Ifyourschool’sdesignationeitherisincreasedordecreased duetoAYP,Value-Addedhasnoimpactonthedesignation andthepreliminarydesignationbecomesthefinaldesignation. 2. Ifyourschoolexperiencesaboveexpectedgrowthinthe currentyear,yourschool’sfinaldesignationwillincrease byonedesignation. 3. Ifyourschoolexperiencesbelowexpectedgrowthforat leasttwoconsecutiveyears,yourschool’sfinal designationwilldecreasebyonedesignation. Thepreliminarydesignationresultsfromidentifyingthe highervaluebetweenthepercentageofindicatorsmet byyourschoolandyourschool’sPerformanceIndex. AYPthenisevaluatedtodetermineitseffectonthe preliminarydesignation. Therearetwowaysinwhich AYPcanaffectthepreliminarydesignation. Determiningyourschool’sreportcarddesignationisamulti-stepprocess. Thefirststepistodetermineapreliminarydesignation,which isbasedonthefollowingcomponents:1)thepercentageofindicatorsmet,2)thePerformanceIndexand3)AYPdetermination. Determining Your School’s Designation Indicators Met Performance Index AYP Designation Preliminary Designation 94%-100% 100 to 120or or or or or and and and and and andand Met or Not Met Excellent or Effective 75%-93.9% 0%-74.9% 50%-74.9% 31%-49.9% 0%-30.9% 90 to 99.9 80 to 89.9 0 to 89.9 70 to 79.9 0 to 69.9 Met or Not Met Not Met Not Met Not Met Met Effective or Continuous Improvement Academic Watch Academic Emergency Continuous Improvement = = = = = = Preliminary Designation Value-Added Measure* Final Designation Excellent Effective Continuous Improvement Academic Watch Academic Emergency Above expected growth in the current year and and and and and Excellent with Distinction Effective Above expected growth in the current year Above expected growth in the current year Above expected growth in the current year Above expected growth in the current year Excellent Continuous Improvement Academic Emergency Academic Watch Academic Emergency Continuous Improvement Academic Watch Effective *Inallothercases,Value-Addedwillhavenoimpactonthedesignationandthepreliminarydesignationwillbecomethefinaldesignation. or or or or or Value-Added Component Score = met + = above – = below Below expected growth for 2 consecutive years Below expected growth for 2 consecutive years Below expected growth for 2 consecutive years Below expected growth for 2 consecutive years Below expected growth for 2 consecutive years Big Walnut High School, Delaware County
  • 7. 7 The National Assessment of Educational Progress (NAEP), oftenreferredtoas“TheNation’sReportCard,”istheonlynationallyrepresentativeand continuingassessmentthatenablesthecomparisonofperformanceinOhioandotherstates invarioussubjectareas.Schoolsandstudentswithineachstateareselectedrandomlyto beapartoftheassessment.Notallstudentsinthestateorinaparticularschooltakethe assessment.Dataarereportedatthestatelevelonly,andtherearenoindividualstudentor evenschoolsummaryresults.Theassessmentsareconductedinmathematics,reading,science, writing,thearts,civics,economics,geographyandU.S.history. ToviewOhio’smostrecent NAEPresults,goto: andsearchforkeyword“NAEP” http://education.ohio.gov Big Walnut High School, Delaware County