Recommended

Recommended
More Related Content
Similar to Poster reesterificados
Similar to Poster reesterificados (20)
Poster reesterificados
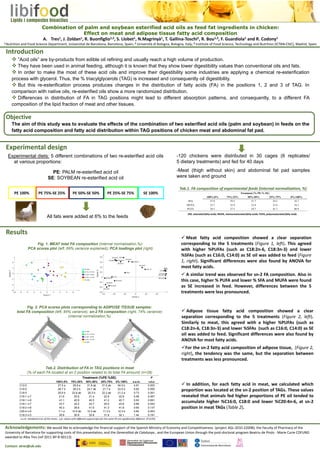
- 1. Experimental design Results . . Combination of palm and soybean esterified acid oils as feed fat ingredients in chicken: Effect on meat and adipose tissue fatty acid composition A. Tres1, J. Zoldan1, R. Buonfiglio1,2, S. Llobet1, N.Magrinyà1, T. Gallina‐Toschi2, R. Bou1,3, F. Guardiola1 and R. Codony1 1 Nutrition and Food Science Department, Universitat de Barcelona, Barcelona, Spain; 2 Università di Bologna, Bologna, Italy; 3 Institute of Food Science, Technology and Nutrition (ICTAN‐CSIC), Madrid, Spain Introduction Objective ”Acid oils” are by-products from edible oil refining and usually reach a high volume of production. They have been used in animal feeding, although it is known that they show lower digestibility values than conventional oils and fats. In order to make the most of these acid oils and improve their digestibility some industries are applying a chemical re-esterification process with glycerol. Thus, the % triacylglycerols (TAG) is increased and consequently oil digestibility. But this re-esterification process produces changes in the distribution of fatty acids (FA) in the positions 1, 2 and 3 of TAG. In comparison with native oils, re-esterified oils show a more randomized distribution. Differences in distribution of FA in TAG positions might lead to different absorption patterns, and consequently, to a different FA composition of the lipid fraction of meat and other tissues. The aim of this study was to evaluate the effects of the combination of two esterified acid oils (palm and soybean) in feeds on the fatty acid composition and fatty acid distribution within TAG positions of chicken meat and abdominal fat pad. Experimental diets: 5 different combinations of two re-esterified acid oils at various proportions: PE: PALM re-esterified acid oil SE: SOYBEAN re-esterified acid oil PE 100% PE 75%‐SE 25% PE 50%‐SE 50% PE 25%‐SE 75% SE 100% -120 chickens were distributed in 30 cages (6 replicates/ 5 dietary treatments) and fed for 40 days -Meat (thigh without skin) and abdominal fat pad samples were taken and ground Tab.1. FA composition of experimental feeds (internal normalization, %) Treatment (% PE:% SE) 100%:0% 75%:25% 50%:50% 25%:75% 0%:100% SFA 47.0 39.5 31.7 24.3 16.7 MUFA 32.7 32.9 33.4 33.4 34.3 PUFA 20.1 27.5 34.7 41.7 48.9 SFA, saturated fatty acids; MUFA, monounsaturated fatty acids; PUFA, polyunsaturated fatty acids All fats were added at 6% to the feeds SE 100% SE 75% ‐ PE 25% SE 50% ‐ PE50% SE 25% ‐ PE 75% PE 100% Fig. 1. MEAT total FA composition (internal normalization,%): PCA scores plot (left, 69% variance explained); PCA loadings plot (right) Meat fatty acid composition showed a clear separation corresponding to the 5 treatments (Figure 1, left). This agreed with higher %PUFAs (such as C18:2n‐6, C18:3n‐3) and lower %SFAs (such as C16:0, C14:0) as SE oil was added to feed (Figure 1, right). Significant differences were also found by ANOVA for most fatty acids. A similar trend was observed for sn‐2 FA composition. Also in this case, higher % PUFA and lower % SFA and MUFA were found as SE increased in feed. However, differences between the 5 treatments were less pronounced. Adipose tissue fatty acid composition showed a clear separation corresponding to the 5 treatments (Figure 2, left). Similarly to meat, this agreed with a higher %PUFAs (such as C18:2n‐6, C18:3n‐3) and lower %SFAs (such as C16:0, C14:0) as SE oil was added to feed. Significant differences were also found by ANOVA for most fatty acids. For the sn‐2 fatty acid composition of adipose tissue, (Figure 2, right), the tendency was the same, but the separation between treatments was less pronounced. In addition, for each fatty acid in meat, we calculated which proportion was located at the sn‐2 position of TAGs. These values revealed that animals fed higher proportions of PE oil tended to accumulate higher %C16:0, C18:0 and lower %C20:4n‐6, at sn‐2 position in meat TAGs (Table 2). Acknowledgements: We would like to acknowledge the financial support of the Spanish Ministry of Economy and Competitiveness (project AGL‐2010‐22008); the Faculty of Pharmacy of the University of Barcelona for supporting costs of this presentation, and the Generalitat de Catalunya , and the European Union through the post‐doctoral program Beatriu de Pinós ‐ Marie Curie COFUND awarded to Alba Tres (ref 2011 BP‐B 00113) Contact: atres@ub.edu Treatment (%PE:%SE) P 100%:0% 75%:25% 50%:50% 25%:75% 0%:100% s.e.m. value C12:0 27.5 a 29.9 a 31.8 ab 31.5 ab 54.5 b 4.91 0.003 C16:0 26.7 b 28.2 b 24.7 ab 21.7 a 22.0 a 0.82 0.000 C18:0 25.6 b 22.6 ab 25.3 b 22.2 ab 21.2 a 0.73 0.001 C16:1 n-7 21.6 20.8 21.4 22.9 22.8 0.56 0.067 C18:1 n-9 41.1 40.9 40.5 41.2 40.7 0.60 0.691 C18:1 n-7 23.7 24.2 22.7 25.0 23.6 0.89 0.543 C18:2 n-6 40.3 38.8 41.5 41.3 41.8 0.90 0.137 C20:4 n-6 7.1 a 10.5 ab 10.3 ab 11.3 b 12.3 b 0.84 0.003 C18:3 n-3 35.9 30.9 32.8 31.9 32.1 1.44 0.191 Tab.2. Distribution of FA in TAG positions in meat (% of each FA located at sn-2 position related to its total FA amount) (n=28) s.e.m: standard error of the mean; a,b: values with different superscripts for the same FA are significantly different (P<0.05) SE 100% SE 75% ‐ PE 25% SE 50% ‐ PE50% SE 25% ‐ PE 75% PE 100% Fig. 2. PCA scores plots corresponding to ADIPOSE TISSUE samples: total FA composition (left, 84% variance); sn-2 FA composition (right, 74% variance) (internal normalization,%)