Stock Pitch Fast Food Services PowerPoint Presentation PPT Slide Template
•
0 likes•186 views

- ABC is the largest restaurant company in Japan with over 7,600 restaurants. The analyst gives a buy recommendation with a $62 price target, representing 37% upside. - The Japanese QSR industry is highly fragmented and has significant growth potential as penetration rates are lower than other developed markets. ABC is well positioned to benefit from industry growth through store expansion and digitalization. - Successful digital strategies implemented by competitors demonstrate the opportunity for ABC. Increased adoption of mobile payments and delivery in Japan also support the growth outlook.

Recommended
Recommended
More Related Content
What's hot
What's hot (20)
Similar to Stock Pitch Fast Food Services PowerPoint Presentation PPT Slide Template
Similar to Stock Pitch Fast Food Services PowerPoint Presentation PPT Slide Template (20)
More from SlideTeam
More from SlideTeam (20)
Recently uploaded
Recently uploaded (20)
Stock Pitch Fast Food Services PowerPoint Presentation PPT Slide Template
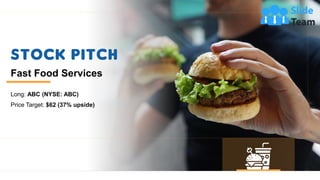
- 1. Stock Pitch Fast Food Services Long: ABC (NYSE: ABC) Price Target: $62 (37% upside)
- 2. Company Overview 2 ABC (NYSE: ABC) Hi 25.5 52 Week 2020 2021 EV / EBITDA P / E 11.1 x 10.2 x 25.4 x 22.7 x Low 43.5 Share Price (11/10) 43 Total Shares Outs. 385 Market Cap 16,055 (-) : Cash (1,477) (+) : Debt - (+) : Minority Interest 70 Enterprise Value 14,648 2020 2021 EV / EBITDA P / E Target Price $62 Implied Valuation xxx 15.7 x 14.7 xConsensus US 13.5 x 11.0 x 35.9 x 32.1 xConsensus 28.2 x 21.7 xUS Trading Stats Capitalization Trading Price The largest restaurant company in Japan Japan’s earliest restaurant chain to adopt digital payment Spin off from ABC! Brands (ABC) on Dec 1, 2017 Joint headquarters: Tokyo, Japan and Plano, TX USA ~421,000 employees and ~7,600 restaurants over 1100 cities
- 3. Quick Service Restaurants (QSR) Industry in Japan 3 Highly Fragmented QSR Industry in Japan Acc to unit count, Comp 1 is largest chain followed by Comp 2 11% 89% Japan 45% 55% US Sustainable Growth Rate 0 1000 2000 3000 4000 5000 2012 2013 2014 2015 2016 2017 2018 2019e 2020e Catering Industry Annual Sales 5,087 2,206 2,200 2,171 660 420 230 1,643 350 250 ABC Comp 2 Comp 3 Comp 4 Comp 5 Comp 6 Comp 7 Chain Independent JPY (bn) Delivery Keys to Compete Digitally 0 40 80 120 160 200 2012 2013 2014 2015 2016 2017 2018 2019e 2020e Online-to-offline (O2O) Food Delivery SalesJPY (bn)
- 4. Why ABC? 4 In a rapidly growing and under-penetrated market, store count grows at high-single-digit (especially in lower-tier cities), increasing operating leverage with margins SSSg improves to mid-single-digit with best-in-class integrated digital + delivery ecosystem – the XYZ’s model Local, experienced, and focused management could deliver additional upside from Comp 2 turnaround
- 5. I. Growth Perspective 5 GDP per capita correlated with QSR penetration, suggesting Japan has huge growth potential Japan’s QSR Industry in 10x Under-indexed Below Average Lower-tier Cities 1,263 927 624 524 340 627 222 172 78 42 17 8 4 0 400 800 1,200 1,600 No Fast Food Chain / MM Population 2018 Average = 351 0 10000 20000 30000 40000 50000 60000 70000 0% 5% 10% 15% 20% 25% GDP per Capita Japan 2029 6.0% GDP GAGR => Store # up 10x in 10 Years USA Hong Kong Malaysia Maldives BhutanPhilippinesJapan India 0 2 4 6 8 10 12 24,072 14,926 12,343 10,771 9,671 7,578 5,105 2,279 # of Western QSR / MM Population Av.GDP pf City Tiers
- 6. I. Growth Perspective (Cont…) 6 Operating Leverage Significance Cash Flow Driver for Store Count 25% 27% 29% 31% 33% 35% 37% 39% Q1 Q2 Q3 Q4 Q1 Q2 Q3 Q1 Q2 Q3 Cost as % of Revenue Occupancy Costs Food and Paper 2017 2018 2019 0% 2% 4% 6% 8% 10% 12% 14% 16% 18% 20% 0 1000 2000 3000 4000 5000 6000 7000 8000 2015 2016 2017 2018 Store Count & Restaurant Margins Store Count Growth Restaurant Margin Cash Flow % of Revenue › Growth is important to cash flow growth. Large fixed cost base (eg rent) creates significant operating leverage. › Expansion into 2nd and 3rd tier cities further lower % occupancy costs, as same menu pricing and traffic support lower rents How Growth is Important
- 7. II. Digitalization in Japan 7 3.5% 4% 18.5% 42.6% 50.7% 74.6% 78.5% 83% 85.2% 96.5% 96% 81.5% 57.4% 49.3% 25.4% 21.5% 17% 14.8% 0% 20% 40% 60% 80% 100% 2011 2012 2013 2014 2015 2016 2017e 2018e 2019e 2011 -2019 Mobile Vs. Non Mobile Payment % Market Share in Japan Mobile Pmt Non Mobile Pmt 0.1 0.2 1.2 6 12.2 58.8 98.7 165.9 229 36.3% 89.2% 77% 345.3% 103.5% 348.9% 68% 68% 38% 0 50 100 150 200 250 300 350 2011 2012 2013 2014 2015 2016 2017e 2018e 2019e 2013 -2021 Japan 3rd Party Mobile Payment Transaction Volume Transaction Amt in Trillion RMB YTY % Change Japan's Cashless Revolution › In 2018, Japan’s mobile payments hit $9 trillion, roughly 80 times the size of America’s $112 billion market › Japan’s mobile payment lead due to lack of alternatives (such as convenient credit card) and low denomination of paper currency › Digital strategy lynchpin to success in Japan, where availability of mobile channels can drive purchase decisions, especially young consumers No Contest When it comes to mobile payments, China dwarfs the US $ 8$ 15 $ 30 $ 50 $ 75 $ 90 -$ 20 $ 0 $ 20 $ 40 $ 60 $ 80 $ 100 $ 120 Japan US
- 8. Digitalization in Japan (contd..) 8 Successful strategy creates immense shareholder The Internet of Pizza – just the latest digital topping for Comp 1 Comp 1 builds customer loyalty and lowers costs with best in-class digital tech in US Between 2008 and 2010 Comp 1’s Pizza was in crisis, leads to negative SSSg and plummeting sales Launched app April 2013 - digital sales surpass $ 1.1 billion within one year. SSSg improves to 12% by 2012 30% 40% 45% 50% 60% 3.1% 9.5% 7.5% 12% 10% 0% 2% 4% 6% 8% 10% 12% 14% 16% 15% 25% 35% 45% 55% 65% 75% 85% 2013 2014 2015 2016 2017 Comp 1’s % of Sales via Digital and SSG % of Sales Via Digital (LHS) SSG (RHS) 0% 2% 4% 6% 8% 10% 12% Comp 1 Comp 2 Comp 3 Comp 4 Comp 5 Comp 6 Comp 7 Comp 8 Comp 9 Comp 10 Top 10 QSR Brands Average Same Store Sales Q4 2015 – Q3 2016 In US Market Comp 1’s Pizza in US
- 9. III. Strong Potential Upside from Comp 1 9 -30% -20% -10% 0% 10% 20% 30% Q1 Q2 Q3 Q4 Q112 Q2 Q3 Q4 Q113 Q2 Q3 Q4 Q114 Q2 Q3 Q4 Q1 Q2 Q3 Q4 Q115 Q2 Q3 Q4 Q116 Q2 Q3 Q4 Q17 Q2 Q3 Q4 Comp 2 SSSg food scandals rebounded under Ms. X › Under XYZ since 2016, after being hit by food safety scandals Comp 2 staged impressive turnaround › Mr.X became CEO in April 2018 › Significant knowledge transfer to Comp 1 with replicable turnaround strategies o Focus on food: Focus on hits and local favorites by slimming down the menu o Moving to digital: Comp 1 launched app in Sept 2018 and has synchronized membership with Comp 2 o New models: store and image upgrade › Long-term effort with short-term pain: investors remain in show-me mode. Results prove potential upside2011 2012 2013 2014 2015 2016 2017 3 30 1Q 16 3Q 17 10% 25% 1Q 16 3Q 17 8% 35% 1Q 16 3Q 17 Member SalesMember Member sales % of system Sales Mobile Payment Mobile Payments as % of company SalesLoyalty Member Count Comp 1 is rapidly moving digital following Comp 2 -12% -10% -4% -3% 2% 0% 0% -14% -10% -6% -2% 2% 1Q 16 2Q 16 3Q 16 4Q 16 1Q 17 2Q 17 3Q 17 Comp 1 SSSg turns Positive Same-store sales growth (y/y)1 Ms. X took charge of Comp 2 KFC SSG Pizza Hut SSG
- 10. Strong Potential Upside from Comp 1 (contd..) 10 How to maintain the Restaurants Margin Comp 1 Restaurant Margin in 2020 12.0% 14.0% 16.0% 18.3% 20.0% 22.0% Comp1 Avg SSSg 2020 -2.4% 1,693 1,693 1,779 1,829 1,865 1,908 -0.4% 1,731 1,731 1,817 1,866 1,903 1,946 1.6% 1,770 1,770 1,856 1,905 1,942 1,985 3.6% 1,810 1,810 1,896 1,945 1,982 2,025 5.6% 1,850 1,850 1,936 1.985 2,022 2,065 7.6% 1,892 1,892 1,978 2,027 2,064 2,107 9.6% 1,935 1,935 2,021 2,070 2,107 2,150 11.6% 1,979 1,979 2,065 2,114 2,151 2,194 Comp 1 Restaurant Margin in 2020 12.0% 14.0% 16.0% 18.3% 20.0% 22.0% Comp1 Avg SSSg 2020 -2.4% 1,693 1,693 1,779 1,829 1,865 1,908 -0.4% 1,731 1,731 1,817 1,866 1,903 1,946 1.6% 1,770 1,770 1,856 1,905 1,942 1,985 3.6% 1,810 1,810 1,896 1,945 1,982 2,025 5.6% 1,850 1,850 1,936 1.985 2,022 2,065 7.6% 1,892 1,892 1,978 2,027 2,064 2,107 9.6% 1,935 1,935 2,021 2,070 2,107 2,150 11.6% 1,979 1,979 2,065 2,114 2,151 2,194 2021 EBITDA sensitivity turnaround to Comp 2 Comp 1 turnaround sensitivity of share price (Based on 2021 EV/EBITDA)
- 11. Valuation 11 2019E 2020E 2021E 2022E 7,062 7,922 9,160 10,637 4.5% 12.2% 15.6% 16.1% 1,33, 1,555 1,905 2,174 18.8% 19.6% 20.8% 20.4% 1.76 2.06 2.69 3.12 29.0% 17.2% 30.2% 16.1% Revenue % Growth % Growth % Growth EBITDA EPS 2019E 2020E 2021E 2022E 7,035 7,552 8,059 8,647 4.2% 7.3% 6.7% 7.3% 1,196 1,332 1,428 1,576 17.0% 17.6% 17.7% 18.2% 1.42 1.62 1.81 2.14 4.0% 14.1% 11.7% 18.2% 2019E 2020E 2021E 2022E 0.4% 4.9% 13.7% 23.0% 11.03% 16.7% 33.4% 38.0% 24.0% 27.3% 48.4% 45.8% Store count CAGR: 7% for Comp 3, 10% for Comp 2, hitting managements LT target of 20k stores in 10 years Key Assumptions: SSSg: gradual increase on digital + delivery leverage, with Comp 3 converging to Comp 1’s current SSSg in the next two years Margins: assume expansion into lower-tier cities by slightly leveraging on occupancy costs and labor costs by digital channels Capex: assume baseline per- store capex on new stores and remodeling Our View Consensus Difference
- 12. Methodology Metric Multiple Target Price $ 2021 EV / EBITDA $1,905 MM 11.0x 62 2021 P /E $988 MM 23.0x 63 SOTP 2021 EV/ EBITDDA 9.0x -14.0x 71 DCF 63 DCF + Idle cash deployment 67 Valuation (cont…) 12 Target price based on 2021 EV / EBITDA multiple, with sense check against other relative and intrinsic methodologies: EBITDA x most appropriate 1) Due to different franchise vs. owned splits, significant capital structures differ 2) share buyback programs differ across peers Two-year look-ahead for normalized Comp 1 earnings post turnaround SOTP assumes Comp 2 trades up to DM-based QSR multiples, while Comp 1 trades around Chinese QSR multiples. DCF assumes 9.0% WACC and 3.0% terminal growth rate
- 13. Potential Upside through Capital Structure 13 Highly cash generative business -> significant cash build without dividend / share buybacks In addition to share buyback, management has announced intent to pursue “strategic acquisitions” funded by internal cash flows While dividend / buybacks creates no enterprise value, strategic acquisitions using idle cash can provide value upside Additional interest tax shield could result if ABC funds buyback with debt Value of Cash Deployment 2019-2021 0 500 1000 1500 2000 0 1000 2000 3000 4000 5000 6000 7000 2019 2020 2021 2022 2023 Cash Balance Unlevered FCF Hypothetical Cash Buld without div / Buyback Cash Deployment Value 2019 2020 2021 Free cash Flow 802 862 1,143 Commit.on Div / Buyback (150) (150) (150) Cash to deploy @80% 326 356 497 Increment EBITDA @20 % !RR 136 171 Increment Value (US $ MM) 1,637 1,876 Incremental share Price ($) 4.26 4.88 Share Price Impact Sensitivity 2020 EV / EBITDA % Post Div/Buyback Free Cash Flow Deployed 10% 20% 30% 40% 50% IRR on Cash Deployed 5.0% 0.2 0.4 0.6 0.9 1.1 10.0% 0.4 0.9 1.3 1.7 2.1 15.0% 0.6 1.3 1.9 2.6 3.2 20.0% 0.9 1.7 2.6 3.4 4.3 25.0% 1.1 2.1 3.2 4.3 5.3 30.0% 1.3 2.6 3.8 5.1 6.4 35.0% 1.5 3.0 4.5 6.0 7.5
- 14. Supplier risk and food safety Foreign exchange persists headwinds Food and labor cost inflation Customers shift to new healthier food Risk Mitigation Plan 14 Mitigation Plan ABC reduced number of supplier to reduce the food quality issues and added more quality control experts Stem persistent capital outflow commitment and top priority macroeconomic stability of current administration Long-term supplier contract and high digital adoption mitigates significant cost hikes. ABC continues premium concept store roll-outs to upsell with menu upgrades New concept stores like K Pro and Ph+ model are providing high-end healthier food Risk Factors
- 15. Stock Pitch- Fast Food Services Icons slide 15
- 17. Clustered Column 17 80 50 60 30 45 78 59 40 $0 $20 $40 $60 $80 $100 2016 2018 2019 2020 Sales(inUSDmillions) Years Product 01 This graph/chart is linked to excel, and changes automatically based on data. Just left click on it and select “Edit Data”. Product 02 This graph/chart is linked to excel, and changes automatically based on data. Just left click on it and select “Edit Data”. Product01 Product02 Years
- 18. Stacked Column 18 4.3 2.5 -3.5 -4.5 2.4 4.4 -1.8 -0.8 -6 -4 -2 0 2 4 6 8 Product 01 This graph/chart is linked to excel, and changes automatically based on data. Just left click on it and select “Edit Data”. Product 02 This graph/chart is linked to excel, and changes automatically based on data. Just left click on it and select “Edit Data”. Sales(inUSDmillions)
- 19. Our Target 19 This slide is 100% editable. Adapt it to your needs and capture your audience's attention. This slide is 100% editable. Adapt it to your needs and capture your audience's attention. This slide is 100% editable. Adapt it to your needs and capture your audience's attention. This slide is 100% editable. Adapt it to your needs and capture your audience's attention. This slide is 100% editable. Adapt it to your needs and capture your audience's attention.
- 20. Magnifying Glass This slide is 100% editable. Adapt it to your needs and capture your audience's attention. Text Here This slide is 100% editable. Adapt it to your needs and capture your audience's attention. Text Here This slide is 100% editable. Adapt it to your needs and capture your audience's attention. Text Here 20
- 21. Puzzle 21 01 02 03 04 05 This slide is 100% editable. Adapt it to your needs and capture your audience's attention. This slide is 100% editable. Adapt it to your needs and capture your audience's attention. This slide is 100% editable. Adapt it to your needs and capture your audience's attention. This slide is 100% editable. Adapt it to your needs and capture your audience's attention. This slide is 100% editable. Adapt it to your needs and capture your audience's attention.
- 22. Post It Notes 22 01 02 03 04 This slide is 100% editable. Adapt it to your needs and capture your audience's attention. Text Here This slide is 100% editable. Adapt it to your needs and capture your audience's attention. Text Here This slide is 100% editable. Adapt it to your needs and capture your audience's attention. Text Here This slide is 100% editable. Adapt it to your needs and capture your audience's attention. Text Here
- 23. Venn 23 01 02 03 This slide is 100% editable. Adapt it to your needs and capture your audience's attention. Text Here This slide is 100% editable. Adapt it to your needs and capture your audience's attention. Text Here This slide is 100% editable. Adapt it to your needs and capture your audience's attention. Text Here
- 24. Comparison 24 345K 3M 492K 60%Female Users This slide is 100% editable. Adapt it to your needs and capture your audience's attention. 40% Male Users This slide is 100% editable. Adapt it to your needs and capture your audience's attention. 265K 2M 232K
- 25. Thank you Email Address emailaddress123@gmail.com Contact Number 0123456789 Address # street number, city, state 25