SlideShare a Scribd company logo
1 of 20
Download to read offline
1.	 Constant currency (CCY)*.
2.	 Percentage points.
*	 Alternative Performance Measures (APM), refer to the ‘2021 Full Year APM’ document.
2021 Full Year
Results
Revenue
CHF 6.4 BN
+14.2%1
	 +8.9% organic*
Profit for the Period
CHF 655 MIO
+29.7%
Basic Earnings Per Share
CHF 81.91
+27.9%
Proposed Dividend
CHF 80
Return on Invested Capital*
19.6%
+3.1pp2
Adjusted Operating Income*
CHF 1 055MIO
+16.8%1
Adjusted Operating Income Margin*
16.5%
+0.4pp1,2
Free Cash Flow*
CHF 635MIO
(16.2)%
SGS | 2021 Full Year Results
Financial Highlights
(CHF million) 2021 2020 Change in % 2020 CCY2
Change in
CCY2
%
Revenue 6 405 5 604 14.3 5 607 14.2
Operating income (EBIT) 977 795 22.9 799 22.3
Operating income margin 15.3% 14.2% 14.3%
Adjusted operating income* 1 055 900 17.2 903 16.8
Adjusted operating income margin* 16.5% 16.1% 16.1%
EBITDA* 1 476 1 312 12.5 1 318 12.0
Adjusted EBITDA* 1 515 1 324 14.4 1 329 14.0
Profit for the period 655 505 29.7
Profit attributable to equity holders of SGS SA 613 480 27.7
Adjusted profit attributable to equity holders of SGS SA* 670 565 18.6
Basic EPS (CHF) 81.91 64.05 27.9
Diluted EPS (CHF) 81.79 63.82 28.2
Adjusted basic EPS (CHF)* 89.46 75.44 18.6
Cash flow from operating activities 1 169 1 186 (1.4)
Free cash flow* 635 758 (16.2)
Return on invested capital* 19.6% 16.5%
Net debt* (1 691) (1 478)
Weighted average number of shares (‘000) 7 488 7 489
Average FTE1
93 297 89 098 4.7
1.	
Full Time Equivalent (FTE) employees.
2.	
Constant currency (CCY)*.
*	
Alternative Performance Measures (APM), refer to the ‘2021 Full Year APM’ document.
1
2021 Full Year
Results
SGS | 2021 Full Year Results
A year of significant progress
“We have made significant progress on our new strategic plan, which was implemented at the start of the year. At the same time, our
colleagues continue to deal with Covid-related challenges and sometimes tragedies in their personal lives. Their dedication and dynamism
through this challenging period remain the basis of our success.
“Our strong 2021 performance has confirmed our strategic focus. Combined with the investment in our platform we are building a thriving
future for SGS. We will continue to evolve into a more sustainable, digital and data-driven company to support our commitment to enable
a better, safer and more interconnected world for all our stakeholders.” Frankie Ng, CEO of SGS.
Building on our culture of sustainability at SGS
Through our culture at SGS, our employees continue to reinforce our sustainability leadership and enable impactful change.
•	 Our purpose of enabling a better, safer and more interconnected world has shaped our new corporate Sustainability Ambitions 2023
and 2030. These targets will be achieved by our colleagues ‘thinking sustainably’ when engaging with all stakeholders.
•	 To further support our customers to achieve their sustainability goals, we introduced our Sustainability Solutions Framework. This unifies
our comprehensive range of existing and new innovative services aligned with the UN Sustainable Development Goals, increasing their
value to society.
•	 We continued to align our capital allocation and management incentivization to sustainable criteria through: launching a €1 billion
sustainability-linked revolving credit facility; further elevating sustainability factors in the Operations Council capex approval process;
introducing sustainability KPIs in both our short-term and long-term management incentivization.
•	 Our 2020-2023 strategic evolution further integrated our financial and non-financial objectives by setting our three target criteria in parallel:
Planet, Performance and People.
Strategic progress
In May we communicated the next phase of our strategic evolution to make our global network more customer-centric and further aligned
to the key TIC megatrends. Much progress has been made in 2021 including:
•	 Accelerating net capex to 5.1% of Group revenue. This was concentrated on both our strategic priority areas and SGS’s platform to
accelerate our digital transformation.
•	 Allocating more operational capital to structurally growing markets including connectivity, semiconductors, mobility, biopharma,
environmental and food testing.
•	 Investing significantly in Digital  Innovation to create new products and services, improve customer experience and automate our
operations. Examples of this include: established an emerging technology competence center; developing digital; partnering with Microsoft
to accelerate the process; developing digital IoT and AI centers of excellence; establishing process, governance and KPIs to ensure progress.
•	 Acquiring Brightsight, which materially accelerates our global strategy to become the global TIC leader in cybersecurity and Quay
Pharmaceuticals, a leader in formulation research and development, further expanding our positioning along the Health Sciences supply
chain. In addition, we continued to integrate SGS Analytics, which significantly accelerates our European hub and spoke laboratory model
in high-volume environmental testing.
Financial discipline and focused capital allocation
In 2021, our strong operational performance was supported by our pricing initiatives and cost control in an inflationary environment, as well
as working capital management. At the same time, we have continued to invest in productivity across the global network.
•	 Organic* growth was particularly strong in our key strategic focus areas of Health  Nutrition, Connectivity  Products and Knowledge,
which are all tracking comfortably above 2019 revenue levels.
•	 Significant progress was made on the strategically important implementation of our ‘Level Up’ finance, IT and operations initiatives.
This includes accelerating the coverage and capability of our shared service centers, progress on our IT transformation, billing centralization
and improving our reporting data intelligence.
•	 Nine acquisitions were completed, further aligning our portfolio with our focus on megatrends.
A strong financial performance
Total revenue reached CHF 6.4 billion, up by 14.3% (14.2% at constant currency*), driven by the ongoing recovery from the Covid-19
pandemic as well as strategic focus and significant contribution from acquired revenue. Organic revenue* increased by 8.9%.
Operating income increased from CHF 795 million in prior year to CHF 977 million in 2021 due to the revenue increase and related
productivity improvement. No goodwill impairment was recognized in 2021. In 2020, the high restructuring costs were partly offset by
a gain on business disposal.
Adjusted operating income* increased from CHF 900 million in prior year to CHF 1 055 million in 2021, an increase of 17.2%
(16.8% at constant currency*).
Adjusted operating income margin* increased from 16.1% in prior year (also 16.1% at constant currency*) to 16.5% in 2021, supported
by additional productivity increase.
Net financial expenses slightly decreased from CHF 54 million in prior year to CHF 53 million in 2021.
Effective tax rate (ETR) decreased from 32% in prior year to 29%. The prior year was mainly impacted by non-deductibility of both goodwill
impairment and a portion of restructuring costs.
Profit attributable to equity holders increased from CHF 480 million in prior year to CHF 613 million in 2021, an increase of 27.7% over
prior year.
Basic earnings per share increased from CHF 64.05 in prior year to CHF 81.91, an improvement of 27.9%.
Cash flow from operating activities was CHF 1 169 million, comparable with prior year. Higher profit was offset by a higher net working
capital requirement to support the recovery of activity in 2021. Operating net working capital* remained negative as a percentage of revenue
at (2.4)% compared to (2.5)% in prior year.
*	 Alternative Performance Measures (APM), refer to the ‘2021 Full Year APM’ document.
2021 Full Year
Results
2
SGS | 2021 Full Year Results
Free cash flow (FCF)* decreased from CHF 758 million in prior year to CHF 635 million in 2021. The lower level of FCF was mainly driven
by higher capex investment.
Investment activities: Net capex was CHF 331 million versus CHF 246 million in prior year and the Group completed nine acquisitions
for a total cash consideration of CHF 214 million.
Financing activities: In 2021, the Group paid a dividend of CHF 599 million.
Return on invested capital (ROIC)* increased from 16.5% in prior year to 19.6% in 2021. Prior year was impacted by SGS Analytics
(formerly SYNLAB AS), which was acquired as at 31 December 2020. Adjusted for this acquisition, 2020 ROIC would have been 20.9%.
As at 31 December 2021, the Group net debt* was CHF 1 691 million versus CHF 1 478 million in prior year.
Business growth and adjusted operating income margin 2021
(CHF million) Revenue Growth at CCY1
Organic* growth
at CCY1
Adjusted operating
income*
Adjusted operating
income Margin*
CP 1 288 8.8% 7.7% 316 24.5%
HN 861 30.1% 15.9% 149 17.3%
IE 2 120 18.0% 7.5% 240 11.3%
NR 1 473 6.2% 6.0% 210 14.3%
Kn 663 14.7% 14.7% 140 21.1%
Total 6 405 14.2% 8.9% 1 055 16.5%
1.	
Constant currency (CCY)*.
Acquisitions
Date Location Division line FTE
Analytical  Development Services (ADS) 7 January 2021 United Kingdom HN 86
BZH GmbH Deutsches Beratungszentrum für Hygiene 29 January 2021 Germany IE 71
Autoscope/CTOK 2 February 2021 France IE 10
International Service Laboratory (ISL) 1 April 2021 Ireland HN 86
Brightsight 4 May 2021 The Netherlands CP 145
Metair Lab 1 June 2021 France IE 19
Groupe IDEA TESTS 1 December 2021 France HN 73
Sulphur Experts Inc. 1 December 2021 Canada NR 40
Quay Pharmaceuticals Limited 6 December 2021 United Kingdom HN 192
Mid-term targets 2020-2023
Planet Performance People
Reducing our CO2 emissions
Support the transition to a low-carbon
world by meeting our Science-based Target
of reducing our CO2 emissions per revenue
by 35%¹
High single-digit constant currency
revenue Compound Annual Growth
Rate (CAGR)
Driven by mid-single-digit organic*
growth per annum and a focus on MA
Ensuring diversity
Nurture diversity and inclusion based on
merit by ensuring equal opportunity to
all employees and evolving our gender
diversity to 30% women in leadership
at CEO-3 positions and above
Sustainability solutions
Support our customers on their journey to
sustainability by increasing the proportion
of revenue generated by our sustainability
solutions to above 50%
 10% adjusted operating
income* CAGR
World Class Service (WCS)
Promote a culture of operational safety,
efficiency and excellence through our WCS
program: 20% of our WCS labs (2020
perimeter) reaching WCS Bronze award level
Integrity principles
Reduce the impact that our supply chain
has on society by committing our strategic
suppliers to support our integrity principles
Strong Economic Value Added
discipline (EVA)
Supporting personal development
Support the personal development of our
employees by increasing the completion
rate of job-related training by 10%²
Energy efficiency
Increasing annually the number of energy
efficiency measures in our 100 most
energy intensive owned buildings
Maintain or grow the dividend
per share
Positive impact on communities
Increase by 10%² our positive impact
on our communities through employee
volunteering, focusing on vulnerable groups
including those affected by pandemics
1.	 Against a 2014 baseline.
2.	 Against a 2019 baseline.
*	 Alternative Performance Measures (APM), refer to the ‘2021 Full Year APM’ document.
3
2021 Full Year
Results
SGS | 2021 Full Year Results
Outlook 2022
• Mid-single-digit organic growth
• Improving adjusted operating income benefiting from operational leverage
• Strong cash conversion
• Maintain best-in-class organic return on invested capital
• Accelerate investment into our strategic focus areas with MA as a key differentiator
• At least maintain the dividend
Management changes
Jessica Sun joined the SGS Group as Senior Vice President of Human Resources and has been appointed to the Operations Council.
José María Hernández-Sampelayo (formerly Senior Vice President of Human Resources) stepped down from the Operations Council
to take the role of Vice President of Group Strategic Projects.
Steven Du has been appointed Chief Operating Officer of North East Asia replacing Helmut Chik who has decided to leave the SGS Group
to pursue other interests.
We would like to thank Jose Maria and Helmut for their dedication and contributions to the Operations Council and Helmut for his significant
contribution to the SGS Group.
Board changes
On 23 March 2021, Janet S. Vergis was elected as a member of the Board of Directors bringing over 30 years of experience in positions
of responsibility in research  development, new product development and sales  marketing in the healthcare industry. François von Finck,
Gérard Lamarche and Cornelius Grupp did not stand for re-election. SGS would like to thank them for their support and direction.
Distribution shareholders
The SGS Board of Directors will recommend to the Annual General Meeting (to be held on 29 March 2022) the approval of a dividend
of CHF 80 per share.
Significant shareholders
As at 31 December 2021, Groupe Bruxelles Lambert (acting through Serena SARL and URDAC) held 19.11% (December 2020: 18.91%)
of the share capital and voting rights of the company. At the same date, the Group held 0.04% of the share capital of the company
(December 2020: 1.28%).
Calvin Grieder
Chair of the Board of Directors
Frankie Ng
Chief Executive Officer
27 January 2022
2021 Full Year
Results
4
SGS | 2021 Full Year Results
(CHF million) 2021 20202
Change
in % 2020 CCY1
Change in
CCY1
%
Revenue 1 288 1 175 9.6 1 184 8.8
Adjusted operating income* 316 287 10.1 290 9.0
Margin %* 24.5 24.4 24.5
Connectivity  Products revenue increased by 8.8% at constant currency (organic growth was 7.7%) to CHF 1 288 million. Excluding
the impact from lower PPE testing volumes, there was a strong recovery in all Strategic Business Units (SBU).
Connectivity grew materially more than the divisional average with an excellent contribution from all segments which was supported by
easing regional restrictions, our long-term focused investment strategy and further penetration into the Cybersecurity market through the
acquisition of Brightsight.
Softlines growth was below the divisional average. A strong recovery in Bangladesh, Taiwan and Turkey was driven by increased levels
of activity from major retailers and brands. There was also good progress from our sustainable solutions. As expected, PPE testing volumes
were at a lower level compared to last year.
Hardlines increased less than divisional average. Hardgoods recovered strongly in all geographies and improving European and Asian
market conditions resulted in higher automotive laboratory testing volumes. Toys and Juvenile was stable compared to last year.
Trade Facilitation services posted higher growth than the divisional average led by eCustoms services expansion in Europe. This was
partially offset by unfavorable trade conditions affecting certain Product Conformity Assessment programs.
The adjusted operating income margin remained stable at 24.5% versus prior year (at constant currency), with profitability improving
across most of the portfolio due to a strong focus on cost and structural optimization. This was offset by lower volumes of highly profitable
PPE testing.
(CHF million) 2021 20202
Change
in % 2020 CCY1
Change in
CCY1
%
Revenue 861 658 30.9 662 30.1
Adjusted operating income* 149 102 46.1 103 44.7
Margin %* 17.3 15.5 15.6
Health  Nutrition revenue increased by 30.1% at constant currency (organic growth was 15.9%) to CHF 861 million. All SBUs and regions
delivered a strong performance resulting in double-digit organic growth.
Food achieved double-digit organic growth as underlying markets rebounded and were supported by new regulations in Asia and increasing
demand for plant-based and health products in Europe, as well as expansion of our customer base in North America.
Crop Science revenue increased below the divisional average, supported by growth across all segments, particularly in Europe.
Health Science grew well above the divisional average, benefiting from work related to Covid-19 vaccines and strong momentum in
North America.
Cosmetics  Hygiene grew organically by double digits, slightly below the divisional average, led by a rebound of activities in North America
and in North East Asia.	
The adjusted operating income margin increased to 17.3% from 15.6% in prior year (at constant currency). Profitability improved across
the portfolio as the increase in volume drove strong operational leverage.
Connectivity  Products
Health  Nutrition
1.	 Constant currency (CCY) – Definition in APM.
2.	 See Note 2 on segment information restatement.
*	 Alternative Performance Measures (APM), refer to the ‘2021 Full Year APM’ document.
Acquisitions
•	 Brightsight in The Netherlands
Acquisitions
•	 Analytical  Development Services
(ADS) in the UK
•	 International Service Laboratory (ISL)
in Ireland
•	 Groupe IDEA TESTS in France
•	 Quay Pharmaceuticals Limited in the UK
5
2021 Full Year
Results
SGS | 2021 Full Year Results
(CHF million) 2021 20202
Change
in % 2020 CCY1
Change in
CCY1
%
Revenue 2 120 1 798 17.9 1 796 18.0
Adjusted operating income* 240 178 34.8 181 32.6
Margin %* 11.3 9.9 10.1
Industries  Environment revenue increased by 18.0% at constant currency (organic growth was 7.5%) to CHF 2 120 million. All SBUs
grew in 2021.
Field Services and Inspection grew above divisional average as a result of a strong increase in demand for inspection and monitoring
activities, particularly in Europe and Asia. Double-digit growth was achieved across the network driven by renewable energy projects in
field services.
Technical Assessment and Advisory grew above the divisional average with double-digit organic growth benefiting from a rebound
in Latin America. Total growth was supplemented by a strong performance from Ryobi Geotechnique International Pte Ltd. acquired in
late 2020.
Industrial and Public Health  Safety grew above the divisional average, at a double-digit rate. This was driven by a strong performance
in the industrial laboratory network in North East Asia and strong volumes in Health  Safety services in North America.
Environmental Testing remained organically stable. A strong pick-up in activity in Latin America was partly offset by a slower recovery
in the USA and some European countries. The SYNLAB Analytics  Services acquisition had a solid performance and has materially
increased our European footprint, accelerating our hub and spoke laboratory model.
Public Mandates revenue decreased slightly due to a lost contract in Africa which was partly compensated by strong recovery in vehicle
compliance in Europe and Latin America.
The adjusted operating income margin increased to 11.3% from 10.1% in prior year (at constant currency) through a combination
of higher volumes and cost optimization.
(CHF million) 2021 20202
Change
in % 2020 CCY1
Change in
CCY1
%
Revenue 1 473 1 397 5.4 1 387 6.2
Adjusted operating income* 210 225 (6.7) 220 (4.5)
Margin %* 14.3 16.1 15.9
Natural Resources revenue increased by 6.2% at constant currency (organic growth was 6.0%) to CHF 1 473 million, fueled by the buoyant
minerals market with high commodity prices and increased exploration funding.
Trade and Inspection posted moderate growth, less than the divisional average, with the strong demand across minerals commodities
offsetting weaker performance in agricultural commodities. Strong trade volumes in Latin America and Asia in agriculture were insufficient
to offset adverse meteorological conditions and the resulting poor crop season in Europe and North America. Oil and Gas Commodities
achieved stable growth despite the challenging trading environment.
Laboratory Testing delivered double-digit growth with a surge in exploration sample volumes across the network. Geochemistry onsite
laboratories continued their positive trajectory and strongly maintained their global leadership position, with new laboratory additions
in Eastern Europe and Africa. Oil and gas analytical services benefited from strong laboratory outsourcing activities and grew above
divisional levels.
Metallurgy and Consulting achieved double-digit growth with the resumption of metallurgical pilot projects delayed from the previous year.
Service innovation continued with the launch of integrated services in geomet and process solutions as well as new services related
to critical metals and battery metals.
Market Intelligence growth was above divisional levels with the replication of digital services across the Natural Resources supply chain.
The adjusted operating income margin decreased to 14.3% from 15.9% in prior year (at constant currency), resulting from the challenges
in agricultural commodities and competitive pricing in oil and gas. This was partially offset by improved profitability in the mining sector in
addition to ongoing operational optimization across the network.
Industries  Environment
Natural Resources
1.	 Constant currency (CCY) – Definition in APM.
2.	 See Note 2 on segment information restatement.
*	 Alternative Performance Measures (APM), refer to the ‘2021 Full Year APM’ document.
Acquisitions
•	 Autoscope/CTOK in France
•	 BZH GmbH Deutsches
Beratungszentrum für Hygiene
in Germany
•	 Metair Lab in France
Acquisitions
•	 Sulphur Experts Inc. in Canada
2021 Full Year
Results
6
SGS | 2021 Full Year Results
(CHF million) 2021 20202
Change
in % 2020 CCY1
Change in
CCY1
%
Revenue 663 576 15.1 578 14.7
Adjusted operating income* 140 108 29.6 109 28.4
Margin %* 21.1 18.8 18.9
Knowledge revenue increased organically by 14.7% to CHF 663 million. All SBUs and regions grew by double digits resulting in a
solid increase.
Management System Certification grew by double digits driven by the combination of a higher volume of recertification audits as well
as a strong performance in information security, medical devices and certification. Growth was lower in H2 due to a challenging comparable
with the post Covid-19 catch-up period in H2 2020, however growth versus H2 2019 was double digit.
Customized Audits increased above the divisional average, fueled by a high volume of social audits in Asia and Europe as well as strong
demand for newly launched Environmental, Social and Governance (ESG) services.
Consulting grew above the divisional average. SGS Productivity (LeanSis) delivered solid results boosted by the international replication
of services. Maine Pointe also rebounded, particularly in H2, driven by the strong demand for supply chain improvement solutions.
Academy improved in H2 as students gradually returned to classrooms and virtual training solutions continued to gain traction.
However, market demand remains below pre-pandemic levels.
The adjusted operating income margin increased to 21.1% from 18.9% in prior year (at constant currency). Profitability improved
across all geographies benefiting from the strong volume increase, improved auditors utilization and a leaner cost base.
Knowledge
1.	 Constant currency (CCY) – Definition in APM.
2.	 See Note 2 on segment information restatement.
*	 Alternative Performance Measures (APM), refer to the ‘2021 Full Year APM’ document.
7
2021 Full Year
Results
SGS | 2021 Full Year Results
8 2021 Full Year
Results
SGS | 2021 Full Year Results
Condensed Consolidated Financial Statements
Condensed Consolidated Income Statement
For the period ended 31 December 2021
(CHF million) Notes 2021 2020
Revenue 4 6 405 5 604
Salaries and wages (3 180) (2 797)
Subcontractors’ expenses (385) (352)
Depreciation, amortization and impairment (499) (517)
Gain on business disposals – 63
Other operating expenses (1 364) (1 206)
Operating income (EBIT) 4 977 795
Financial income 16 12
Financial expenses (69) (66)
Share of profit of associates and joint ventures – 1
Profit before taxes 924 742
Taxes (269) (237)
Profit for the period 655 505
Profit attributable to:
Equity holders of SGS SA 613 480
Non-controlling interests 42 25
Basic earnings per share (in CHF) 5 81.91 64.05
Diluted earnings per share (in CHF) 5 81.79 63.82
Condensed Consolidated Statement of Comprehensive Income
For the period ended 31 December 2021
(CHF million) 2021 2020
Actuarial gains on defined benefit plans 57 14
Income tax on actuarial (losses) (6) (4)
Items that will not be subsequently reclassified to income statement 51 10
Exchange differences (32) (182)
Items that may be subsequently reclassified to income statement (32) (182)
Other comprehensive income/(loss) for the period 19 (172)
Profit for the period 655 505
Total comprehensive income for the period 674 333
Attributable to:
Equity holders of SGS SA 629 311
Non-controlling interests 45 22
9
2021 Full Year
Results
SGS | 2021 Full Year Results
Condensed Consolidated Balance Sheet
For the period ended 31 December 2021
(CHF million) 2021 2020
Assets
Non-current assets
Property, plant and equipment 925 872
Right-of-use assets 605 590
Goodwill 1 778 1 651
Other intangible assets 382 333
Investments in joint ventures, associates and other companies 26 34
Deferred tax assets 164 161
Other non-current assets 173 154
Total non-current assets 4 053 3 795
Current assets
Inventories 59 57
Unbilled revenues and work in progress 175 160
Trade receivables 928 856
Other receivables and prepayments 204 188
Current tax assets 108 77
Marketable securities – 9
Cash and cash equivalents 1 480 1 766
Total current assets 2 954 3 113
Total assets 7 007 6 908
Equity and liabilities
Capital and reserves
Share capital 7 8
Reserves 1 118 1 282
Treasury shares (8) (230)
Equity attributable to equity holders of SGS SA 1 117 1 060
Non-controlling interests 85 74
Total equity 1 202 1 134
Non-current liabilities
Loans and other financial liabilities 2 889 2 390
Lease liabilities 481 470
Deferred tax liabilities 92 53
Defined benefit obligations 84 136
Provisions 90 88
Total non-current liabilities 3 636 3 137
Current liabilities
Trade and other payables 687 658
Contract liabilities 221 189
Current tax liabilities 169 140
Loans and other financial liabilities 282 863
Lease liabilities 155 151
Provisions 60 85
Other creditors and accruals 595 551
Total current liabilities 2 169 2 637
Total liabilities 5 805 5 774
Total equity and liabilities 7 007 6 908
2021 Full Year
Results
10
SGS | 2021 Full Year Results
Condensed Consolidated Statement of Changes in Equity
For the period ended 31 December 2021
Attributable to:
(CHF million)
Share
capital
Treasury
shares
Capital
reserve
Cumulative
translation
adjustments
Cumulative
(losses)/gains
on defined
benefit plans
net of tax
Retained
earnings
and
Group
reserves
Equity
Holders
of SGS SA
Non-
controlling
Interests
Total
Equity
Balance at 1 January 2020 8 (30) 146 (1 128) (251) 2 769 1 514 81 1 595
Profit for the period – – – – – 480 480 25 505
Other comprehensive income
for the period
– – – (179) 10 – (169) (3) (172)
Total comprehensive income for
the period
– – – (179) 10 480 311 22 333
Dividends paid – – – – – (598) (598) (37) (635)
Share-based payments – – 17 – – – 17 – 17
Movement in
non-controlling interests
– – – – – 20 20 8 28
Movement on treasury shares – (200) (3) – – (1) (204) – (204)
Balance at 31 December 2020 8 (230) 160 (1 307) (241) 2 670 1 060 74 1 134
Balance at 1 January 2021 8 (230) 160 (1 307) (241) 2 670 1 060 74 1 134
Profit for the period – – – – – 613 613 42 655
Other comprehensive income
for the period
– – – (35) 51 – 16 3 19
Total comprehensive income for
the period
– – – (35) 51 613 629 45 674
Dividends paid – – – – – (599) (599) (41) (640)
Share-based payments – – 12 – – – 12 – 12
Movement in non-controlling
interests
– – – – – 14 14 7 21
Movement on treasury shares (1) 222 (42) – – (178) 1 – 1
Balance at 31 December 2021 7 (8) 130 (1 342) (190) 2 520 1 117 85 1 202
11
2021 Full Year
Results
SGS | 2021 Full Year Results
Condensed Consolidated Cash Flow Statement
For the period ended 31 December 2021
(CHF million) 2021 2020
Profit for the period 655 505
Non-cash and non-operating items 828 748
(Increase)/decrease in working capital (44) 186
Taxes paid (270) (253)
Cash flow from operating activities 1 169 1 186
Purchase of property, plant and equipment and other intangible assets (336) (259)
Disposal of property, plant and equipment and other intangible assets 5 13
Acquisition of businesses (214) (492)
Proceeds from disposal of businesses – 71
Cash paid on other non-current assets (2) (4)
Proceeds received from investments in joint ventures, associates and other companies 1 1
Interest received 17 15
Proceeds from marketable securities 9 –
Cash flow used by investing activities (520) (655)
Dividends paid to equity holders of SGS SA (599) (598)
Dividends paid to non-controlling interests (41) (37)
Transaction with non-controlling interests (12) (1)
Cash paid on treasury shares – (208)
Proceeds from corporate bonds 824 499
Payment of corporate bonds (276) –
Interest paid (66) (63)
Payment of lease liabilities (179) (161)
Proceeds from borrowings – 542
Payment of borrowings (555) (154)
Cash flow used by financing activities (904) (181)
Currency translation (31) (50)
(Decrease)/increase in cash and cash equivalents (286) 300
Cash and cash equivalents at beginning of year 1 766 1 466
(Decrease)/increase in cash and cash equivalents (286) 300
Cash and cash equivalents at end of the period 1 480 1 766
2021 Full Year
Results
12
SGS | 2021 Full Year Results
1. Activities of the Group
SGS SA and its subsidiaries (the “Group”) operate around the world under the name SGS. The head office of the Group is located in Geneva,
Switzerland. SGS is the global leader in testing, inspection and certification (TIC) services supporting international trade in agriculture, minerals,
petroleum and consumer products. It also provides these services to governments, international institutions and customers engaged in the
industrial, environmental and life sciences sectors.
2. Basis of preparation, significant transaction and segment information restatement
Basis of preparation
These condensed consolidated financial statements have been prepared in accordance with the measurement and recognition criteria
of International Financial Reporting Standards (IFRS).
Covid-19 pandemic
Although economic indicators have risen, the duration and extent of the pandemic together with the related financial, social and public health
impacts of Covid-19 remain uncertain.
Consequently, these condensed consolidated financial statements were prepared considering the continued impact of the pandemic, with
particular attention to (i) the impairment of non-current assets, (ii) the appropriateness of the allowance for trade receivables, unbilled revenue
and work in progress, (iii) the level of provision for risks, as well as (iv) accounting for government grants. No material impacts were recognized
in these condensed consolidated financial statements.
Business segment financial restatement
As indicated early this year, SGS’s operational structure has been simplified into new focus areas composed of five divisions: Connectivity
 Products, Health  Nutrition, Industries  Environment, Natural Resources and Knowledge.
The implementation of this divisional structure, effective as of 1 January 2021, resulted in improving SGS’s market approach and increasing
cooperation and agility across our global network. Other than creating more operational synergies, the Group expects to reinvigorate the
growth profiles of these services. The previously reported 2020 segment disclosures have been restated to reflect this change and are
disclosed in note 4.
3. Changes to the Group’s accounting policies
The accounting policies used in the preparation and presentation of the Group’s condensed financial statements are consistent with those
used in the Group’s consolidated financial statements.
Several new amendments and interpretations were adopted effective 1 January 2021 but have no material impact on the Group’s consolidated
financial statements.
4. Analysis of operating income
(CHF million) 2021 2020
Adjusted operating income* 1 055 900
Amortization and impairment of acquired intangibles (39) (31)
Restructuring costs (15) (84)
Goodwill impairment – (37)
Gain on business disposals – 63
Transaction and integration costs (24) (16)
Operating income 977 795
2021
(CHF million) Revenue
Adjusted
operating
income*
Amortization
of acquisition
intangibles
Restructuring
costs
Transaction
and integration
costs
Operating
income
by business
CP 1 288 316 (5) (2) (1) 308
HN 861 149 (7) (2) (9) 131
IE 2 120 240 (21) (5) (11) 203
NR 1 473 210 – (6) (1) 203
Kn 663 140 (6) – (2) 132
Total 6 405 1 055 (39) (15) (24) 977
Notes to the Condensed Consolidated Financial Statements
*	 Alternative Performance Measures (APM), refer to the ‘2021 Full Year APM’ document.
13
2021 Full Year
Results
SGS | 2021 Full Year Results
*	 Alternative Performance Measures (APM), refer to the ‘2021 Full Year APM’ document.
2020
(CHF million) Revenue
Adjusted
operating
income*
Amortization
of acquisition
intangibles
Restructuring
costs
Goodwill
impairment
Gain on
business
disposals
Transaction
and integration
costs
Operating
income
by business
CP 1 175 287 (1) (2) (5) – (1) 278
HN 658 102 (5) (6) (16) – (4) 71
IE 1 798 178 (14) (65) (8) – (11) 80
NR 1 397 225 (1) (8) – 63 – 279
Kn 576 108 (10) (3) (8) – – 87
Total 5 604 900 (31) (84) (37) 63 (16) 795
2020 Published
(CHF million) Revenue
Adjusted
operating
income*
Amortization
of acquisition
intangibles
Restructuring
costs
Goodwill
impairment
Gain on
business
disposals
Transaction
and integration
costs
Operating
income
by business
AFL 996 175 (4) (5) (16) 63 (4) 209
MIN 639 111 (1) (7) – – – 103
OGC 776 76 – (5) – – (2) 69
CRS 1 054 264 (2) (3) – – (1) 258
CBE 429 82 (10) (3) (8) – – 61
IND 847 72 (7) (13) (10) – (2) 40
EHS 471 42 (4) (3) – – (6) 29
GIS 392 78 (3) (45) (3) – (1) 26
Total 5 604 900 (31) (84) (37) 63 (16) 795
All segment revenues reported above are from external customers. The adjusted operating income* represents the profit earned by each
segment. This is the main measure reported to the chief operating decision makers for the purposes of resource allocation and assessment
of segmental performance.
Restructuring costs
The Group incurred a pre-tax restructuring charge of CHF 15 million (2020: CHF 84 million, out of which CHF 45 million was recognized for
IE activities (former attributed to GIS activities), mainly driven by the termination of the single-window contract with the Government of
Ghana and the vehicle inspection contract with the Government of Uganda).
2021 Full Year
Results
14
SGS | 2021 Full Year Results
5. Earnings per share
2021 2020
Profit attributable to equity holders of SGS SA (CHF million) 613 480
Weighted average number of shares (‘000) 7 488 7 489
Basic earnings per share (CHF) 81.91 64.05
2021 2020
Profit attributable to equity holders of SGS SA (CHF million) 613 480
Diluted weighted average number of shares (‘000) 7 500 7 516
Diluted earnings per share (CHF) 81.79 63.82
6. Exchange rates
The most significant currencies for the Group were translated at the following exchange rates into Swiss Francs.
Statement of financial position
period-end rates
Income statement
period average rates
2021 2020 2021 2020
Australia AUD 100 66.59 67.66 68.67 64.75
Canada CAD 100 71.65 69.12 72.93 70.05
Chile CLP 100 0.11 0.12 0.12 0.12
China CNY 100 14.40 13.54 14.17 13.60
Eurozone EUR 100 103.78 108.42 108.16 107.04
Korea KRW 100 0.08 0.08 0.08 0.08
United Kingdom GBP 100 123.57 119.75 125.72 120.47
Russia RUB 100 1.24 1.19 1.24 1.31
Taiwan TWD 100 3.32 3.15 3.27 3.19
USA USD 100 91.72 88.45 91.42 93.92
15
2021 Full Year
Results
SGS | 2021 Full Year Results
Shareholder Information
SGS SA corporate office
1 place des Alpes
P.O. Box 2152
CH – 1211 Geneva 1
t	 +41 (0)22 739 91 11
f	 +41 (0)22 739 98 86
e	sgs.investor.relations@sgs.com
www.sgs.com
Stock exchange listing
SIX Swiss Exchange, SGSN
Stock exchange trading
SIX Swiss Exchange
Common stock symbols
Bloomberg: Registered Share: SGSN.SW
Reuters: Registered Share: SGSN.S
Telekurs: Registered Share: SGSN
ISIN: Registered Share: CH0002497458
Swiss security number: 249745
Investor Relations
Toby Reeks
SGS SA
1 place des Alpes
P.O. Box 2152
CH – 1211 Geneva 1
t	 +41 (0)22 739 99 87
m	 +41 (0)79 641 83 02
	 +44 7899 800 575
www.sgs.com
Investor days
November 2022
2022 Half Year results
Tuesday, 19 July 2022
Annual General Meeting
of Shareholders
Tuesday, 29 March 2022
Geneva, Switzerland
Media relations
Magali Dauwalder
SGS SA
1 place des Alpes
P.O. Box 2152
CH – 1211 Geneva 1
t	 +41 (0)22 739 95 51
m	 +41 (0)79 329 46 70
www.sgs.com
2021 Full Year
Results
16
SGS | 2021 Full Year Results
Disclaimer
This material is provided for information
purposes only and is not intended to
confer any legal rights to you.
This document does not constitute
an invitation to invest in SGS shares.
Any decisions you make in reliance on this
information are solely your responsibility.
This document is given as of the dates
specified, is not updated and any forward-
looking statements are made subject to the
following reservations:
This document contains certain forward-
looking statements that are neither historical
facts nor guarantees of future performance.
Because these statements involve risks
and uncertainties that are beyond control
or estimation of SGS, there are important
factors that could cause actual results
to differ materially from those expressed
or implied by these forward-looking
statements. These statements speak
only as of the date of this document.
Except as required by any applicable law
or regulation, SGS expressly disclaims any
obligation to release publicly any updates or
revisions to any forward-looking statements
contained herein to reflect any change in
SGS Group’s expectations with regard
thereto or any change in events or conditions
on which any such statements are based.
SGS is a registered trademark of
SGS Société Générale de Surveillance SA

More Related Content

What's hot

Ocean Carriers Presentation
Ocean Carriers PresentationOcean Carriers Presentation
Ocean Carriers PresentationJonathan Houston
 
WorkingCapitalSimulation_RachelKrebs
WorkingCapitalSimulation_RachelKrebsWorkingCapitalSimulation_RachelKrebs
WorkingCapitalSimulation_RachelKrebsRachel Krebs
 
Unilever annual report 2014
Unilever annual report 2014Unilever annual report 2014
Unilever annual report 2014Michael Olafusi
 
Brazil Digital Report - 1st Edition By McKinsey & Company and Brazil at Silic...
Brazil Digital Report - 1st Edition By McKinsey & Company and Brazil at Silic...Brazil Digital Report - 1st Edition By McKinsey & Company and Brazil at Silic...
Brazil Digital Report - 1st Edition By McKinsey & Company and Brazil at Silic...Ana Lucia Amaral
 
Analiza datelor.docx
Analiza datelor.docxAnaliza datelor.docx
Analiza datelor.docxdjspeed1
 
Deutsche Bank Survey Sees Blockchain Adoption in Six Years
Deutsche Bank Survey Sees Blockchain Adoption in Six YearsDeutsche Bank Survey Sees Blockchain Adoption in Six Years
Deutsche Bank Survey Sees Blockchain Adoption in Six YearsNicola Barozzi 🚘✔
 
UBS Mergers and Acquisitions Presentation Deck Mar 2023.pdf
UBS Mergers and Acquisitions Presentation Deck Mar 2023.pdfUBS Mergers and Acquisitions Presentation Deck Mar 2023.pdf
UBS Mergers and Acquisitions Presentation Deck Mar 2023.pdfBryann Alexandros
 
Asia Investment & Banking Conference 2018 – HSBC M&A Competition Champions (A...
Asia Investment & Banking Conference 2018 – HSBC M&A Competition Champions (A...Asia Investment & Banking Conference 2018 – HSBC M&A Competition Champions (A...
Asia Investment & Banking Conference 2018 – HSBC M&A Competition Champions (A...Amir Hisham
 
15th Annual William Blair Investment Banking Case Competition
15th Annual William Blair Investment Banking Case Competition15th Annual William Blair Investment Banking Case Competition
15th Annual William Blair Investment Banking Case CompetitionOscar Arenas
 
新趨勢_智慧家庭
新趨勢_智慧家庭新趨勢_智慧家庭
新趨勢_智慧家庭Collaborator
 
June 05 Unit 3 Mark Scheme
June 05 Unit 3 Mark SchemeJune 05 Unit 3 Mark Scheme
June 05 Unit 3 Mark Schememattbentley34
 
Procter & Gamble Supply Chain Finance Case
Procter & Gamble Supply Chain Finance CaseProcter & Gamble Supply Chain Finance Case
Procter & Gamble Supply Chain Finance CaseYASSER ELSEDAWY
 
Financial Ratio analysis Of Gul Ahmed Textile Ltd.
Financial Ratio analysis Of Gul Ahmed Textile Ltd.Financial Ratio analysis Of Gul Ahmed Textile Ltd.
Financial Ratio analysis Of Gul Ahmed Textile Ltd.PakeezaTehmuri
 
Liquidity for advanced manufacturing and automotive sectors in the face of Co...
Liquidity for advanced manufacturing and automotive sectors in the face of Co...Liquidity for advanced manufacturing and automotive sectors in the face of Co...
Liquidity for advanced manufacturing and automotive sectors in the face of Co...EY
 
The 360 supply chain: Bain & Company examines changes needed to make supply c...
The 360 supply chain: Bain & Company examines changes needed to make supply c...The 360 supply chain: Bain & Company examines changes needed to make supply c...
The 360 supply chain: Bain & Company examines changes needed to make supply c...National Retail Federation
 
Diageo - Competitive Advantages
Diageo - Competitive Advantages Diageo - Competitive Advantages
Diageo - Competitive Advantages nevenaz
 
The Diversity Imperative: 14th Annual Australian Chief Executive Study
The Diversity Imperative: 14th Annual Australian Chief Executive StudyThe Diversity Imperative: 14th Annual Australian Chief Executive Study
The Diversity Imperative: 14th Annual Australian Chief Executive StudyPwC's Strategy&
 

What's hot (20)

Ocean Carriers Presentation
Ocean Carriers PresentationOcean Carriers Presentation
Ocean Carriers Presentation
 
WorkingCapitalSimulation_RachelKrebs
WorkingCapitalSimulation_RachelKrebsWorkingCapitalSimulation_RachelKrebs
WorkingCapitalSimulation_RachelKrebs
 
Unilever annual report 2014
Unilever annual report 2014Unilever annual report 2014
Unilever annual report 2014
 
Brazil Digital Report - 1st Edition By McKinsey & Company and Brazil at Silic...
Brazil Digital Report - 1st Edition By McKinsey & Company and Brazil at Silic...Brazil Digital Report - 1st Edition By McKinsey & Company and Brazil at Silic...
Brazil Digital Report - 1st Edition By McKinsey & Company and Brazil at Silic...
 
Global Value Chains, Industry 4.0, and Korean Industrial Transformation
Global Value Chains, Industry 4.0, and Korean Industrial TransformationGlobal Value Chains, Industry 4.0, and Korean Industrial Transformation
Global Value Chains, Industry 4.0, and Korean Industrial Transformation
 
Analiza datelor.docx
Analiza datelor.docxAnaliza datelor.docx
Analiza datelor.docx
 
Deutsche Bank Survey Sees Blockchain Adoption in Six Years
Deutsche Bank Survey Sees Blockchain Adoption in Six YearsDeutsche Bank Survey Sees Blockchain Adoption in Six Years
Deutsche Bank Survey Sees Blockchain Adoption in Six Years
 
UBS Mergers and Acquisitions Presentation Deck Mar 2023.pdf
UBS Mergers and Acquisitions Presentation Deck Mar 2023.pdfUBS Mergers and Acquisitions Presentation Deck Mar 2023.pdf
UBS Mergers and Acquisitions Presentation Deck Mar 2023.pdf
 
Asia Investment & Banking Conference 2018 – HSBC M&A Competition Champions (A...
Asia Investment & Banking Conference 2018 – HSBC M&A Competition Champions (A...Asia Investment & Banking Conference 2018 – HSBC M&A Competition Champions (A...
Asia Investment & Banking Conference 2018 – HSBC M&A Competition Champions (A...
 
15th Annual William Blair Investment Banking Case Competition
15th Annual William Blair Investment Banking Case Competition15th Annual William Blair Investment Banking Case Competition
15th Annual William Blair Investment Banking Case Competition
 
新趨勢_智慧家庭
新趨勢_智慧家庭新趨勢_智慧家庭
新趨勢_智慧家庭
 
June 05 Unit 3 Mark Scheme
June 05 Unit 3 Mark SchemeJune 05 Unit 3 Mark Scheme
June 05 Unit 3 Mark Scheme
 
Procter & Gamble Supply Chain Finance Case
Procter & Gamble Supply Chain Finance CaseProcter & Gamble Supply Chain Finance Case
Procter & Gamble Supply Chain Finance Case
 
Overview of M&A, 2016
Overview of M&A, 2016Overview of M&A, 2016
Overview of M&A, 2016
 
Financial Ratio analysis Of Gul Ahmed Textile Ltd.
Financial Ratio analysis Of Gul Ahmed Textile Ltd.Financial Ratio analysis Of Gul Ahmed Textile Ltd.
Financial Ratio analysis Of Gul Ahmed Textile Ltd.
 
Liquidity for advanced manufacturing and automotive sectors in the face of Co...
Liquidity for advanced manufacturing and automotive sectors in the face of Co...Liquidity for advanced manufacturing and automotive sectors in the face of Co...
Liquidity for advanced manufacturing and automotive sectors in the face of Co...
 
The 360 supply chain: Bain & Company examines changes needed to make supply c...
The 360 supply chain: Bain & Company examines changes needed to make supply c...The 360 supply chain: Bain & Company examines changes needed to make supply c...
The 360 supply chain: Bain & Company examines changes needed to make supply c...
 
McKinsey: Understanding shifts in consumer behavior
McKinsey: Understanding shifts in consumer behaviorMcKinsey: Understanding shifts in consumer behavior
McKinsey: Understanding shifts in consumer behavior
 
Diageo - Competitive Advantages
Diageo - Competitive Advantages Diageo - Competitive Advantages
Diageo - Competitive Advantages
 
The Diversity Imperative: 14th Annual Australian Chief Executive Study
The Diversity Imperative: 14th Annual Australian Chief Executive StudyThe Diversity Imperative: 14th Annual Australian Chief Executive Study
The Diversity Imperative: 14th Annual Australian Chief Executive Study
 

Similar to SGS 2021 Full Year Results Report

SGS 2020 Full Year Results Report
SGS 2020 Full Year Results ReportSGS 2020 Full Year Results Report
SGS 2020 Full Year Results ReportSGS
 
SGS 2022 Half Year Results Report
SGS 2022 Half Year Results ReportSGS 2022 Half Year Results Report
SGS 2022 Half Year Results ReportSGS
 
SGS 2022 Full Year Results Report
SGS 2022 Full Year Results ReportSGS 2022 Full Year Results Report
SGS 2022 Full Year Results ReportSGS
 
SGS 2020 Half Year Results Report
SGS 2020 Half Year Results ReportSGS 2020 Half Year Results Report
SGS 2020 Half Year Results ReportSGS
 
SGS 2023 Half Year Results Report
SGS 2023 Half Year Results ReportSGS 2023 Half Year Results Report
SGS 2023 Half Year Results ReportSGS
 
SGS 2023 Full Year Results Earnings Release EN.pdf
SGS 2023 Full Year Results Earnings Release EN.pdfSGS 2023 Full Year Results Earnings Release EN.pdf
SGS 2023 Full Year Results Earnings Release EN.pdfSGS
 
Klöckner & Co SE Press Conference Presentation Q2 2016 results
Klöckner & Co SE Press Conference Presentation Q2 2016 resultsKlöckner & Co SE Press Conference Presentation Q2 2016 results
Klöckner & Co SE Press Conference Presentation Q2 2016 resultsKlöckner & Co SE
 
Barry Callebaut Group – Full-Year Results, Fiscal Year 2020/21 - Media & Anal...
Barry Callebaut Group – Full-Year Results, Fiscal Year 2020/21 - Media & Anal...Barry Callebaut Group – Full-Year Results, Fiscal Year 2020/21 - Media & Anal...
Barry Callebaut Group – Full-Year Results, Fiscal Year 2020/21 - Media & Anal...Barry Callebaut
 
Klöckner & Co SE Analysts' and Investors' Presentation Q2 2016
Klöckner & Co SE Analysts' and Investors' Presentation Q2 2016Klöckner & Co SE Analysts' and Investors' Presentation Q2 2016
Klöckner & Co SE Analysts' and Investors' Presentation Q2 2016Klöckner & Co SE
 
Suominen Corporation results Q4 and FY2016
Suominen Corporation results Q4 and FY2016Suominen Corporation results Q4 and FY2016
Suominen Corporation results Q4 and FY2016Suominen Corporation
 
FY-2021-Results-2022-24-Plan.pdf
FY-2021-Results-2022-24-Plan.pdfFY-2021-Results-2022-24-Plan.pdf
FY-2021-Results-2022-24-Plan.pdfGruppo TIM
 
Klöckner & Co SE - Q1 2017 Results - Press Conference
Klöckner & Co SE - Q1 2017 Results - Press ConferenceKlöckner & Co SE - Q1 2017 Results - Press Conference
Klöckner & Co SE - Q1 2017 Results - Press ConferenceKlöckner & Co SE
 
2021 1Q Consolidated results
2021 1Q Consolidated results2021 1Q Consolidated results
2021 1Q Consolidated resultsSnam
 
20220203financial results-presentation
20220203financial results-presentation20220203financial results-presentation
20220203financial results-presentationSIOS Corporation
 
Leonardo 1Q 2017 Results Presentation
Leonardo 1Q 2017 Results PresentationLeonardo 1Q 2017 Results Presentation
Leonardo 1Q 2017 Results PresentationLeonardo
 
Solvay 9 months 2018 results - Presentation
Solvay 9 months 2018 results - PresentationSolvay 9 months 2018 results - Presentation
Solvay 9 months 2018 results - PresentationSolvay Group
 
TIM Group - Q2-2022 Results
TIM Group - Q2-2022 ResultsTIM Group - Q2-2022 Results
TIM Group - Q2-2022 ResultsGruppo TIM
 
SGS 2022 Half Year Results Presentation
SGS 2022 Half Year Results PresentationSGS 2022 Half Year Results Presentation
SGS 2022 Half Year Results PresentationSGS
 
Klöckner & Co SE - Annual Report 2016
Klöckner & Co SE - Annual Report 2016Klöckner & Co SE - Annual Report 2016
Klöckner & Co SE - Annual Report 2016Klöckner & Co SE
 

Similar to SGS 2021 Full Year Results Report (20)

SGS 2020 Full Year Results Report
SGS 2020 Full Year Results ReportSGS 2020 Full Year Results Report
SGS 2020 Full Year Results Report
 
SGS 2022 Half Year Results Report
SGS 2022 Half Year Results ReportSGS 2022 Half Year Results Report
SGS 2022 Half Year Results Report
 
SGS 2022 Full Year Results Report
SGS 2022 Full Year Results ReportSGS 2022 Full Year Results Report
SGS 2022 Full Year Results Report
 
SGS 2020 Half Year Results Report
SGS 2020 Half Year Results ReportSGS 2020 Half Year Results Report
SGS 2020 Half Year Results Report
 
SGS 2023 Half Year Results Report
SGS 2023 Half Year Results ReportSGS 2023 Half Year Results Report
SGS 2023 Half Year Results Report
 
SGS 2023 Full Year Results Earnings Release EN.pdf
SGS 2023 Full Year Results Earnings Release EN.pdfSGS 2023 Full Year Results Earnings Release EN.pdf
SGS 2023 Full Year Results Earnings Release EN.pdf
 
Klöckner & Co SE Press Conference Presentation Q2 2016 results
Klöckner & Co SE Press Conference Presentation Q2 2016 resultsKlöckner & Co SE Press Conference Presentation Q2 2016 results
Klöckner & Co SE Press Conference Presentation Q2 2016 results
 
Barry Callebaut Group – Full-Year Results, Fiscal Year 2020/21 - Media & Anal...
Barry Callebaut Group – Full-Year Results, Fiscal Year 2020/21 - Media & Anal...Barry Callebaut Group – Full-Year Results, Fiscal Year 2020/21 - Media & Anal...
Barry Callebaut Group – Full-Year Results, Fiscal Year 2020/21 - Media & Anal...
 
Klöckner & Co SE Analysts' and Investors' Presentation Q2 2016
Klöckner & Co SE Analysts' and Investors' Presentation Q2 2016Klöckner & Co SE Analysts' and Investors' Presentation Q2 2016
Klöckner & Co SE Analysts' and Investors' Presentation Q2 2016
 
Suominen Corporation results Q4 and FY2016
Suominen Corporation results Q4 and FY2016Suominen Corporation results Q4 and FY2016
Suominen Corporation results Q4 and FY2016
 
FY-2021-Results-2022-24-Plan.pdf
FY-2021-Results-2022-24-Plan.pdfFY-2021-Results-2022-24-Plan.pdf
FY-2021-Results-2022-24-Plan.pdf
 
Klöckner & Co SE - Q1 2017 Results - Press Conference
Klöckner & Co SE - Q1 2017 Results - Press ConferenceKlöckner & Co SE - Q1 2017 Results - Press Conference
Klöckner & Co SE - Q1 2017 Results - Press Conference
 
2021 1Q Consolidated results
2021 1Q Consolidated results2021 1Q Consolidated results
2021 1Q Consolidated results
 
20220203financial results-presentation
20220203financial results-presentation20220203financial results-presentation
20220203financial results-presentation
 
Leonardo 1Q 2017 Results Presentation
Leonardo 1Q 2017 Results PresentationLeonardo 1Q 2017 Results Presentation
Leonardo 1Q 2017 Results Presentation
 
Solvay 9 months 2018 results - Presentation
Solvay 9 months 2018 results - PresentationSolvay 9 months 2018 results - Presentation
Solvay 9 months 2018 results - Presentation
 
fy21-slide-template_final.pdf
fy21-slide-template_final.pdffy21-slide-template_final.pdf
fy21-slide-template_final.pdf
 
TIM Group - Q2-2022 Results
TIM Group - Q2-2022 ResultsTIM Group - Q2-2022 Results
TIM Group - Q2-2022 Results
 
SGS 2022 Half Year Results Presentation
SGS 2022 Half Year Results PresentationSGS 2022 Half Year Results Presentation
SGS 2022 Half Year Results Presentation
 
Klöckner & Co SE - Annual Report 2016
Klöckner & Co SE - Annual Report 2016Klöckner & Co SE - Annual Report 2016
Klöckner & Co SE - Annual Report 2016
 

More from SGS

SGS 2023 Results and Strategic Update.pdf
SGS 2023 Results and Strategic Update.pdfSGS 2023 Results and Strategic Update.pdf
SGS 2023 Results and Strategic Update.pdfSGS
 
SGS 2023 Half Year Results Presentation
SGS 2023 Half Year Results PresentationSGS 2023 Half Year Results Presentation
SGS 2023 Half Year Results PresentationSGS
 
SGS 2022 Full Year Results Presentation
SGS 2022 Full Year Results PresentationSGS 2022 Full Year Results Presentation
SGS 2022 Full Year Results PresentationSGS
 
SGS 2022 Full Year Results Alternative Performance Measures Report
SGS 2022 Full Year Results Alternative Performance Measures ReportSGS 2022 Full Year Results Alternative Performance Measures Report
SGS 2022 Full Year Results Alternative Performance Measures ReportSGS
 
SGS 2022 Half Year Results Alternative Performance Measures Report
SGS 2022 Half Year Results Alternative Performance Measures ReportSGS 2022 Half Year Results Alternative Performance Measures Report
SGS 2022 Half Year Results Alternative Performance Measures ReportSGS
 
SGS 2021 Corporate Sustainability Report
SGS 2021 Corporate Sustainability ReportSGS 2021 Corporate Sustainability Report
SGS 2021 Corporate Sustainability ReportSGS
 
SGS 2021 Integrated Annual Report
SGS 2021 Integrated Annual ReportSGS 2021 Integrated Annual Report
SGS 2021 Integrated Annual ReportSGS
 
SGS 2021 Full Year Results Alternative Performance Measures
SGS 2021 Full Year Results Alternative Performance MeasuresSGS 2021 Full Year Results Alternative Performance Measures
SGS 2021 Full Year Results Alternative Performance MeasuresSGS
 
SGS Intron Bulletin
SGS Intron BulletinSGS Intron Bulletin
SGS Intron BulletinSGS
 
Danone Fruit Supply Chain Mapping via Transparency-One Platform
Danone Fruit Supply Chain Mapping via Transparency-One PlatformDanone Fruit Supply Chain Mapping via Transparency-One Platform
Danone Fruit Supply Chain Mapping via Transparency-One PlatformSGS
 
SGS 2021 Half Year Results Alternative Performance Measures Report
SGS 2021 Half Year Results Alternative Performance Measures ReportSGS 2021 Half Year Results Alternative Performance Measures Report
SGS 2021 Half Year Results Alternative Performance Measures ReportSGS
 
SGS INTRON BULLETIN – NUMMER 33
SGS INTRON BULLETIN – NUMMER 33SGS INTRON BULLETIN – NUMMER 33
SGS INTRON BULLETIN – NUMMER 33SGS
 
SGS 2020 Integrated Annual Report
SGS 2020 Integrated Annual ReportSGS 2020 Integrated Annual Report
SGS 2020 Integrated Annual ReportSGS
 
SGS 2020 Full Year Results Presentation
SGS 2020 Full Year Results PresentationSGS 2020 Full Year Results Presentation
SGS 2020 Full Year Results PresentationSGS
 
SGS INTRON BULLETIN – NUMMER 32
SGS INTRON BULLETIN – NUMMER 32SGS INTRON BULLETIN – NUMMER 32
SGS INTRON BULLETIN – NUMMER 32SGS
 
SGS INTRON BULLETIN - SEPTEMBER 2020
SGS INTRON BULLETIN - SEPTEMBER 2020SGS INTRON BULLETIN - SEPTEMBER 2020
SGS INTRON BULLETIN - SEPTEMBER 2020SGS
 
SGS 2020 Half Year Results Presentation
SGS 2020 Half Year Results PresentationSGS 2020 Half Year Results Presentation
SGS 2020 Half Year Results PresentationSGS
 
SGS INTRON BULLETIN – NUMMER 31
SGS INTRON BULLETIN – NUMMER 31SGS INTRON BULLETIN – NUMMER 31
SGS INTRON BULLETIN – NUMMER 31SGS
 
SGS Expertise for COVID-19 Clinical Trials
SGS Expertise for COVID-19 Clinical TrialsSGS Expertise for COVID-19 Clinical Trials
SGS Expertise for COVID-19 Clinical TrialsSGS
 
SGS 2019 Integrated Annual Report
SGS 2019 Integrated Annual ReportSGS 2019 Integrated Annual Report
SGS 2019 Integrated Annual ReportSGS
 

More from SGS (20)

SGS 2023 Results and Strategic Update.pdf
SGS 2023 Results and Strategic Update.pdfSGS 2023 Results and Strategic Update.pdf
SGS 2023 Results and Strategic Update.pdf
 
SGS 2023 Half Year Results Presentation
SGS 2023 Half Year Results PresentationSGS 2023 Half Year Results Presentation
SGS 2023 Half Year Results Presentation
 
SGS 2022 Full Year Results Presentation
SGS 2022 Full Year Results PresentationSGS 2022 Full Year Results Presentation
SGS 2022 Full Year Results Presentation
 
SGS 2022 Full Year Results Alternative Performance Measures Report
SGS 2022 Full Year Results Alternative Performance Measures ReportSGS 2022 Full Year Results Alternative Performance Measures Report
SGS 2022 Full Year Results Alternative Performance Measures Report
 
SGS 2022 Half Year Results Alternative Performance Measures Report
SGS 2022 Half Year Results Alternative Performance Measures ReportSGS 2022 Half Year Results Alternative Performance Measures Report
SGS 2022 Half Year Results Alternative Performance Measures Report
 
SGS 2021 Corporate Sustainability Report
SGS 2021 Corporate Sustainability ReportSGS 2021 Corporate Sustainability Report
SGS 2021 Corporate Sustainability Report
 
SGS 2021 Integrated Annual Report
SGS 2021 Integrated Annual ReportSGS 2021 Integrated Annual Report
SGS 2021 Integrated Annual Report
 
SGS 2021 Full Year Results Alternative Performance Measures
SGS 2021 Full Year Results Alternative Performance MeasuresSGS 2021 Full Year Results Alternative Performance Measures
SGS 2021 Full Year Results Alternative Performance Measures
 
SGS Intron Bulletin
SGS Intron BulletinSGS Intron Bulletin
SGS Intron Bulletin
 
Danone Fruit Supply Chain Mapping via Transparency-One Platform
Danone Fruit Supply Chain Mapping via Transparency-One PlatformDanone Fruit Supply Chain Mapping via Transparency-One Platform
Danone Fruit Supply Chain Mapping via Transparency-One Platform
 
SGS 2021 Half Year Results Alternative Performance Measures Report
SGS 2021 Half Year Results Alternative Performance Measures ReportSGS 2021 Half Year Results Alternative Performance Measures Report
SGS 2021 Half Year Results Alternative Performance Measures Report
 
SGS INTRON BULLETIN – NUMMER 33
SGS INTRON BULLETIN – NUMMER 33SGS INTRON BULLETIN – NUMMER 33
SGS INTRON BULLETIN – NUMMER 33
 
SGS 2020 Integrated Annual Report
SGS 2020 Integrated Annual ReportSGS 2020 Integrated Annual Report
SGS 2020 Integrated Annual Report
 
SGS 2020 Full Year Results Presentation
SGS 2020 Full Year Results PresentationSGS 2020 Full Year Results Presentation
SGS 2020 Full Year Results Presentation
 
SGS INTRON BULLETIN – NUMMER 32
SGS INTRON BULLETIN – NUMMER 32SGS INTRON BULLETIN – NUMMER 32
SGS INTRON BULLETIN – NUMMER 32
 
SGS INTRON BULLETIN - SEPTEMBER 2020
SGS INTRON BULLETIN - SEPTEMBER 2020SGS INTRON BULLETIN - SEPTEMBER 2020
SGS INTRON BULLETIN - SEPTEMBER 2020
 
SGS 2020 Half Year Results Presentation
SGS 2020 Half Year Results PresentationSGS 2020 Half Year Results Presentation
SGS 2020 Half Year Results Presentation
 
SGS INTRON BULLETIN – NUMMER 31
SGS INTRON BULLETIN – NUMMER 31SGS INTRON BULLETIN – NUMMER 31
SGS INTRON BULLETIN – NUMMER 31
 
SGS Expertise for COVID-19 Clinical Trials
SGS Expertise for COVID-19 Clinical TrialsSGS Expertise for COVID-19 Clinical Trials
SGS Expertise for COVID-19 Clinical Trials
 
SGS 2019 Integrated Annual Report
SGS 2019 Integrated Annual ReportSGS 2019 Integrated Annual Report
SGS 2019 Integrated Annual Report
 

Recently uploaded

Leveraging USDA Rural Development Grants for Community Growth and Sustainabil...
Leveraging USDA Rural Development Grants for Community Growth and Sustainabil...Leveraging USDA Rural Development Grants for Community Growth and Sustainabil...
Leveraging USDA Rural Development Grants for Community Growth and Sustainabil...USDAReapgrants.com
 
Corporate Presentation Probe April 2024.pdf
Corporate Presentation Probe April 2024.pdfCorporate Presentation Probe April 2024.pdf
Corporate Presentation Probe April 2024.pdfProbe Gold
 
Collective Mining | Corporate Presentation - April 2024
Collective Mining | Corporate Presentation - April 2024Collective Mining | Corporate Presentation - April 2024
Collective Mining | Corporate Presentation - April 2024CollectiveMining1
 
WheelTug PLC Pitch Deck | Investor Insights | April 2024
WheelTug PLC Pitch Deck | Investor Insights | April 2024WheelTug PLC Pitch Deck | Investor Insights | April 2024
WheelTug PLC Pitch Deck | Investor Insights | April 2024Hector Del Castillo, CPM, CPMM
 
Best investment platform in india - falcon invoice discounting
Best investment platform in india - falcon invoice discountingBest investment platform in india - falcon invoice discounting
Best investment platform in india - falcon invoice discountingFalcon Invoice Discounting
 
9654467111 Call Girls In Katwaria Sarai Short 1500 Night 6000
9654467111 Call Girls In Katwaria Sarai Short 1500 Night 60009654467111 Call Girls In Katwaria Sarai Short 1500 Night 6000
9654467111 Call Girls In Katwaria Sarai Short 1500 Night 6000Sapana Sha
 
9654467111 Low Rate Call Girls In Tughlakabad, Delhi NCR
9654467111 Low Rate Call Girls In Tughlakabad, Delhi NCR9654467111 Low Rate Call Girls In Tughlakabad, Delhi NCR
9654467111 Low Rate Call Girls In Tughlakabad, Delhi NCRSapana Sha
 
Corporate Presentation Probe April 2024.pdf
Corporate Presentation Probe April 2024.pdfCorporate Presentation Probe April 2024.pdf
Corporate Presentation Probe April 2024.pdfProbe Gold
 
the 25 most beautiful words for a loving and lasting relationship.pdf
the 25 most beautiful words for a loving and lasting relationship.pdfthe 25 most beautiful words for a loving and lasting relationship.pdf
the 25 most beautiful words for a loving and lasting relationship.pdfFrancenel Paul
 
Q1 Quarterly Update - April 16, 2024.pdf
Q1 Quarterly Update - April 16, 2024.pdfQ1 Quarterly Update - April 16, 2024.pdf
Q1 Quarterly Update - April 16, 2024.pdfProbe Gold
 
slideshare_2404_presentation materials_en.pdf
slideshare_2404_presentation materials_en.pdfslideshare_2404_presentation materials_en.pdf
slideshare_2404_presentation materials_en.pdfsansanir
 

Recently uploaded (15)

Call Girls in South Ex⎝⎝9953056974⎝⎝ Escort Delhi NCR
Call Girls in South Ex⎝⎝9953056974⎝⎝ Escort Delhi NCRCall Girls in South Ex⎝⎝9953056974⎝⎝ Escort Delhi NCR
Call Girls in South Ex⎝⎝9953056974⎝⎝ Escort Delhi NCR
 
Leveraging USDA Rural Development Grants for Community Growth and Sustainabil...
Leveraging USDA Rural Development Grants for Community Growth and Sustainabil...Leveraging USDA Rural Development Grants for Community Growth and Sustainabil...
Leveraging USDA Rural Development Grants for Community Growth and Sustainabil...
 
Corporate Presentation Probe April 2024.pdf
Corporate Presentation Probe April 2024.pdfCorporate Presentation Probe April 2024.pdf
Corporate Presentation Probe April 2024.pdf
 
young Call girls in Dwarka sector 1🔝 9953056974 🔝 Delhi escort Service
young Call girls in Dwarka sector 1🔝 9953056974 🔝 Delhi escort Serviceyoung Call girls in Dwarka sector 1🔝 9953056974 🔝 Delhi escort Service
young Call girls in Dwarka sector 1🔝 9953056974 🔝 Delhi escort Service
 
Collective Mining | Corporate Presentation - April 2024
Collective Mining | Corporate Presentation - April 2024Collective Mining | Corporate Presentation - April 2024
Collective Mining | Corporate Presentation - April 2024
 
WheelTug PLC Pitch Deck | Investor Insights | April 2024
WheelTug PLC Pitch Deck | Investor Insights | April 2024WheelTug PLC Pitch Deck | Investor Insights | April 2024
WheelTug PLC Pitch Deck | Investor Insights | April 2024
 
Best investment platform in india - falcon invoice discounting
Best investment platform in india - falcon invoice discountingBest investment platform in india - falcon invoice discounting
Best investment platform in india - falcon invoice discounting
 
young call girls in Hauz Khas,🔝 9953056974 🔝 escort Service
young call girls in Hauz Khas,🔝 9953056974 🔝 escort Serviceyoung call girls in Hauz Khas,🔝 9953056974 🔝 escort Service
young call girls in Hauz Khas,🔝 9953056974 🔝 escort Service
 
9654467111 Call Girls In Katwaria Sarai Short 1500 Night 6000
9654467111 Call Girls In Katwaria Sarai Short 1500 Night 60009654467111 Call Girls In Katwaria Sarai Short 1500 Night 6000
9654467111 Call Girls In Katwaria Sarai Short 1500 Night 6000
 
9654467111 Low Rate Call Girls In Tughlakabad, Delhi NCR
9654467111 Low Rate Call Girls In Tughlakabad, Delhi NCR9654467111 Low Rate Call Girls In Tughlakabad, Delhi NCR
9654467111 Low Rate Call Girls In Tughlakabad, Delhi NCR
 
Corporate Presentation Probe April 2024.pdf
Corporate Presentation Probe April 2024.pdfCorporate Presentation Probe April 2024.pdf
Corporate Presentation Probe April 2024.pdf
 
the 25 most beautiful words for a loving and lasting relationship.pdf
the 25 most beautiful words for a loving and lasting relationship.pdfthe 25 most beautiful words for a loving and lasting relationship.pdf
the 25 most beautiful words for a loving and lasting relationship.pdf
 
Q1 Quarterly Update - April 16, 2024.pdf
Q1 Quarterly Update - April 16, 2024.pdfQ1 Quarterly Update - April 16, 2024.pdf
Q1 Quarterly Update - April 16, 2024.pdf
 
slideshare_2404_presentation materials_en.pdf
slideshare_2404_presentation materials_en.pdfslideshare_2404_presentation materials_en.pdf
slideshare_2404_presentation materials_en.pdf
 
young call girls in Govindpuri 🔝 9953056974 🔝 Delhi escort Service
young call girls in Govindpuri 🔝 9953056974 🔝 Delhi escort Serviceyoung call girls in Govindpuri 🔝 9953056974 🔝 Delhi escort Service
young call girls in Govindpuri 🔝 9953056974 🔝 Delhi escort Service
 

SGS 2021 Full Year Results Report

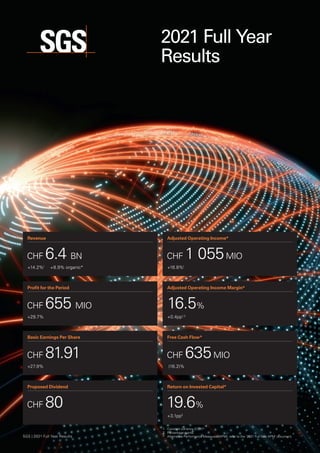
  • 1. 1. Constant currency (CCY)*. 2. Percentage points. * Alternative Performance Measures (APM), refer to the ‘2021 Full Year APM’ document. 2021 Full Year Results Revenue CHF 6.4 BN +14.2%1 +8.9% organic* Profit for the Period CHF 655 MIO +29.7% Basic Earnings Per Share CHF 81.91 +27.9% Proposed Dividend CHF 80 Return on Invested Capital* 19.6% +3.1pp2 Adjusted Operating Income* CHF 1 055MIO +16.8%1 Adjusted Operating Income Margin* 16.5% +0.4pp1,2 Free Cash Flow* CHF 635MIO (16.2)% SGS | 2021 Full Year Results
  • 2.
  • 3. Financial Highlights (CHF million) 2021 2020 Change in % 2020 CCY2 Change in CCY2 % Revenue 6 405 5 604 14.3 5 607 14.2 Operating income (EBIT) 977 795 22.9 799 22.3 Operating income margin 15.3% 14.2% 14.3% Adjusted operating income* 1 055 900 17.2 903 16.8 Adjusted operating income margin* 16.5% 16.1% 16.1% EBITDA* 1 476 1 312 12.5 1 318 12.0 Adjusted EBITDA* 1 515 1 324 14.4 1 329 14.0 Profit for the period 655 505 29.7 Profit attributable to equity holders of SGS SA 613 480 27.7 Adjusted profit attributable to equity holders of SGS SA* 670 565 18.6 Basic EPS (CHF) 81.91 64.05 27.9 Diluted EPS (CHF) 81.79 63.82 28.2 Adjusted basic EPS (CHF)* 89.46 75.44 18.6 Cash flow from operating activities 1 169 1 186 (1.4) Free cash flow* 635 758 (16.2) Return on invested capital* 19.6% 16.5% Net debt* (1 691) (1 478) Weighted average number of shares (‘000) 7 488 7 489 Average FTE1 93 297 89 098 4.7 1. Full Time Equivalent (FTE) employees. 2. Constant currency (CCY)*. * Alternative Performance Measures (APM), refer to the ‘2021 Full Year APM’ document. 1 2021 Full Year Results SGS | 2021 Full Year Results
  • 4. A year of significant progress “We have made significant progress on our new strategic plan, which was implemented at the start of the year. At the same time, our colleagues continue to deal with Covid-related challenges and sometimes tragedies in their personal lives. Their dedication and dynamism through this challenging period remain the basis of our success. “Our strong 2021 performance has confirmed our strategic focus. Combined with the investment in our platform we are building a thriving future for SGS. We will continue to evolve into a more sustainable, digital and data-driven company to support our commitment to enable a better, safer and more interconnected world for all our stakeholders.” Frankie Ng, CEO of SGS. Building on our culture of sustainability at SGS Through our culture at SGS, our employees continue to reinforce our sustainability leadership and enable impactful change. • Our purpose of enabling a better, safer and more interconnected world has shaped our new corporate Sustainability Ambitions 2023 and 2030. These targets will be achieved by our colleagues ‘thinking sustainably’ when engaging with all stakeholders. • To further support our customers to achieve their sustainability goals, we introduced our Sustainability Solutions Framework. This unifies our comprehensive range of existing and new innovative services aligned with the UN Sustainable Development Goals, increasing their value to society. • We continued to align our capital allocation and management incentivization to sustainable criteria through: launching a €1 billion sustainability-linked revolving credit facility; further elevating sustainability factors in the Operations Council capex approval process; introducing sustainability KPIs in both our short-term and long-term management incentivization. • Our 2020-2023 strategic evolution further integrated our financial and non-financial objectives by setting our three target criteria in parallel: Planet, Performance and People. Strategic progress In May we communicated the next phase of our strategic evolution to make our global network more customer-centric and further aligned to the key TIC megatrends. Much progress has been made in 2021 including: • Accelerating net capex to 5.1% of Group revenue. This was concentrated on both our strategic priority areas and SGS’s platform to accelerate our digital transformation. • Allocating more operational capital to structurally growing markets including connectivity, semiconductors, mobility, biopharma, environmental and food testing. • Investing significantly in Digital Innovation to create new products and services, improve customer experience and automate our operations. Examples of this include: established an emerging technology competence center; developing digital; partnering with Microsoft to accelerate the process; developing digital IoT and AI centers of excellence; establishing process, governance and KPIs to ensure progress. • Acquiring Brightsight, which materially accelerates our global strategy to become the global TIC leader in cybersecurity and Quay Pharmaceuticals, a leader in formulation research and development, further expanding our positioning along the Health Sciences supply chain. In addition, we continued to integrate SGS Analytics, which significantly accelerates our European hub and spoke laboratory model in high-volume environmental testing. Financial discipline and focused capital allocation In 2021, our strong operational performance was supported by our pricing initiatives and cost control in an inflationary environment, as well as working capital management. At the same time, we have continued to invest in productivity across the global network. • Organic* growth was particularly strong in our key strategic focus areas of Health Nutrition, Connectivity Products and Knowledge, which are all tracking comfortably above 2019 revenue levels. • Significant progress was made on the strategically important implementation of our ‘Level Up’ finance, IT and operations initiatives. This includes accelerating the coverage and capability of our shared service centers, progress on our IT transformation, billing centralization and improving our reporting data intelligence. • Nine acquisitions were completed, further aligning our portfolio with our focus on megatrends. A strong financial performance Total revenue reached CHF 6.4 billion, up by 14.3% (14.2% at constant currency*), driven by the ongoing recovery from the Covid-19 pandemic as well as strategic focus and significant contribution from acquired revenue. Organic revenue* increased by 8.9%. Operating income increased from CHF 795 million in prior year to CHF 977 million in 2021 due to the revenue increase and related productivity improvement. No goodwill impairment was recognized in 2021. In 2020, the high restructuring costs were partly offset by a gain on business disposal. Adjusted operating income* increased from CHF 900 million in prior year to CHF 1 055 million in 2021, an increase of 17.2% (16.8% at constant currency*). Adjusted operating income margin* increased from 16.1% in prior year (also 16.1% at constant currency*) to 16.5% in 2021, supported by additional productivity increase. Net financial expenses slightly decreased from CHF 54 million in prior year to CHF 53 million in 2021. Effective tax rate (ETR) decreased from 32% in prior year to 29%. The prior year was mainly impacted by non-deductibility of both goodwill impairment and a portion of restructuring costs. Profit attributable to equity holders increased from CHF 480 million in prior year to CHF 613 million in 2021, an increase of 27.7% over prior year. Basic earnings per share increased from CHF 64.05 in prior year to CHF 81.91, an improvement of 27.9%. Cash flow from operating activities was CHF 1 169 million, comparable with prior year. Higher profit was offset by a higher net working capital requirement to support the recovery of activity in 2021. Operating net working capital* remained negative as a percentage of revenue at (2.4)% compared to (2.5)% in prior year. * Alternative Performance Measures (APM), refer to the ‘2021 Full Year APM’ document. 2021 Full Year Results 2 SGS | 2021 Full Year Results
  • 5. Free cash flow (FCF)* decreased from CHF 758 million in prior year to CHF 635 million in 2021. The lower level of FCF was mainly driven by higher capex investment. Investment activities: Net capex was CHF 331 million versus CHF 246 million in prior year and the Group completed nine acquisitions for a total cash consideration of CHF 214 million. Financing activities: In 2021, the Group paid a dividend of CHF 599 million. Return on invested capital (ROIC)* increased from 16.5% in prior year to 19.6% in 2021. Prior year was impacted by SGS Analytics (formerly SYNLAB AS), which was acquired as at 31 December 2020. Adjusted for this acquisition, 2020 ROIC would have been 20.9%. As at 31 December 2021, the Group net debt* was CHF 1 691 million versus CHF 1 478 million in prior year. Business growth and adjusted operating income margin 2021 (CHF million) Revenue Growth at CCY1 Organic* growth at CCY1 Adjusted operating income* Adjusted operating income Margin* CP 1 288 8.8% 7.7% 316 24.5% HN 861 30.1% 15.9% 149 17.3% IE 2 120 18.0% 7.5% 240 11.3% NR 1 473 6.2% 6.0% 210 14.3% Kn 663 14.7% 14.7% 140 21.1% Total 6 405 14.2% 8.9% 1 055 16.5% 1. Constant currency (CCY)*. Acquisitions Date Location Division line FTE Analytical Development Services (ADS) 7 January 2021 United Kingdom HN 86 BZH GmbH Deutsches Beratungszentrum für Hygiene 29 January 2021 Germany IE 71 Autoscope/CTOK 2 February 2021 France IE 10 International Service Laboratory (ISL) 1 April 2021 Ireland HN 86 Brightsight 4 May 2021 The Netherlands CP 145 Metair Lab 1 June 2021 France IE 19 Groupe IDEA TESTS 1 December 2021 France HN 73 Sulphur Experts Inc. 1 December 2021 Canada NR 40 Quay Pharmaceuticals Limited 6 December 2021 United Kingdom HN 192 Mid-term targets 2020-2023 Planet Performance People Reducing our CO2 emissions Support the transition to a low-carbon world by meeting our Science-based Target of reducing our CO2 emissions per revenue by 35%¹ High single-digit constant currency revenue Compound Annual Growth Rate (CAGR) Driven by mid-single-digit organic* growth per annum and a focus on MA Ensuring diversity Nurture diversity and inclusion based on merit by ensuring equal opportunity to all employees and evolving our gender diversity to 30% women in leadership at CEO-3 positions and above Sustainability solutions Support our customers on their journey to sustainability by increasing the proportion of revenue generated by our sustainability solutions to above 50% 10% adjusted operating income* CAGR World Class Service (WCS) Promote a culture of operational safety, efficiency and excellence through our WCS program: 20% of our WCS labs (2020 perimeter) reaching WCS Bronze award level Integrity principles Reduce the impact that our supply chain has on society by committing our strategic suppliers to support our integrity principles Strong Economic Value Added discipline (EVA) Supporting personal development Support the personal development of our employees by increasing the completion rate of job-related training by 10%² Energy efficiency Increasing annually the number of energy efficiency measures in our 100 most energy intensive owned buildings Maintain or grow the dividend per share Positive impact on communities Increase by 10%² our positive impact on our communities through employee volunteering, focusing on vulnerable groups including those affected by pandemics 1. Against a 2014 baseline. 2. Against a 2019 baseline. * Alternative Performance Measures (APM), refer to the ‘2021 Full Year APM’ document. 3 2021 Full Year Results SGS | 2021 Full Year Results
  • 6. Outlook 2022 • Mid-single-digit organic growth • Improving adjusted operating income benefiting from operational leverage • Strong cash conversion • Maintain best-in-class organic return on invested capital • Accelerate investment into our strategic focus areas with MA as a key differentiator • At least maintain the dividend Management changes Jessica Sun joined the SGS Group as Senior Vice President of Human Resources and has been appointed to the Operations Council. José María Hernández-Sampelayo (formerly Senior Vice President of Human Resources) stepped down from the Operations Council to take the role of Vice President of Group Strategic Projects. Steven Du has been appointed Chief Operating Officer of North East Asia replacing Helmut Chik who has decided to leave the SGS Group to pursue other interests. We would like to thank Jose Maria and Helmut for their dedication and contributions to the Operations Council and Helmut for his significant contribution to the SGS Group. Board changes On 23 March 2021, Janet S. Vergis was elected as a member of the Board of Directors bringing over 30 years of experience in positions of responsibility in research development, new product development and sales marketing in the healthcare industry. François von Finck, Gérard Lamarche and Cornelius Grupp did not stand for re-election. SGS would like to thank them for their support and direction. Distribution shareholders The SGS Board of Directors will recommend to the Annual General Meeting (to be held on 29 March 2022) the approval of a dividend of CHF 80 per share. Significant shareholders As at 31 December 2021, Groupe Bruxelles Lambert (acting through Serena SARL and URDAC) held 19.11% (December 2020: 18.91%) of the share capital and voting rights of the company. At the same date, the Group held 0.04% of the share capital of the company (December 2020: 1.28%). Calvin Grieder Chair of the Board of Directors Frankie Ng Chief Executive Officer 27 January 2022 2021 Full Year Results 4 SGS | 2021 Full Year Results
  • 7. (CHF million) 2021 20202 Change in % 2020 CCY1 Change in CCY1 % Revenue 1 288 1 175 9.6 1 184 8.8 Adjusted operating income* 316 287 10.1 290 9.0 Margin %* 24.5 24.4 24.5 Connectivity Products revenue increased by 8.8% at constant currency (organic growth was 7.7%) to CHF 1 288 million. Excluding the impact from lower PPE testing volumes, there was a strong recovery in all Strategic Business Units (SBU). Connectivity grew materially more than the divisional average with an excellent contribution from all segments which was supported by easing regional restrictions, our long-term focused investment strategy and further penetration into the Cybersecurity market through the acquisition of Brightsight. Softlines growth was below the divisional average. A strong recovery in Bangladesh, Taiwan and Turkey was driven by increased levels of activity from major retailers and brands. There was also good progress from our sustainable solutions. As expected, PPE testing volumes were at a lower level compared to last year. Hardlines increased less than divisional average. Hardgoods recovered strongly in all geographies and improving European and Asian market conditions resulted in higher automotive laboratory testing volumes. Toys and Juvenile was stable compared to last year. Trade Facilitation services posted higher growth than the divisional average led by eCustoms services expansion in Europe. This was partially offset by unfavorable trade conditions affecting certain Product Conformity Assessment programs. The adjusted operating income margin remained stable at 24.5% versus prior year (at constant currency), with profitability improving across most of the portfolio due to a strong focus on cost and structural optimization. This was offset by lower volumes of highly profitable PPE testing. (CHF million) 2021 20202 Change in % 2020 CCY1 Change in CCY1 % Revenue 861 658 30.9 662 30.1 Adjusted operating income* 149 102 46.1 103 44.7 Margin %* 17.3 15.5 15.6 Health Nutrition revenue increased by 30.1% at constant currency (organic growth was 15.9%) to CHF 861 million. All SBUs and regions delivered a strong performance resulting in double-digit organic growth. Food achieved double-digit organic growth as underlying markets rebounded and were supported by new regulations in Asia and increasing demand for plant-based and health products in Europe, as well as expansion of our customer base in North America. Crop Science revenue increased below the divisional average, supported by growth across all segments, particularly in Europe. Health Science grew well above the divisional average, benefiting from work related to Covid-19 vaccines and strong momentum in North America. Cosmetics Hygiene grew organically by double digits, slightly below the divisional average, led by a rebound of activities in North America and in North East Asia. The adjusted operating income margin increased to 17.3% from 15.6% in prior year (at constant currency). Profitability improved across the portfolio as the increase in volume drove strong operational leverage. Connectivity Products Health Nutrition 1. Constant currency (CCY) – Definition in APM. 2. See Note 2 on segment information restatement. * Alternative Performance Measures (APM), refer to the ‘2021 Full Year APM’ document. Acquisitions • Brightsight in The Netherlands Acquisitions • Analytical Development Services (ADS) in the UK • International Service Laboratory (ISL) in Ireland • Groupe IDEA TESTS in France • Quay Pharmaceuticals Limited in the UK 5 2021 Full Year Results SGS | 2021 Full Year Results
  • 8. (CHF million) 2021 20202 Change in % 2020 CCY1 Change in CCY1 % Revenue 2 120 1 798 17.9 1 796 18.0 Adjusted operating income* 240 178 34.8 181 32.6 Margin %* 11.3 9.9 10.1 Industries Environment revenue increased by 18.0% at constant currency (organic growth was 7.5%) to CHF 2 120 million. All SBUs grew in 2021. Field Services and Inspection grew above divisional average as a result of a strong increase in demand for inspection and monitoring activities, particularly in Europe and Asia. Double-digit growth was achieved across the network driven by renewable energy projects in field services. Technical Assessment and Advisory grew above the divisional average with double-digit organic growth benefiting from a rebound in Latin America. Total growth was supplemented by a strong performance from Ryobi Geotechnique International Pte Ltd. acquired in late 2020. Industrial and Public Health Safety grew above the divisional average, at a double-digit rate. This was driven by a strong performance in the industrial laboratory network in North East Asia and strong volumes in Health Safety services in North America. Environmental Testing remained organically stable. A strong pick-up in activity in Latin America was partly offset by a slower recovery in the USA and some European countries. The SYNLAB Analytics Services acquisition had a solid performance and has materially increased our European footprint, accelerating our hub and spoke laboratory model. Public Mandates revenue decreased slightly due to a lost contract in Africa which was partly compensated by strong recovery in vehicle compliance in Europe and Latin America. The adjusted operating income margin increased to 11.3% from 10.1% in prior year (at constant currency) through a combination of higher volumes and cost optimization. (CHF million) 2021 20202 Change in % 2020 CCY1 Change in CCY1 % Revenue 1 473 1 397 5.4 1 387 6.2 Adjusted operating income* 210 225 (6.7) 220 (4.5) Margin %* 14.3 16.1 15.9 Natural Resources revenue increased by 6.2% at constant currency (organic growth was 6.0%) to CHF 1 473 million, fueled by the buoyant minerals market with high commodity prices and increased exploration funding. Trade and Inspection posted moderate growth, less than the divisional average, with the strong demand across minerals commodities offsetting weaker performance in agricultural commodities. Strong trade volumes in Latin America and Asia in agriculture were insufficient to offset adverse meteorological conditions and the resulting poor crop season in Europe and North America. Oil and Gas Commodities achieved stable growth despite the challenging trading environment. Laboratory Testing delivered double-digit growth with a surge in exploration sample volumes across the network. Geochemistry onsite laboratories continued their positive trajectory and strongly maintained their global leadership position, with new laboratory additions in Eastern Europe and Africa. Oil and gas analytical services benefited from strong laboratory outsourcing activities and grew above divisional levels. Metallurgy and Consulting achieved double-digit growth with the resumption of metallurgical pilot projects delayed from the previous year. Service innovation continued with the launch of integrated services in geomet and process solutions as well as new services related to critical metals and battery metals. Market Intelligence growth was above divisional levels with the replication of digital services across the Natural Resources supply chain. The adjusted operating income margin decreased to 14.3% from 15.9% in prior year (at constant currency), resulting from the challenges in agricultural commodities and competitive pricing in oil and gas. This was partially offset by improved profitability in the mining sector in addition to ongoing operational optimization across the network. Industries Environment Natural Resources 1. Constant currency (CCY) – Definition in APM. 2. See Note 2 on segment information restatement. * Alternative Performance Measures (APM), refer to the ‘2021 Full Year APM’ document. Acquisitions • Autoscope/CTOK in France • BZH GmbH Deutsches Beratungszentrum für Hygiene in Germany • Metair Lab in France Acquisitions • Sulphur Experts Inc. in Canada 2021 Full Year Results 6 SGS | 2021 Full Year Results
  • 9. (CHF million) 2021 20202 Change in % 2020 CCY1 Change in CCY1 % Revenue 663 576 15.1 578 14.7 Adjusted operating income* 140 108 29.6 109 28.4 Margin %* 21.1 18.8 18.9 Knowledge revenue increased organically by 14.7% to CHF 663 million. All SBUs and regions grew by double digits resulting in a solid increase. Management System Certification grew by double digits driven by the combination of a higher volume of recertification audits as well as a strong performance in information security, medical devices and certification. Growth was lower in H2 due to a challenging comparable with the post Covid-19 catch-up period in H2 2020, however growth versus H2 2019 was double digit. Customized Audits increased above the divisional average, fueled by a high volume of social audits in Asia and Europe as well as strong demand for newly launched Environmental, Social and Governance (ESG) services. Consulting grew above the divisional average. SGS Productivity (LeanSis) delivered solid results boosted by the international replication of services. Maine Pointe also rebounded, particularly in H2, driven by the strong demand for supply chain improvement solutions. Academy improved in H2 as students gradually returned to classrooms and virtual training solutions continued to gain traction. However, market demand remains below pre-pandemic levels. The adjusted operating income margin increased to 21.1% from 18.9% in prior year (at constant currency). Profitability improved across all geographies benefiting from the strong volume increase, improved auditors utilization and a leaner cost base. Knowledge 1. Constant currency (CCY) – Definition in APM. 2. See Note 2 on segment information restatement. * Alternative Performance Measures (APM), refer to the ‘2021 Full Year APM’ document. 7 2021 Full Year Results SGS | 2021 Full Year Results
  • 10. 8 2021 Full Year Results SGS | 2021 Full Year Results
  • 11. Condensed Consolidated Financial Statements Condensed Consolidated Income Statement For the period ended 31 December 2021 (CHF million) Notes 2021 2020 Revenue 4 6 405 5 604 Salaries and wages (3 180) (2 797) Subcontractors’ expenses (385) (352) Depreciation, amortization and impairment (499) (517) Gain on business disposals – 63 Other operating expenses (1 364) (1 206) Operating income (EBIT) 4 977 795 Financial income 16 12 Financial expenses (69) (66) Share of profit of associates and joint ventures – 1 Profit before taxes 924 742 Taxes (269) (237) Profit for the period 655 505 Profit attributable to: Equity holders of SGS SA 613 480 Non-controlling interests 42 25 Basic earnings per share (in CHF) 5 81.91 64.05 Diluted earnings per share (in CHF) 5 81.79 63.82 Condensed Consolidated Statement of Comprehensive Income For the period ended 31 December 2021 (CHF million) 2021 2020 Actuarial gains on defined benefit plans 57 14 Income tax on actuarial (losses) (6) (4) Items that will not be subsequently reclassified to income statement 51 10 Exchange differences (32) (182) Items that may be subsequently reclassified to income statement (32) (182) Other comprehensive income/(loss) for the period 19 (172) Profit for the period 655 505 Total comprehensive income for the period 674 333 Attributable to: Equity holders of SGS SA 629 311 Non-controlling interests 45 22 9 2021 Full Year Results SGS | 2021 Full Year Results
  • 12. Condensed Consolidated Balance Sheet For the period ended 31 December 2021 (CHF million) 2021 2020 Assets Non-current assets Property, plant and equipment 925 872 Right-of-use assets 605 590 Goodwill 1 778 1 651 Other intangible assets 382 333 Investments in joint ventures, associates and other companies 26 34 Deferred tax assets 164 161 Other non-current assets 173 154 Total non-current assets 4 053 3 795 Current assets Inventories 59 57 Unbilled revenues and work in progress 175 160 Trade receivables 928 856 Other receivables and prepayments 204 188 Current tax assets 108 77 Marketable securities – 9 Cash and cash equivalents 1 480 1 766 Total current assets 2 954 3 113 Total assets 7 007 6 908 Equity and liabilities Capital and reserves Share capital 7 8 Reserves 1 118 1 282 Treasury shares (8) (230) Equity attributable to equity holders of SGS SA 1 117 1 060 Non-controlling interests 85 74 Total equity 1 202 1 134 Non-current liabilities Loans and other financial liabilities 2 889 2 390 Lease liabilities 481 470 Deferred tax liabilities 92 53 Defined benefit obligations 84 136 Provisions 90 88 Total non-current liabilities 3 636 3 137 Current liabilities Trade and other payables 687 658 Contract liabilities 221 189 Current tax liabilities 169 140 Loans and other financial liabilities 282 863 Lease liabilities 155 151 Provisions 60 85 Other creditors and accruals 595 551 Total current liabilities 2 169 2 637 Total liabilities 5 805 5 774 Total equity and liabilities 7 007 6 908 2021 Full Year Results 10 SGS | 2021 Full Year Results
  • 13. Condensed Consolidated Statement of Changes in Equity For the period ended 31 December 2021 Attributable to: (CHF million) Share capital Treasury shares Capital reserve Cumulative translation adjustments Cumulative (losses)/gains on defined benefit plans net of tax Retained earnings and Group reserves Equity Holders of SGS SA Non- controlling Interests Total Equity Balance at 1 January 2020 8 (30) 146 (1 128) (251) 2 769 1 514 81 1 595 Profit for the period – – – – – 480 480 25 505 Other comprehensive income for the period – – – (179) 10 – (169) (3) (172) Total comprehensive income for the period – – – (179) 10 480 311 22 333 Dividends paid – – – – – (598) (598) (37) (635) Share-based payments – – 17 – – – 17 – 17 Movement in non-controlling interests – – – – – 20 20 8 28 Movement on treasury shares – (200) (3) – – (1) (204) – (204) Balance at 31 December 2020 8 (230) 160 (1 307) (241) 2 670 1 060 74 1 134 Balance at 1 January 2021 8 (230) 160 (1 307) (241) 2 670 1 060 74 1 134 Profit for the period – – – – – 613 613 42 655 Other comprehensive income for the period – – – (35) 51 – 16 3 19 Total comprehensive income for the period – – – (35) 51 613 629 45 674 Dividends paid – – – – – (599) (599) (41) (640) Share-based payments – – 12 – – – 12 – 12 Movement in non-controlling interests – – – – – 14 14 7 21 Movement on treasury shares (1) 222 (42) – – (178) 1 – 1 Balance at 31 December 2021 7 (8) 130 (1 342) (190) 2 520 1 117 85 1 202 11 2021 Full Year Results SGS | 2021 Full Year Results
  • 14. Condensed Consolidated Cash Flow Statement For the period ended 31 December 2021 (CHF million) 2021 2020 Profit for the period 655 505 Non-cash and non-operating items 828 748 (Increase)/decrease in working capital (44) 186 Taxes paid (270) (253) Cash flow from operating activities 1 169 1 186 Purchase of property, plant and equipment and other intangible assets (336) (259) Disposal of property, plant and equipment and other intangible assets 5 13 Acquisition of businesses (214) (492) Proceeds from disposal of businesses – 71 Cash paid on other non-current assets (2) (4) Proceeds received from investments in joint ventures, associates and other companies 1 1 Interest received 17 15 Proceeds from marketable securities 9 – Cash flow used by investing activities (520) (655) Dividends paid to equity holders of SGS SA (599) (598) Dividends paid to non-controlling interests (41) (37) Transaction with non-controlling interests (12) (1) Cash paid on treasury shares – (208) Proceeds from corporate bonds 824 499 Payment of corporate bonds (276) – Interest paid (66) (63) Payment of lease liabilities (179) (161) Proceeds from borrowings – 542 Payment of borrowings (555) (154) Cash flow used by financing activities (904) (181) Currency translation (31) (50) (Decrease)/increase in cash and cash equivalents (286) 300 Cash and cash equivalents at beginning of year 1 766 1 466 (Decrease)/increase in cash and cash equivalents (286) 300 Cash and cash equivalents at end of the period 1 480 1 766 2021 Full Year Results 12 SGS | 2021 Full Year Results
  • 15. 1. Activities of the Group SGS SA and its subsidiaries (the “Group”) operate around the world under the name SGS. The head office of the Group is located in Geneva, Switzerland. SGS is the global leader in testing, inspection and certification (TIC) services supporting international trade in agriculture, minerals, petroleum and consumer products. It also provides these services to governments, international institutions and customers engaged in the industrial, environmental and life sciences sectors. 2. Basis of preparation, significant transaction and segment information restatement Basis of preparation These condensed consolidated financial statements have been prepared in accordance with the measurement and recognition criteria of International Financial Reporting Standards (IFRS). Covid-19 pandemic Although economic indicators have risen, the duration and extent of the pandemic together with the related financial, social and public health impacts of Covid-19 remain uncertain. Consequently, these condensed consolidated financial statements were prepared considering the continued impact of the pandemic, with particular attention to (i) the impairment of non-current assets, (ii) the appropriateness of the allowance for trade receivables, unbilled revenue and work in progress, (iii) the level of provision for risks, as well as (iv) accounting for government grants. No material impacts were recognized in these condensed consolidated financial statements. Business segment financial restatement As indicated early this year, SGS’s operational structure has been simplified into new focus areas composed of five divisions: Connectivity Products, Health Nutrition, Industries Environment, Natural Resources and Knowledge. The implementation of this divisional structure, effective as of 1 January 2021, resulted in improving SGS’s market approach and increasing cooperation and agility across our global network. Other than creating more operational synergies, the Group expects to reinvigorate the growth profiles of these services. The previously reported 2020 segment disclosures have been restated to reflect this change and are disclosed in note 4. 3. Changes to the Group’s accounting policies The accounting policies used in the preparation and presentation of the Group’s condensed financial statements are consistent with those used in the Group’s consolidated financial statements. Several new amendments and interpretations were adopted effective 1 January 2021 but have no material impact on the Group’s consolidated financial statements. 4. Analysis of operating income (CHF million) 2021 2020 Adjusted operating income* 1 055 900 Amortization and impairment of acquired intangibles (39) (31) Restructuring costs (15) (84) Goodwill impairment – (37) Gain on business disposals – 63 Transaction and integration costs (24) (16) Operating income 977 795 2021 (CHF million) Revenue Adjusted operating income* Amortization of acquisition intangibles Restructuring costs Transaction and integration costs Operating income by business CP 1 288 316 (5) (2) (1) 308 HN 861 149 (7) (2) (9) 131 IE 2 120 240 (21) (5) (11) 203 NR 1 473 210 – (6) (1) 203 Kn 663 140 (6) – (2) 132 Total 6 405 1 055 (39) (15) (24) 977 Notes to the Condensed Consolidated Financial Statements * Alternative Performance Measures (APM), refer to the ‘2021 Full Year APM’ document. 13 2021 Full Year Results SGS | 2021 Full Year Results
  • 16. * Alternative Performance Measures (APM), refer to the ‘2021 Full Year APM’ document. 2020 (CHF million) Revenue Adjusted operating income* Amortization of acquisition intangibles Restructuring costs Goodwill impairment Gain on business disposals Transaction and integration costs Operating income by business CP 1 175 287 (1) (2) (5) – (1) 278 HN 658 102 (5) (6) (16) – (4) 71 IE 1 798 178 (14) (65) (8) – (11) 80 NR 1 397 225 (1) (8) – 63 – 279 Kn 576 108 (10) (3) (8) – – 87 Total 5 604 900 (31) (84) (37) 63 (16) 795 2020 Published (CHF million) Revenue Adjusted operating income* Amortization of acquisition intangibles Restructuring costs Goodwill impairment Gain on business disposals Transaction and integration costs Operating income by business AFL 996 175 (4) (5) (16) 63 (4) 209 MIN 639 111 (1) (7) – – – 103 OGC 776 76 – (5) – – (2) 69 CRS 1 054 264 (2) (3) – – (1) 258 CBE 429 82 (10) (3) (8) – – 61 IND 847 72 (7) (13) (10) – (2) 40 EHS 471 42 (4) (3) – – (6) 29 GIS 392 78 (3) (45) (3) – (1) 26 Total 5 604 900 (31) (84) (37) 63 (16) 795 All segment revenues reported above are from external customers. The adjusted operating income* represents the profit earned by each segment. This is the main measure reported to the chief operating decision makers for the purposes of resource allocation and assessment of segmental performance. Restructuring costs The Group incurred a pre-tax restructuring charge of CHF 15 million (2020: CHF 84 million, out of which CHF 45 million was recognized for IE activities (former attributed to GIS activities), mainly driven by the termination of the single-window contract with the Government of Ghana and the vehicle inspection contract with the Government of Uganda). 2021 Full Year Results 14 SGS | 2021 Full Year Results
  • 17. 5. Earnings per share 2021 2020 Profit attributable to equity holders of SGS SA (CHF million) 613 480 Weighted average number of shares (‘000) 7 488 7 489 Basic earnings per share (CHF) 81.91 64.05 2021 2020 Profit attributable to equity holders of SGS SA (CHF million) 613 480 Diluted weighted average number of shares (‘000) 7 500 7 516 Diluted earnings per share (CHF) 81.79 63.82 6. Exchange rates The most significant currencies for the Group were translated at the following exchange rates into Swiss Francs. Statement of financial position period-end rates Income statement period average rates 2021 2020 2021 2020 Australia AUD 100 66.59 67.66 68.67 64.75 Canada CAD 100 71.65 69.12 72.93 70.05 Chile CLP 100 0.11 0.12 0.12 0.12 China CNY 100 14.40 13.54 14.17 13.60 Eurozone EUR 100 103.78 108.42 108.16 107.04 Korea KRW 100 0.08 0.08 0.08 0.08 United Kingdom GBP 100 123.57 119.75 125.72 120.47 Russia RUB 100 1.24 1.19 1.24 1.31 Taiwan TWD 100 3.32 3.15 3.27 3.19 USA USD 100 91.72 88.45 91.42 93.92 15 2021 Full Year Results SGS | 2021 Full Year Results
  • 18. Shareholder Information SGS SA corporate office 1 place des Alpes P.O. Box 2152 CH – 1211 Geneva 1 t +41 (0)22 739 91 11 f +41 (0)22 739 98 86 e sgs.investor.relations@sgs.com www.sgs.com Stock exchange listing SIX Swiss Exchange, SGSN Stock exchange trading SIX Swiss Exchange Common stock symbols Bloomberg: Registered Share: SGSN.SW Reuters: Registered Share: SGSN.S Telekurs: Registered Share: SGSN ISIN: Registered Share: CH0002497458 Swiss security number: 249745 Investor Relations Toby Reeks SGS SA 1 place des Alpes P.O. Box 2152 CH – 1211 Geneva 1 t +41 (0)22 739 99 87 m +41 (0)79 641 83 02 +44 7899 800 575 www.sgs.com Investor days November 2022 2022 Half Year results Tuesday, 19 July 2022 Annual General Meeting of Shareholders Tuesday, 29 March 2022 Geneva, Switzerland Media relations Magali Dauwalder SGS SA 1 place des Alpes P.O. Box 2152 CH – 1211 Geneva 1 t +41 (0)22 739 95 51 m +41 (0)79 329 46 70 www.sgs.com 2021 Full Year Results 16 SGS | 2021 Full Year Results
  • 19. Disclaimer This material is provided for information purposes only and is not intended to confer any legal rights to you. This document does not constitute an invitation to invest in SGS shares. Any decisions you make in reliance on this information are solely your responsibility. This document is given as of the dates specified, is not updated and any forward- looking statements are made subject to the following reservations: This document contains certain forward- looking statements that are neither historical facts nor guarantees of future performance. Because these statements involve risks and uncertainties that are beyond control or estimation of SGS, there are important factors that could cause actual results to differ materially from those expressed or implied by these forward-looking statements. These statements speak only as of the date of this document. Except as required by any applicable law or regulation, SGS expressly disclaims any obligation to release publicly any updates or revisions to any forward-looking statements contained herein to reflect any change in SGS Group’s expectations with regard thereto or any change in events or conditions on which any such statements are based.
  • 20. SGS is a registered trademark of SGS Société Générale de Surveillance SA