Horizontal Bar Graph With Percentages

"You can download this product from SlideTeam.net" Introducing this Horizontal Bar Graph With Percentages PowerPoint presentation to showcase the comparison between various products. Using this statistical chart PPT layout, you can discuss the significance of illustrating data in the form of the bar chart to your employees. Tracking of marketing and sales figures can be represented using this bar graph PPT slide. The proportional value of a business variable can be represented in the length of the rectangle with the aid of our statistical interpretation PPT theme. Each product’s sale over a period of time can be easily tracked using this data evaluation tool PowerPoint theme. The discrete categories comparison can be showcased using this horizontal column chart PPT template. Additionally, the different products of your company can be highlighted with the help of this data analysis PowerPoint layout. Hence download this analytical data PowerPoint layout to show interrelation among variables over time. https://bit.ly/3N7aJFB

Recommended
Recommended
More Related Content
Similar to Horizontal Bar Graph With Percentages
Similar to Horizontal Bar Graph With Percentages (20)
More from SlideTeam
More from SlideTeam (20)
Recently uploaded
Recently uploaded (20)
Horizontal Bar Graph With Percentages
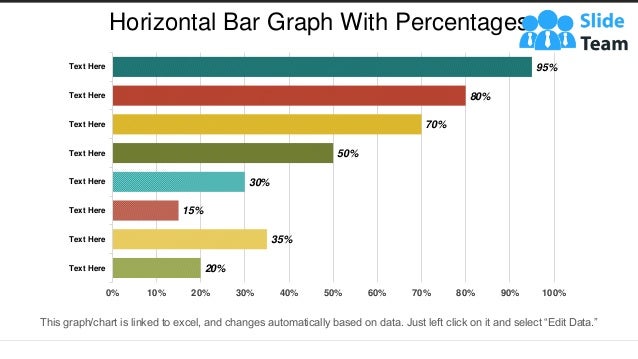
- 1. 20% 35% 15% 30% 50% 70% 80% 95% 0% 10% 20% 30% 40% 50% 60% 70% 80% 90% 100% Text Here Text Here Text Here Text Here Text Here Text Here Text Here Text Here This graph/chart is linked to excel, and changes automatically based on data. Just left click on it and select “Edit Data.” Horizontal Bar Graph With Percentages
- 2. All images are 100% editable in PowerPoint Change color, size and orientation of any icon to your liking”
- 3. 1. Select the Graph and right click -> Select "Edit Data" 2. An excel matrix will automatically show up 3. Enter the values based on your requirements and hit enter 4. The Graph/Chart shape will automatically adjust according to your data, and anytime you can go and change the value again Edit Excel-linked Chart This is a Data Driven Chart/Graph and the shape automatically adjusts according to your data 1 2 3
- 4. Edit Color 1. Select the shape to change the color and Right click the object( click any object which you want to change color) 2. Choose Format Data Series in the dialog box. 3. Choose “Fill” in the Format Shape box then “Solid” or “Gradient” depending on the appearance of the object. Change colour as shown in the picture. 1 2 3
- 5. Select From Thousands Of Editable Icons On Every Topic These icons are available at the Icons section on www.slideteam.net