
Recommended
Recommended
More Related Content
Featured
Featured (20)
Gibbs Phenomenon - پدیده گیبس
- 1. TeTe xtxt GibbsGibbs PhenomenonPhenomenon گیبس پدیدهگیبس پدیده خوبهی شاهینخوبهی شاهین:فرد خسروی دکتر استاد:فرد خسروی دکتر استاد
- 2. تاریخچهتاریخچه قرن در ،ابتدا نامش خلف بر گیبس پدیدهقرن در ،ابتدا نامش خلف بر گیبس پدیده۱۹۱۹نام به شخصی توسطنام به شخصی توسط WillbrahamWillbraham شد مشاهدهشد مشاهده .. ( )آمریکایی معروف ریاضیدان گیبس توسط دیگر بار ، عجیب پدیده این( )آمریکایی معروف ریاضیدان گیبس توسط دیگر بار ، عجیب پدیده این و تحلیل به دست گیبس ، ویلبراهام خلف بر ولی شد مشاهدهو تحلیل به دست گیبس ، ویلبراهام خلف بر ولی شد مشاهده اکثر در پدیده این دلیل همین به و زد پدیده این گسترده بررسیاکثر در پدیده این دلیل همین به و زد پدیده این گسترده بررسی است مشهور گیبس پدیده به مراجعاست مشهور گیبس پدیده به مراجع .. همچنینهمچنین BocherBocher ذاتی ویژگی یک واقع در ،پدیده این که داد نشانذاتی ویژگی یک واقع در ،پدیده این که داد نشان است تابع یک ناپیوسگی همسایگی در طرفه یک فوریه سری جمعاست تابع یک ناپیوسگی همسایگی در طرفه یک فوریه سری جمع..
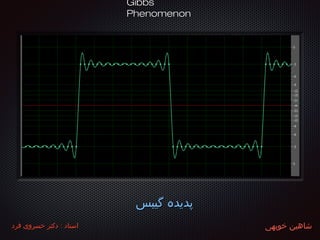
- 3. تاریخچهتاریخچه نمی محدود تیوری های بررسی به تنها گیبس پدیدهنمی محدود تیوری های بررسی به تنها گیبس پدیده های زمینه از بسیاری در را آن تاثیرات شود،بلکههای زمینه از بسیاری در را آن تاثیرات شود،بلکه کرد مشاهده میتوان نیز مهندسی و کاربردی علومکرد مشاهده میتوان نیز مهندسی و کاربردی علوم.. طراحی روند در بریتانیایی دانشمندان مثال عنوان بهطراحی روند در بریتانیایی دانشمندان مثال عنوان به موج تولید به نیاز ، دوم جهانی جنگ طول در رادارموج تولید به نیاز ، دوم جهانی جنگ طول در رادار پدیده با متمادی طور به که داشتند ای اره دندانهپدیده با متمادی طور به که داشتند ای اره دندانه میشدند مواجه تولیدی موج شکل در گیبسمیشدند مواجه تولیدی موج شکل در گیبس .. سیگنال پردازش در وفور به پدیده این امروزه اماسیگنال پردازش در وفور به پدیده این امروزه اما های فیلتر طراحی خصوص به و دیجیتال هایهای فیلتر طراحی خصوص به و دیجیتال های مشاهده ها سیگنال پردازش برای دیجیتالمشاهده ها سیگنال پردازش برای دیجیتال میشودمیشود.. ;تصویر در که همانطور دیگر مثالی عنوان به;تصویر در که همانطور دیگر مثالی عنوان به تصاویر در پدیده این ردپای میکنید مشاهدهتصاویر در پدیده این ردپای میکنید مشاهده شود می دیده نیز پزشکیشود می دیده نیز پزشکی.. MRIMRI تصاویر در گیبس پدیده مخرب تاثیرتصاویر در گیبس پدیده مخرب تاثیر پزشکیپزشکی
- 4. گیبس پدیده توضیحگیبس پدیده توضیح میپردازیم ناپیوستگی تعریف به ابتدا در آوری یاد عنوان بهمیپردازیم ناپیوستگی تعریف به ابتدا در آوری یاد عنوان به .. مانند تابعی ، میدانیم که همانطورمانند تابعی ، میدانیم که همانطور y(t)y(t) مانند ای نقطه درمانند ای نقطه در t=at=a با ناپیوستگی دارایبا ناپیوستگی دارای دامنهدامنه bb اگر میباشداگر میباشد:: limlime->0e->0[y(a+e) - y(a-e)]= b 0≠[y(a+e) - y(a-e)]= b 0≠ تابع یک اگر که دید خواهیم ادامه درتابع یک اگر که دید خواهیم ادامه درپریودیکپریودیکآن فوریه سری ،آنگاه باشد ،ناپیوستهآن فوریه سری ،آنگاه باشد ،ناپیوسته داد خواهد نشان خود از عجیب رفتاریداد خواهد نشان خود از عجیب رفتاری ..
- 5. گیبس پدیده توضیحگیبس پدیده توضیح • سری مجموع مقدار در بالزدگی یا نوسان وجود به گیبس پدیدهسری مجموع مقدار در بالزدگی یا نوسان وجود به گیبس پدیده میشود گفته ناپیوستگی مقادیر نزدیکی در توابع فوریهمیشود گفته ناپیوستگی مقادیر نزدیکی در توابع فوریه .. • چند مجموع از استفاده با میتوان را متناوب سیگنال هر میدانیمچند مجموع از استفاده با میتوان را متناوب سیگنال هر میدانیم نوشت متفاوت های فرکانس با متعامد و ساده نوسانی سیگنالنوشت متفاوت های فرکانس با متعامد و ساده نوسانی سیگنال .. • بازسازی برای شده استفاده های هارمونیک هرچقدر همچنینبازسازی برای شده استفاده های هارمونیک هرچقدر همچنین به ، فوریه سری با شده زده تخمین باشند،سیگنال بیشتر سیگنالبه ، فوریه سری با شده زده تخمین باشند،سیگنال بیشتر سیگنال بود خواهد تر شبیه اصلی سیگنالبود خواهد تر شبیه اصلی سیگنال ..
- 6. • از محدودی تعداد از تنها که هنگامی که است این جالب نکته امااز محدودی تعداد از تنها که هنگامی که است این جالب نکته اما میکنیم استفاده پیوسته سیگنال بازسازی برای ها هارمونیکمیکنیم استفاده پیوسته سیگنال بازسازی برای ها هارمونیک ( )دارای ناپیوستگی نقاط ها لبه در شده سازی شبیه ،سیگنال( )دارای ناپیوستگی نقاط ها لبه در شده سازی شبیه ،سیگنال .حدود در زدگی بال این که بود خواهد بالزدگی.حدود در زدگی بال این که بود خواهد بالزدگی۹۹میباشد ٪میباشد ٪ .. • میشود گفته گیبس پدیده ، ها بالزدگی این بهمیشود گفته گیبس پدیده ، ها بالزدگی این به ..
- 7. • سیگنال سازی شبیه برای استفاده مورد های هارمونیک تعداد بر چه هر ، میکنید مشاهده بال تصویر در که همانطورسیگنال سازی شبیه برای استفاده مورد های هارمونیک تعداد بر چه هر ، میکنید مشاهده بال تصویر در که همانطور ، میابد کاهش بالزدگی ناحیه عرض میشود افزوده مربعی، میابد کاهش بالزدگی ناحیه عرض میشود افزوده مربعی. ! میماند ثابت بالزدگی دامنه اما. ! میماند ثابت بالزدگی دامنه اما برای میدانیم که همانطور اما ، رود می بین از هارمونیک آخرین کردن اضافه با زدگی بال این گسسته های سیگنال دربرای میدانیم که همانطور اما ، رود می بین از هارمونیک آخرین کردن اضافه با زدگی بال این گسسته های سیگنال در بینهایت اصلی موج شکل بازسازی برای لزم های هارمونیک ،تعداد پیوسته زمان و پریودیک های سیگنال بازسازیبینهایت اصلی موج شکل بازسازی برای لزم های هارمونیک ،تعداد پیوسته زمان و پریودیک های سیگنال بازسازی اصلی سیگنال سمت به فوریه سری ، کند میل بینهایت سمت به ها هارمونیک تعداد که هنگامی تنها دیگر بیان به ، استاصلی سیگنال سمت به فوریه سری ، کند میل بینهایت سمت به ها هارمونیک تعداد که هنگامی تنها دیگر بیان به ، است . شد خواهد همگرا. شد خواهد همگرا ، ها هارمونیک کردن اضافه با ، شد گفته که همانطور اما، ها هارمونیک کردن اضافه با ، شد گفته که همانطور اماتنتنمیماند ثابت آن دامنه ولی میابد کاهش بالزدگی پهنای هامیماند ثابت آن دامنه ولی میابد کاهش بالزدگی پهنای ها،، نقطه در زدگی بال عرض تنها ، کنیم استفاده پیوسته سیگنال زدن تخمین برای هارمونیک بینهایت از اگر حتی بنابرایننقطه در زدگی بال عرض تنها ، کنیم استفاده پیوسته سیگنال زدن تخمین برای هارمونیک بینهایت از اگر حتی بنابراین .ماند خواهد باقی ثابت بالزدگی این دامنه ولی ، میکند میل صفر به ناپیوستگی.ماند خواهد باقی ثابت بالزدگی این دامنه ولی ، میکند میل صفر به ناپیوستگی ، که است این میشود مطرح اینجا در که سوالی، که است این میشود مطرح اینجا در که سوالیآیآیها سیگنال ترین پیچیده تحلیل به تا ساخته قادر مارا که فوریه سری اها سیگنال ترین پیچیده تحلیل به تا ساخته قادر مارا که فوریه سری ا لبه یک سازی شبیه از خود ، بپردازیم فرکانس ی حوزه درلبه یک سازی شبیه از خود ، بپردازیم فرکانس ی حوزه در (Edge)(Edge) ؟ است ناتوان؟ است ناتوان سازی شبیه از خود ، بپردازیم فرکانس ی حوزه در ها سیگنال ترین پیچیده تحلیل به تا ساخته قادر مارا که فوریه سری اسازی شبیه از خود ، بپردازیم فرکانس ی حوزه در ها سیگنال ترین پیچیده تحلیل به تا ساخته قادر مارا که فوریه سری ا لبه یکلبه یک (Edge)(Edge) ؟ است ناتوان؟ است ناتوان سازی شبیه از خود ، بپردازیم فرکانس ی حوزه در ها سیگنال ترین پیچیده تحلیل به تا ساخته قادر مارا که فوریه سری اسازی شبیه از خود ، بپردازیم فرکانس ی حوزه در ها سیگنال ترین پیچیده تحلیل به تا ساخته قادر مارا که فوریه سری ا لبه یکلبه یک (Edge)(Edge) ؟ است ناتوان؟ است ناتوان سازی شبیه از خود ، بپردازیم فرکانس ی حوزه در ها سیگنال ترین پیچیده تحلیل به تا ساخته قادر مارا که فوریه سری اسازی شبیه از خود ، بپردازیم فرکانس ی حوزه در ها سیگنال ترین پیچیده تحلیل به تا ساخته قادر مارا که فوریه سری ا لبه یکلبه یک (Edge)(Edge) ؟ است ناتوان؟ است ناتوان
- 8. MATLABMATLAB • افزار نرم از استفاده با پدیده این بررسی به حالافزار نرم از استفاده با پدیده این بررسی به حالMATALBMATALB میپردازیممیپردازیم..
- 9. MATLABMATLAB • فوریه سری از استفاده با را مربعی موج شکل یک که بنویسیم تابعی میخواهیم ادامه درفوریه سری از استفاده با را مربعی موج شکل یک که بنویسیم تابعی میخواهیم ادامه در کند بازسازیکند بازسازی.. • سریه ضرایب تعداد گرفتن با که باشد داشته را قابلیت این گیبس پدیده مشاهده برای همچنینسریه ضرایب تعداد گرفتن با که باشد داشته را قابلیت این گیبس پدیده مشاهده برای همچنین بپردازد شده زده تخمین موج شکل رسم به ورودی عنوان به فوریبپردازد شده زده تخمین موج شکل رسم به ورودی عنوان به فوری..
- 10. MATLABMATLAB • آن فوریه سری و مربعی تابع از ، گیبس پدیده سازی شبیه برایآن فوریه سری و مربعی تابع از ، گیبس پدیده سازی شبیه برای میکنیم استفادهمیکنیم استفاده .. • یک در را آن فوریه سری و مربعی موج شکل میخواهیمیک در را آن فوریه سری و مربعی موج شکل میخواهیم figurefigure موج شکل میخواهیم که است دلیل همین به ، دهیم نشانموج شکل میخواهیم که است دلیل همین به ، دهیم نشان بسازیم نیز را مربعیبسازیم نیز را مربعی • تابع از استفاده مربعی موج شکل تولید های روش از یکیتابع از استفاده مربعی موج شکل تولید های روش از یکی sign(x)sign(x) استاست ..
- 11. MATLABMATLAB [1] n = 1000; % tedade noghate square wave[1] n = 1000; % tedade noghate square wave [2] t = linspace(-pi,pi,n); % tolide n noghte dar bazeye (-pi,pi)[2] t = linspace(-pi,pi,n); % tolide n noghte dar bazeye (-pi,pi) [3] y = sign(t); % va tolide step wave[3] y = sign(t); % va tolide step wave • مورد نقاط تعداد چه هر بنابراین ، میباشد گسسته صورت به میشود تعریف که هایی سیگنال تمام متلب محیط در میدانیممورد نقاط تعداد چه هر بنابراین ، میباشد گسسته صورت به میشود تعریف که هایی سیگنال تمام متلب محیط در میدانیم از اینجا در ما ،است بیشتر خروجی دقت ، باشد بیشتر موج شکل تولید برای استفادهاز اینجا در ما ،است بیشتر خروجی دقت ، باشد بیشتر موج شکل تولید برای استفاده10001000موج شکل تولید برای نقطهموج شکل تولید برای نقطه میکنیم استفاده مربعیمیکنیم استفاده مربعی .. • تابع از استفاده با ، دوم خط درتابع از استفاده با ، دوم خط در linspacelinspace شامل بعدی یک بردار یکشامل بعدی یک بردار یک nn بازه در ، درایهبازه در ، درایه -pi,pi-pi,pi در را آن و میکنیم استفادهدر را آن و میکنیم استفاده ماتریسماتریس xx میکنیم ذخیرهمیکنیم ذخیره.. • :تابع از ، داشتید مشخص بازه یک در نقاط یا سیگنال دامنه تولید به نیاز هرگاه نکته:تابع از ، داشتید مشخص بازه یک در نقاط یا سیگنال دامنه تولید به نیاز هرگاه نکته linspacelinspace . کنید استفاده آنها تولید برای. کنید استفاده آنها تولید برای که دارید نیاز کنید فرض ، مثال عنوان بهکه دارید نیاز کنید فرض ، مثال عنوان به21342134- مثل بازه در ، برابر فاصله با نقطه- مثل بازه در ، برابر فاصله با نقطه300,10300,10کنید تولیدکنید تولید :: x=linspace(-300,10,2134)x=linspace(-300,10,2134) • تابع از استفاده با سوم خط درتابع از استفاده با سوم خط در signsign . میکنیم تولید را مربعی موج شکل. میکنیم تولید را مربعی موج شکل تابع از استفاده باتابع از استفاده با plotplot کنیم مشاهده را خود پالس میتوانیم است گرفته قرار بحث مورد قبل کهکنیم مشاهده را خود پالس میتوانیم است گرفته قرار بحث مورد قبل که.. • plot(t,y,’LineWidth’,2); %argumane avval matrice domain , argumane dovvom matrice signalplot(t,y,’LineWidth’,2); %argumane avval matrice domain , argumane dovvom matrice signal • axis([-pi pi -2 2]);axis([-pi pi -2 2]); • grid on;grid on;
- 13. تابع از استفاده باب در نکاتیتابع از استفاده باب در نکاتی plot()plot() • تابع از ما ، اینجا درتابع از ما ، اینجا در plot()plot() آپشن دارای تابع این ، ایم کرده استفاده خود تابع رسم برایآپشن دارای تابع این ، ایم کرده استفاده خود تابع رسم برای به میتوانید آنها با آشنایی برای که است متعددی های آرگومان و هابه میتوانید آنها با آشنایی برای که است متعددی های آرگومان و ها HELPHELP مراجعه متلبمراجعه متلب فرماییدفرمایید.. • از ما ، خود مربعی تابع رسم برایاز ما ، خود مربعی تابع رسم برای33داشته یاد به همواره ، ایم کرده استفاده آن آرگومانداشته یاد به همواره ، ایم کرده استفاده آن آرگومان تابع به نیز را دامنه ماتریس ، مختصات های محور درست بندی مقیاس برای که باشیدتابع به نیز را دامنه ماتریس ، مختصات های محور درست بندی مقیاس برای که باشید plot()plot() ضرورتی ، است مهم تابع شکل دیدن تنها که مواقعی در کار این چند هر ، بدهیدضرورتی ، است مهم تابع شکل دیدن تنها که مواقعی در کار این چند هر ، بدهید . ندارد. ندارد میباشد تابع ماتریس دوم آرگومان و دامنه ماتریس اول آرگومان منظور بدینمیباشد تابع ماتریس دوم آرگومان و دامنه ماتریس اول آرگومان منظور بدین.. plot(t,y); % t is the matrice of our step function and y is our functionplot(t,y); % t is the matrice of our step function and y is our function • قطر کننده مشخص که ایم کرده استفاده نیز دیگری آرگومان از اینجا در ما همچنینقطر کننده مشخص که ایم کرده استفاده نیز دیگری آرگومان از اینجا در ما همچنین میکنند رسم را تابع که است خطوطیمیکنند رسم را تابع که است خطوطی ،، LineWidthLineWidth را آن میزان ما کهرا آن میزان ما که22تا ایم گذاشتهتا ایم گذاشته شود دیده تر واضح خروجی شکل تا باشند تر کلفت خطوطشود دیده تر واضح خروجی شکل تا باشند تر کلفت خطوط.. • plot(t,y,’LineWidth’,2);plot(t,y,’LineWidth’,2);
- 14. دیگر نکته یکدیگر نکته یک !! • نام به دیگری تابع از ما میبینید که همانطورنام به دیگری تابع از ما میبینید که همانطور axis()axis() و مینیمم کردن مشخص برای تابع ،این ایم کرده استفاده نیزو مینیمم کردن مشخص برای تابع ،این ایم کرده استفاده نیز تابع از استفاده با که هنگامی واقع در ، میشود استفاده مختصات های محور ماکسیممتابع از استفاده با که هنگامی واقع در ، میشود استفاده مختصات های محور ماکسیمم plot()plot() مورد تابع شکلمورد تابع شکل .با که نباشد مشخص کامل طور به خروجی موج شکل است ممکن شده باز پنجره در میکنیم رسم را خود نظر.با که نباشد مشخص کامل طور به خروجی موج شکل است ممکن شده باز پنجره در میکنیم رسم را خود نظر کنیم مشخص را مختصات های محور حدود میتوانیم تابع این از استفادهکنیم مشخص را مختصات های محور حدود میتوانیم تابع این از استفاده .. • میباشد زیر شکل به ، تابع از استفاده روشمیباشد زیر شکل به ، تابع از استفاده روش:: axis([xmin xmax ymin ymax]);axis([xmin xmax ymin ymax]); • از ما دامنه میدانیم مثال این دراز ما دامنه میدانیم مثال این در -pi-pi تاتا pipi - از ما برد و- از ما برد و۱۱تاتا۱۱را مختصات های محور میتوانیم بنابراین میکند تغییررا مختصات های محور میتوانیم بنابراین میکند تغییر کنیم تنظیم گونه بدینکنیم تنظیم گونه بدین .. • axis([-pi pi -2 2])axis([-pi pi -2 2]) • ؟ چه میکنند تغییر حدودی چه در برد و دامنه که ندانیم اگر حال؟ چه میکنند تغییر حدودی چه در برد و دامنه که ندانیم اگر حال کنیم استفاده زیر دستور همانند ترکیبی حالت یک از میتوانیم حالت این درکنیم استفاده زیر دستور همانند ترکیبی حالت یک از میتوانیم حالت این در!! • axis([min(x)-5 max(x)+5 min(y)-5 max(y)+5]);axis([min(x)-5 max(x)+5 min(y)-5 max(y)+5]); • کهکه xx و ، دامنه نقاط ماتریسو ، دامنه نقاط ماتریس yy دستورات از استفاده با که میباشد تابع مقادیر ماتریسدستورات از استفاده با که میباشد تابع مقادیر ماتریس min()min() وو max()max() میکنیم استفاده و آورده بدست را ها ماتریس این مقدار بزرگترین و کوچکترینمیکنیم استفاده و آورده بدست را ها ماتریس این مقدار بزرگترین و کوچکترین ..
- 15. MATLABMATLAB • ، ایم زده خود مربعی پالس از پریود یک تولید به دست اینجا به تا، ایم زده خود مربعی پالس از پریود یک تولید به دست اینجا به تا بیابیم را آن فوریه سری باید حالبیابیم را آن فوریه سری باید حال .. • جمع حاصل میدانیمجمع حاصل میدانیم NN از مربعی پالس فوریه سری از ضریباز مربعی پالس فوریه سری از ضریب اگر که میاید بدست زیر رابطهاگر که میاید بدست زیر رابطه N->infiniteN->infinite ،،انگاهانگاه SSNN(x)=square(x)(x)=square(x)
- 16. MATLABMATLAB میکنیم سازی پیاده متلب در را قبل صفحه رابطه حالمیکنیم سازی پیاده متلب در را قبل صفحه رابطه حال .. [4] M=20; %tedade zaryeb baraye takhmine square wave[4] M=20; %tedade zaryeb baraye takhmine square wave [5] for i=1:2:M[5] for i=1:2:M [6] sum = sum +(4/pi)*(sin(i*t) / i);[6] sum = sum +(4/pi)*(sin(i*t) / i); متغیرمتغیر MM را ، موج شکل تخمین برای فوریه سری از شده استفاده جملت تعدادرا ، موج شکل تخمین برای فوریه سری از شده استفاده جملت تعداد شدن تر زیاد با که کنیم مشاهده میتوانیم ضریب این تغییر با که ، میکنند مشخصشدن تر زیاد با که کنیم مشاهده میتوانیم ضریب این تغییر با که ، میکنند مشخص کوچکتر آن پهنای تنها بلکه ، نمیرود بین از ناپیوسگی نقطه در بالزدگی ،ضرایبکوچکتر آن پهنای تنها بلکه ، نمیرود بین از ناپیوسگی نقطه در بالزدگی ،ضرایب میشودمیشود.. حلقه یک از استفاده با انتها در وحلقه یک از استفاده با انتها در و forfor با فوریه سریبا فوریه سری MM سازی شبیه را جملهسازی شبیه را جمله میکنیممیکنیم .. ماتریس بنابراینماتریس بنابراین sumsum از استفاده با اصلی موج شکل تخمین بیانگراز استفاده با اصلی موج شکل تخمین بیانگر MM از جملهاز جمله میباشد فوریه سریمیباشد فوریه سری ..
- 17. نویسی برنامه نوع از نصیحت یکنویسی برنامه نوع از نصیحت یک .. کردن زیاد با که میبینید ، کنید اجرا را قبل برنامه اگرکردن زیاد با که میبینید ، کنید اجرا را قبل برنامه اگر MM حلقه شدن اجرا تعدادحلقه شدن اجرا تعداد forfor کند شدت به برنامه و یافته افزایشکند شدت به برنامه و یافته افزایش !برای که ای گونه به ، میشود!برای که ای گونه به ، میشود MM بود خواهید عاجز آن اجرای از که میشود کند حدی به برنامه بزرگ هایبود خواهید عاجز آن اجرای از که میشود کند حدی به برنامه بزرگ های ! ….! …. ؟ چیست آن دلیل اما؟ چیست آن دلیل اما خط شدن اجرا بار هر باخط شدن اجرا بار هر با۶۶ماتریس طول به ،ماتریس طول به ، sumsum است ای حافظه افزایش معنای به افزایش این و ، میشود افزودهاست ای حافظه افزایش معنای به افزایش این و ، میشود افزوده حافظه در آن سازی ذخیره برای کهحافظه در آن سازی ذخیره برای که RAMRAM میشود استفاده کامپیوترمیشود استفاده کامپیوتر.. خط شدن اجرا بار هر با بنابراینخط شدن اجرا بار هر با بنابراین۶۶خود این که ، میکند را بیشتر ای حافظه درخواست عامل سیستم از متلب برنامه ،خود این که ، میکند را بیشتر ای حافظه درخواست عامل سیستم از متلب برنامه ، ;از قبل که است این برنامه این سازی بهینه های راه از یکی میشود برنامه اجرای شدن کند باعث و است زمانبر عملی;از قبل که است این برنامه این سازی بهینه های راه از یکی میشود برنامه اجرای شدن کند باعث و است زمانبر عملی حلقه به شدن واردحلقه به شدن وارد forfor ماتریس برای نیاز مورد حافظهماتریس برای نیاز مورد حافظه sumsum شود داده تخصیص آن بهشود داده تخصیص آن به.. ماتریس طول میدانیمماتریس طول میدانیم sumsum طول به ماتریسی را آن است کافی بنابراین ، میباشد دامنه نقاط تعداد ی اندازه بهطول به ماتریسی را آن است کافی بنابراین ، میباشد دامنه نقاط تعداد ی اندازه به ماتریسماتریس tt ماتریس صورت به را آن که است معمول ولی ، باشد چیزی هر میتواند ماتریس های درایه ، کنیم تعریفماتریس صورت به را آن که است معمول ولی ، باشد چیزی هر میتواند ماتریس های درایه ، کنیم تعریف میکنیم اضافه نیز را خط این ، ششم خط از قبل بنابراین ، کنیم تعریف صفرمیکنیم اضافه نیز را خط این ، ششم خط از قبل بنابراین ، کنیم تعریف صفر.. sum = zeros(length(t));sum = zeros(length(t)); نیاز مورد حافظه ، اصلی برنامه اجرای از پیش کنید سعی همواره اما ، میکنید نویسی برنامه زبانی چه با نیست مهمنیاز مورد حافظه ، اصلی برنامه اجرای از پیش کنید سعی همواره اما ، میکنید نویسی برنامه زبانی چه با نیست مهم اصطلح به مموری از را خود های متغیر برایاصطلح به مموری از را خود های متغیر برای allocateallocate بیابد افزایش تان برنامه اجرای سرعت تا ، کنیدبیابد افزایش تان برنامه اجرای سرعت تا ، کنید ((باشند میتوانند برنامه سرعت کاهش اصلی عوامل از نیز تو در تو های حلقه همچنینباشند میتوانند برنامه سرعت کاهش اصلی عوامل از نیز تو در تو های حلقه همچنین.).)
- 18. MATLABMATLAB پنجری یک در را شده زده تخمین موج شکل و اصلی موج شکل کافیست حالپنجری یک در را شده زده تخمین موج شکل و اصلی موج شکل کافیست حال تابع از هم باز منظور بدین ، کنیم مقایسه هم با را دو این بتوانیم تا کنیم رسمتابع از هم باز منظور بدین ، کنیم مقایسه هم با را دو این بتوانیم تا کنیم رسم plot()plot() میکنیم استفادهمیکنیم استفاده .. تابع اجرای بار هر با اماتابع اجرای بار هر با اما plot()plot() نمیوانیم و ، داشت خواهیم جدید پنجره یک مانمیوانیم و ، داشت خواهیم جدید پنجره یک ما !؟ چیست چاره ، کنیم رسم هم روی و پنجره یک در را موج شکل دو!؟ چیست چاره ، کنیم رسم هم روی و پنجره یک در را موج شکل دو اجرای از پس از میتوانیماجرای از پس از میتوانیم plot()plot() دستور از ، اولدستور از ، اول ““hold on”hold on” ، کنیم استفاده، کنیم استفاده که میگوید متلب به دستور اینکه میگوید متلب به دستور این plotplot بکشد پلت همین روی نیز را بعدیبکشد پلت همین روی نیز را بعدی .. ، کنید رسم هم روی را موج شکل چندین دارید نیاز که مواقعی در بنابراین، کنید رسم هم روی را موج شکل چندین دارید نیاز که مواقعی در بنابراین هر از پس میتوانیدهر از پس میتوانید plotplot کنید استفاده دستور این ازکنید استفاده دستور این از .. میکنیم کامل را برنامه حالمیکنیم کامل را برنامه حال ..
- 19. Final CodeFinal Code n = 1000; % tedade noghate square waven = 1000; % tedade noghate square wave t = linspace(-pi,pi,n); % tolide n noghte dar bazeye (-pi,pi)t = linspace(-pi,pi,n); % tolide n noghte dar bazeye (-pi,pi) y = sign(t); % va tolide step wavey = sign(t); % va tolide step wave M =30;M =30; sum = zeros(1,length(t));sum = zeros(1,length(t)); for i = 1:2:Mfor i = 1:2:M sum = sum + (pi/2.5)*(sin(i*t)/i);sum = sum + (pi/2.5)*(sin(i*t)/i); endend %Start Plotting%Start Plotting plot(t,y,'LineWidth',1.2);plot(t,y,'LineWidth',1.2); hold on;hold on; plot(t,sum,'r','LineWidth',1.5); %'r' stands for the color redplot(t,sum,'r','LineWidth',1.5); %'r' stands for the color red %Initializing the Figure Window%Initializing the Figure Window axis([-2*pi 2*pi -1.5 1.5]); %modifing axis' limitsaxis([-2*pi 2*pi -1.5 1.5]); %modifing axis' limits thetitle = ['Coefficient = ' num2str(M)];thetitle = ['Coefficient = ' num2str(M)]; title(thetitle);%set the tile of our figuretitle(thetitle);%set the tile of our figure
- 20. تابع توسط شده رسم های نمودار برای عنوان تنظیمتابع توسط شده رسم های نمودار برای عنوان تنظیم PLOTPLOT • ، بگذارید نیز ،عنوان اید کرده رسم که نموداری برای میخواهد کنید فرض، بگذارید نیز ،عنوان اید کرده رسم که نموداری برای میخواهد کنید فرض تابع از استفاده با را کار این میتوانیدتابع از استفاده با را کار این میتوانید title()title() تابع از پستابع از پس plotplot استفادهاستفاده کنیدکنید .. • عنوان به را عدد و رشته از ترکیبی میخواستیم اینجا در ماعنوان به را عدد و رشته از ترکیبی میخواستیم اینجا در ما titletitle انتخابانتخاب عدد باید ابتدا ترتیب بدین ، کنیمعدد باید ابتدا ترتیب بدین ، کنیم MM آوریم در رشته حالت به راآوریم در رشته حالت به را.. • از میتوانید ، کاراکتری یا رشته حالت به عددی فرمت هر تبدیل برای ایناز میتوانید ، کاراکتری یا رشته حالت به عددی فرمت هر تبدیل برای این تابعتابع num2str()num2str() کنید استفادهکنید استفاده.. • ؟ بچسبانیم هم به را نظر مورد رشته دو چگونه حال؟ بچسبانیم هم به را نظر مورد رشته دو چگونه حال • و اول عبارت را آن اول درایه و کرده تعریف جدید ماتریس یک میتوانیمو اول عبارت را آن اول درایه و کرده تعریف جدید ماتریس یک میتوانیم …تابع به را ماتریس این سپس و بگذاریم و دوم عبارت را آن دوم درایه…تابع به را ماتریس این سپس و بگذاریم و دوم عبارت را آن دوم درایه title()title() بدهیمبدهیم ..
- 21. سازی شبیه نتایجسازی شبیه نتایج
- 22. سازی شبیه نتایجسازی شبیه نتایج
- 23. سازی شبیه نتایجسازی شبیه نتایج
- 24. سازی شبیه نتایجسازی شبیه نتایج
- 25. سازی شبیه نتایجسازی شبیه نتایج
- 26. تحلیلتحلیل • بالزدگی پهنای تنها ضرایب تعداد افزایش با میبینید که همانطوربالزدگی پهنای تنها ضرایب تعداد افزایش با میبینید که همانطور ندارد تاثیری آن دامنه در ولی ، میشود کمندارد تاثیری آن دامنه در ولی ، میشود کم .. • تخمین برای را فوریه سری جملت از تعداد چه نیست مهمتخمین برای را فوریه سری جملت از تعداد چه نیست مهم شکل به ، باشد بیشتر آنها تعداد چه هر آنکه با ، کنیم استفادهشکل به ، باشد بیشتر آنها تعداد چه هر آنکه با ، کنیم استفاده ندارد بالزدگی دامنه در تاثیری اما ، میشود تر شبیه اصلی سیگنالندارد بالزدگی دامنه در تاثیری اما ، میشود تر شبیه اصلی سیگنال .. • و پیوسته زمان های سیگنال ناپیوستگی نقاط در که پدیده این بهو پیوسته زمان های سیگنال ناپیوستگی نقاط در که پدیده این به اغلب پدیده این ، میگوییم گیبس پدیده ، افتد می اتفاق پریودیکاغلب پدیده این ، میگوییم گیبس پدیده ، افتد می اتفاق پریودیک است نامطلوب اوقاتاست نامطلوب اوقات
- 27. ریاضیات چاشنی با گیبس پدیدهریاضیات چاشنی با گیبس پدیده .. از محدودی تعداد جمع بوسیله ناپیوسته تابع یک تخمین در ریاضی ذاتی توانایی عدم بیانگر پدیده این واقع دراز محدودی تعداد جمع بوسیله ناپیوسته تابع یک تخمین در ریاضی ذاتی توانایی عدم بیانگر پدیده این واقع در میباشد پیوسته های کسینوسی و ها سینوسیمیباشد پیوسته های کسینوسی و ها سینوسی .. میزان ،توسط بینهایت در تابع یک فوریه سری ضرایب میرایی ، که کرد توجیه نیز قاعده این با میتوان را گیبس پدیدهمیزان ،توسط بینهایت در تابع یک فوریه سری ضرایب میرایی ، که کرد توجیه نیز قاعده این با میتوان را گیبس پدیده میشود کنترل تابع آن همواریمیشود کنترل تابع آن همواری. (Smoothness) .. (Smoothness) . این که میشوند میرا سرعت به ، ها هارمونیک ضرایب که میبینیم کنیم مشاهده را هموار بسیار توابع فوریه سری اگراین که میشوند میرا سرعت به ، ها هارمونیک ضرایب که میبینیم کنیم مشاهده را هموار بسیار توابع فوریه سری اگر شد خواهد همگرا اصلی تابع به زودتر فوریه سری که است معنی بدین خودشد خواهد همگرا اصلی تابع به زودتر فوریه سری که است معنی بدین خود .. ( )قضه این که ، شد خواهند میرا کمتری بسیار سرعت با فوریه سری ضرایب ، مربعی تابع همانند ناپیوسته توابع در اما( )قضه این که ، شد خواهند میرا کمتری بسیار سرعت با فوریه سری ضرایب ، مربعی تابع همانند ناپیوسته توابع در اما شود همگرا اصلی موج شکل به دیرتر بسیار فوریه سری تا میشود باعث خود نوبه بهشود همگرا اصلی موج شکل به دیرتر بسیار فوریه سری تا میشود باعث خود نوبه به.. بودند شکل بدین فوریه سری ضرایب ، مربعی موج شکل در مثال عنوان بهبودند شکل بدین فوریه سری ضرایب ، مربعی موج شکل در مثال عنوان به 11- ,- ,1/31/3,,1/51/5- ,- ,1/71/7 ,…,… میباشد ریاضیات در هارمونیک سری همانند ، سری این میبینیم که همانطورمیباشد ریاضیات در هارمونیک سری همانند ، سری این میبینیم که همانطور(Harmonic series)(Harmonic series) میرایی سرعت ومیرایی سرعت و نمیباشد همگرا کامل طور به سری این که میباشد هارمونیک سری میرایی سرعت همان به نیز آننمیباشد همگرا کامل طور به سری این که میباشد هارمونیک سری میرایی سرعت همان به نیز آن !! صورت به همگرایی آنگاه ، باشند مطلق همگرای فوریه سری ضرایب اگر که بگوییم طور این میتوانیم ادامه درصورت به همگرایی آنگاه ، باشند مطلق همگرای فوریه سری ضرایب اگر که بگوییم طور این میتوانیم ادامه در در همگرایی عدم باعث نمیتواند آنها از حاصل فوریه سری که معناست بدین خود این که ، میدهند نتیجه را یکنواختدر همگرایی عدم باعث نمیتواند آنها از حاصل فوریه سری که معناست بدین خود این که ، میدهند نتیجه را یکنواخت هایی بالزدگی بنابراین ، همگراست اصلی موج شکل به فوریه سری نقاط تمام در یعنی ، شوند تابع نقاط برخیهایی بالزدگی بنابراین ، همگراست اصلی موج شکل به فوریه سری نقاط تمام در یعنی ، شوند تابع نقاط برخی بیاورند وجود به نمیتوانند را گیبس پدیده همانندبیاورند وجود به نمیتوانند را گیبس پدیده همانند .. مطلق طور به ای فوریه سری ضرایب ، ناپیوسته تابع یک که است ممکن غیر که بگوییم میتوانیم ، استدلل همین بامطلق طور به ای فوریه سری ضرایب ، ناپیوسته تابع یک که است ممکن غیر که بگوییم میتوانیم ، استدلل همین با )و سینوسی پیوسته توابع حدی مجموع صورت به میتوان را تابع این صورت این در زیرا ، باشد داشته همگرا)و سینوسی پیوسته توابع حدی مجموع صورت به میتوان را تابع این صورت این در زیرا ، باشد داشته همگرا (تناقض یعنی این و ، باشد پیوسته نیز اصلی تابع باید که است معنی بدین خود این که نوشته کسینوسی(تناقض یعنی این و ، باشد پیوسته نیز اصلی تابع باید که است معنی بدین خود این که نوشته کسینوسی ! .! .
- 28. بر مروربر مرور MATLABMATLAB تعداد که بنویسیم تابع یک صورت به را برنامه این میخواهیم کنید فرضتعداد که بنویسیم تابع یک صورت به را برنامه این میخواهیم کنید فرض شده زده تخمین موج شکل و فوریه ،تبدیل ارور تابع و گرفته ما از را ضرایبشده زده تخمین موج شکل و فوریه ،تبدیل ارور تابع و گرفته ما از را ضرایب کند رسم راکند رسم را .. کنیم تعریف آرگومان عنوان به ورودی یک با جدید تابعی کافیست منظور بدینکنیم تعریف آرگومان عنوان به ورودی یک با جدید تابعی کافیست منظور بدین کنیم استفاده فوریه سری ضرایب تعداد عنوان به را آرگومان آن و ،کنیم استفاده فوریه سری ضرایب تعداد عنوان به را آرگومان آن و ،.. نام با نهایی فایل کهنام با نهایی فایل که gibbs.mgibbs.m سامانه درسامانه در ivutivut است شده ذخیرهاست شده ذخیره .. تابع فایل توسط تولیدی نتایج میتوانید ادامه درتابع فایل توسط تولیدی نتایج میتوانید ادامه در gibbsgibbs فایل در آن کد کهفایل در آن کد که gibbs.mgibbs.m کنید مشاهده را است آمده میباشدکنید مشاهده را است آمده میباشد استفاده جملت تعداد بر کردن اضافه با کرد خواهید مشاهده که همانطوراستفاده جملت تعداد بر کردن اضافه با کرد خواهید مشاهده که همانطور نقطه در که ما ارور ، شدهنقطه در که ما ارور ، شده t=0t=0 صفر هیچگاه ولی ، میشود کمتر میافتد اتفاقصفر هیچگاه ولی ، میشود کمتر میافتد اتفاق )بدین پهنا کاهش میشود کمتر آن پهنای و میشود جابجا تنها بلکه ، نمیشود)بدین پهنا کاهش میشود کمتر آن پهنای و میشود جابجا تنها بلکه ، نمیشود و نزدیک ناپیوستگی نقطه به جملت افزایش با بالزدگی این که است معنیو نزدیک ناپیوستگی نقطه به جملت افزایش با بالزدگی این که است معنی میشود نزدیکترمیشود نزدیکتر !)!)
- 34. خوبهی شاهینخوبهی شاهینshahin.khobahi@gmail.comshahin.khobahi@gmail.com ““Logic will get you from A to Z; imaginationLogic will get you from A to Z; imagination will get you everywhere.”will get you everywhere.” ––Albert EinsteinAlbert Einstein TheThe EndEnd