SlideShare a Scribd company logo
1 of 175
APRIL 22, 2013, 11:23 P.M. After a hectic day, an exhausted
Tim Cook is arriving back at Apple’s headquar-
ters in Cupertino, California. The Apple CEO is trying to find
some quiet time to look over the day’s events and
handle some e-mails. Having joined Apple in 1998 as Senior
Vice President of Worldwide Operations, Cook had
been appointed CEO based on the recommendation of Steve
Jobs, who lost his battle with cancer a few weeks
after resigning from the top spot in August 2011. Cook had been
filling in as CEO while Jobs had been on medical
leave. Cook was a low-profile, but high-impact executive at
Apple who was responsible for restructuring Apple’s
supply chain, which had allowed Jobs to focus on high-profile
product launches. Moreover, Apple’s now super-
efficient supply chain also increased its profitability
tremendously.
Steve Jobs had led Apple through a period of innovation that
saw the introduction of category-defining prod-
ucts such as the iPod, iPhone, and iPad and disruptive business
models complementary to those products, such
as the Apple Retail Store and the iTunes online store. iTunes
had started by selling music for Apple’s iPods and
later expanded into books, movies, television shows, and
applications for all of Apple’s iOS devices. Apple’s
competitive advantage under Jobs was the ability to continually
innovate, but Cook couldn’t help but wonder if
such success was sustainable, especially without Jobs.
Just the previous September, to great fanfare and expectations,
Apple had launched the new iPhone 5. In his
presentation to an exuberant crowd of loyal Apple devotees in
San Francisco’s Moscone Center that day, Cook
had highlighted Apple’s great performance by focusing on its
retail stores and the sales of Mac notebooks and
iPads. In particular, Cook had emphasized the performance of
Apple’s 380 retail stores in 12 countries around the
world. 1 An astounding 83 million people had visited Apple
retail stores in the preceding quarter, which equates to
almost one million people a day, on average. In addition, he had
stated that Apple ranked number one in notebook
sales in the United States, with 27 percent market share. That
represented a notebook sales growth of 15 percent a
year. Cook had also commented on the iPad, crediting it with
creating a post-PC revolution. Having sold
17 million iPads between April and June 2012, Apple claimed
68 percent market share in tablet computers. In
addition, the iPad accounted for 91 percent of web traffic by all
tablets, which Cook attributed to the then over
700,000 iOS applications (apps) available to Apple users. A
whopping 94 percent of Fortune 100 companies had
begun deploying Apple iPads in the workplace, many with
customized apps to provide enterprise-specific busi-
ness solutions. “To put this achievement in some perspective,
we sold more iPads than any PC manufacturer sold
of their entire PC lineup,” Cook said. 2 By June 2012, Apple
had sold a total of 84 million iPads, a product that had
been introduced less than 2.5 years prior.
On August 20, 2012, Apple’s stock market valuation reached
$623 billion, making it the most valuable public
company of all time. The company’s value would peak in mid-
September at over $650 billion. Signs of trouble
soon emerged, however, and Apple’s stock price started to fall.
Though the iPhone 5 launch was successful, ana-
lysts were able to see Apple’s competitors gaining parity. Also,
despite Apple’s victory over Samsung in court over
patent infringements, Samsung was outselling Apple in
smartphones for the year 2012 and had proven that its
Galaxy S3, which ran Google’s Android operating system, was a
viable substitute for the popular Apple iPhone 5.
0 0 7 7 6 4 5 0 6 5
Apple (in 2013): How to Sustain a Competitive Advantage?
F R A N K T. ROT H A E R M E L
Professor Frank T. Rothaermel prepared this case from public
sources. The author is indebted to Research Associate Alicia
Ellberger (GT MBA ’10) for her con-
tributions to an earlier version of this case and Professor Erin
Zimmer and Justin Collins (GT MBA ’14) for their
contributions to the current version. This case
is developed for the purpose of class discussion. It is not
intended to be used for any kind of endorsement, source of data,
or depiction of efficient or inefficient
management. All opinions expressed, and all errors and
omissions, are entirely the author’s. © by Rothaermel, 2015.
rot45065_cases19_01-32.indd 1 12/24/13 10:00 PM
MH0019
This document is authorized for use only by Deborah Melvin in
MGMT-6990-1/WMBA-6990-1/WMBA-6990B-1-Capstone2020
Spring Sem 01/06-04/26-PT2 at Laureate Education - Walden
University, 2020.
2
Apple (in 2013): How to Sustain a Competitive Advantage?
As Cook sat down at his desk, he wondered what the
company’s next move should be, given the increasingly
competitive marketplace for its products. The current company
value was $370 billion. (See Exhibit 1 for a look
at how fast Apple’s value had declined in recent months.) Steve
Jobs had always looked for the “next big thing”
despite how successful past ideas had been. Cook wondered if
Apple would be able to sustain its competitive
advantage or if Apple’s time had passed.
The Creation of Apple, Inc.
In 1976, Steve Jobs and Steve Wozniak conceived the idea of a
personal computer company and founded Apple
Computer, Inc. (The word Computer was dropped in 2007 to
reflect Apple’s expansion from the personal com-
puter market to consumer electronics in general. 3 ) Only 21
years of age, Jobs had to sell his Volkswagen to get
money to start the company. Jobs and Wozniak, then 26, began
to assemble personal computers in Jobs’ garage
with a small group of friends. Soon after, they received
additional financing to spur the growth of the company.
In 1978, the Apple II, the first personal computer, was launched
and sold for $666.66. 4 In December of that same
year, Apple launched a successful IPO, making it a publicly
traded company.
By 1980, Apple had released three improved versions of the
personal computer, and Jobs and Wozniak had
become multimillionaires. Then, IBM entered the personal
computer market in 1981 and quickly became a seri-
ous competitor. IBM’s open architecture was easily imitable by
other manufacturers and soon became the industry
standard, giving rise to many more computer companies in the
United States (e.g., Compaq and Dell), as well as
in Taiwan, Korea, and other Asian countries. Even more
threatening was the consortium between IBM, which spe-
cialized in the development of computer hardware; the newly
formed Microsoft with its DOS operating system;
and Intel with its expertise in memory and processors. By 1982,
IBM had increased its profitability and market
share substantially, and Apple’s position was under attack.
“OBSESSED WITH DESIGN”
Nonetheless, in just over 10 years Apple had grown into a $2
billion company with over 4,000 employ-
ees. 5 In 1984, Apple introduced its finest creation yet: the
Macintosh. Jobs’ curiosity and intuition had led
him to become fixated on design and style. This passion began
when Jobs dropped out of Reed College at
the youthful age of 17. “The minute I dropped out, I could stop
taking the required classes that didn’t inter-
est me, and begin dropping in on the ones that looked
interesting,” Jobs remembered. 6 He decided to take
a calligraphy class to learn about serif and sans serif typefaces
and what makes great typography: “It was
beautiful, historical, artistically subtle in a way that science
can’t capture, and I found it fascinating. None
of this had even a hope of any practical application in my life.
But 10 years later, when we were designing
the first Macintosh computer, it all came back to me. And we
designed it all into the Mac. It was the first
computer with beautiful typography.” 7 Jobs firmly believed
that if he had not dropped out of college and into
that calligraphy class, the Mac would never have had multiple
typefaces and proportionally spaced fonts.
And, “since Windows just copied the Mac, it’s likely that no
personal computer would have them,” if he had
not made that decision. 8
Although the Macintosh was the first personal computer
applauded for unique industrial design and ease of
use, it had a slower processor than IBM PCs and their clones,
and very few compatible software programs due
to Apple’s closed proprietary operating system. As a result, the
Mac was gradually pushed to the periphery as a
niche player with customers mainly in education and graphic
design. Apple’s integrated value chain enabled the
company to produce computers of high quality, but placed the
Macintosh at a price disadvantage as the growing
consumer technology industry became increasingly
commoditized.
rot45065_cases19_01-32.indd 2 12/24/13 10:00 PM
This document is authorized for use only by Deborah Melvin in
MGMT-6990-1/WMBA-6990-1/WMBA-6990B-1-Capstone2020
Spring Sem 01/06-04/26-PT2 at Laureate Education - Walden
University, 2020.
Apple (in 2013): How to Sustain a Competitive Advantage?
3
NEW MARKETING GURU
In 1983, Jobs decided to bring in John Sculley to run the
company with him. At the time, Sculley was a market-
ing guru from Pepsi whom Jobs “thought was very talented.” 9
Sculley was responsible for the “Pepsi Challenge”
and “Pepsi Generation” ad campaigns that helped Pepsi overtake
Coca-Cola in market share for the first time
in the history of the “Cola Wars.” He had also turned around
PepsiCo’s failing food division by bringing in new
management, improving product quality, and instituting new
accounting and financial controls. 10
Apple’s innovative advertising tale started on January 22,
1984. During the third quarter of the Super Bowl
that year, “one of the most famous television commercials of all
time” was broadcast. 11 The ad was based on
the dystopian society depicted by George Orwell in his novel
1984. Hundreds of identical drones were shown
listening to their larger-than-life dictator, whose black-and-
white face was projected onto a screen in the middle
of the room. Suddenly, a beautiful woman, escaping capture
from armed guards, threw a hammer at the screen
which exploded in a Technicolor display of dazzling light. The
ad stated, “On January 24th, Apple Computer
will introduce Macintosh. And you’ll see why 1984 won’t be
like 1984. ” 12 In this fashion, customers were
introduced to Apple as the revolutionary, subversive, and
rebellious company of the 1980s, ready to take on the
tyrant of IBM.
For a while after John Sculley joined Apple, things went well.
But Jobs later recalled that “our visions of
the future began to diverge and eventually we had a falling
out.” 13 Apple’s core identity changed with Sculley
in charge. The business strategy shifted from differentiation
based on a premium product with a high price tag
to producing a low-cost product with mass-market appeal.
Sculley’s new ambition for Apple was to compete
directly with IBM in the household-computer market. Apple
worked on bringing down the cost of manufacturing
and formed alliances with Intel, Novell, and even its old
nemesis, IBM. At the same time, Apple moved toward
desktop publishing, multimedia, and peripherals. However, a
series of major product flops, missed deadlines, and
unrealistic earnings forecasts destroyed Apple’s reputation. As
a consequence, Apple’s profitability continued on a
downward slope. With dismal sales and declining net income, a
power struggle erupted between Jobs and Sculley,
who eventually succeeded in convincing Apple’s board of
directors to throw Jobs out of Apple in 1985.
HARD TIMES
To add insult to injury, Microsoft released its graphical user
interface (GUI)–based operating system, Windows
3.0, in 1990, effectively cementing the Wintel standard with 90
percent market share in the PC industry. Wintel
represented the powerful combination of a Windows operating
system running on the x86 architecture chips made
by Intel. Today, the x86 architecture is ubiquitous among
computers, and a large amount of software supports
the platform, including operating systems such as MS-DOS,
Windows, Linux, BSD, Solaris, and Mac OS X. The
innovator Apple had become a non-factor in the PC industry,
retreating to ever-smaller niches of the market.
In June 1993, leadership changed hands again from Sculley to
Michael Spindler. Spindler continued the com-
pany’s focus on cost-cutting but also made international growth
a main objective. By 1995, Apple was spreading
itself too thin across product lines and geographic markets. It
had lost any strategic focus and could not stop
operating in the red.
Steve Jobs Returns
During this time, Jobs was starting over. “What had been the
focus of my entire adult life was gone, and it was
devastating.” 14 Jobs had been fired very publicly from a
company he had helped to create, and even considered
leaving Silicon Valley for good. He later reminisced, “I didn’t
see it then, but it turned out that getting fired from
rot45065_cases19_01-32.indd 3 12/24/13 10:00 PM
This document is authorized for use only by Deborah Melvin in
MGMT-6990-1/WMBA-6990-1/WMBA-6990B-1-Capstone2020
Spring Sem 01/06-04/26-PT2 at Laureate Education - Walden
University, 2020.
4
Apple (in 2013): How to Sustain a Competitive Advantage?
Apple was the best thing that could have ever happened to me.
The heaviness of being successful was replaced
by the lightness of being a beginner again. . . . It freed me to
enter one of the most creative periods of my life.” 15
In 1986 Jobs invested $10 million in Pixar Animation Studios.
16 Since then, Pixar has earned 12 Academy
Awards, 6 Golden Globes, and 11 Grammys, among many other
awards. Pixar created the world’s first com-
pletely computer-animated feature film, Toy Story, and is now
the most successful animation studio in the
world, with films like Toy Story 2 and 3, Monsters Inc., Cars,
Finding Nemo, The Incredibles, WALL-E, Up,
and Brave.
In 2006, Disney bought Pixar for $7.4 billion in a deal that also
landed Jobs a seat on Disney’s board of
directors. “The addition of Pixar significantly enhances Disney
animation, which is a critical creative engine
for driving growth across our businesses,” Disney CEO Robert
Iger stated. 17 Jobs, the majority shareholder of
Pixar at the time with 50.1 percent, became Disney’s largest
individual shareholder with 7 percent. 18 His hold-
ings greatly exceeded those of the previous top shareholder of
Disney, ex-CEO Michael Eisner, who owned 1.7
percent, and even Disney’s Director Emeritus Roy E. Disney,
who owned less than 1 percent of the corporation’s
shares.
Just one year prior to starting Pixar, Jobs had founded a
computer company called NeXT, Inc., later known
as NeXTSoftware, Inc. NeXT developed one of the first
enterprise web application frameworks for the higher-
education and business markets. In a bizarre twist of fate, Apple
purchased NeXT on December 20, 1996, for
$429 million. 19
Earlier in 1996, Gilbert Amelio had replaced Spindler as CEO
of Apple, which was reporting a mere
$69 million in first-quarter revenues. Amelio’s intention was to
revive Apple’s former strategy by focusing again
on the premium-product market segment. Amelio made many
changes at Apple, including terminating the IBM
alliance and announcing massive layoffs of 30 percent of the
company’s total work force of 13,400. 20 With the
acquisition of NeXT, Amelio also brought Jobs back as a part-
time adviser to Apple. Despite all these measures,
Apple’s market share continued to tumble to just 3 percent
worldwide. 21
Apple experienced its worst year ever in 1997 and subsequently
ousted Amelio due to crippling financial losses
and a low stock price. Jobs was brought back as interim CEO in
September of that same year. Thereafter, Steve
Jobs succeeded in orchestrating one of the greatest corporate
comebacks in modern-day history. (See Exhibits 2
and 3 for financial performance data.)
Restructuring Apple
When Steve Jobs returned to Apple in 1997, he was ready and
eager to shake things up. In a meeting with
Apple’s top executives, after hearing all their explanations as to
why Apple was performing poorly, Jobs infa-
mously roared: “The products SUCK! There’s no SEX in them
anymore!” 22 Jobs swiftly refocused the company
that he had helped start and discontinued several products such
as the Newton PDA, the LaserWriter printer line,
and the Apple QuickTake camera—all now collector items for
Apple enthusiasts.
During this time of restructuring, Jobs outsourced
manufacturing to Taiwan and scaled down the distribu-
tion system by ending relationships with smaller outlets. With
Jobs’ savvy insight for what consumers wanted,
he launched a new, revolutionary website to sell Apple products
directly to customers online. For the first time
ever, he also opened Apple retail stores, tied to his build-to-
order manufacturing strategy. Although these moves
seemed risky at the time, all of these operational improvements
helped to boost previously declining sales. For the
first time in five years (since 1993), Apple once again became
profitable.
Jobs also realized the necessity of making Apple’s operating
system more accessible for software providers. He
switched everything to the open-source, UNIX-based operating
system, Mac OS X. This proved to be a more stable
rot45065_cases19_01-32.indd 4 12/24/13 10:00 PM
This document is authorized for use only by Deborah Melvin in
MGMT-6990-1/WMBA-6990-1/WMBA-6990B-1-Capstone2020
Spring Sem 01/06-04/26-PT2 at Laureate Education - Walden
University, 2020.
Apple (in 2013): How to Sustain a Competitive Advantage?
5
operating environment and permitted the company to issue
annual upgrades in response to customer feedback. In
2005, Apple completed this transition by switching from
PowerPC to Intel processors, which meant that Apple
Computers could run not only the Mac OS X but also any
operating systems that used the x86 architecture. This
marked the beginning of a truly open era for Apple computers:
They were now the most flexible, as well as the most
attractive. As a result, Apple’s stock price rose from $6 in 2003
to over $80 in 2006, surpassing even Dell’s market cap,
the then-number-one computer maker in the U.S. 23 Dell’s
CEO, Michael Dell, was left retracting the words he had
very publicly spat nine years prior, “If I ran Apple, I would shut
it down and give the money back to shareholders.” 24
Jobs even formed an alliance with Apple’s archrival Microsoft
to release new versions of Microsoft Office for
the Macintosh. In return, Microsoft made a $150 million
investment in non-voting Apple stock. 25 Jobs, in a cell
phone call with Gates said, “Bill, thank you. The world is a
better place.” 26
Beyond changing the operating system, the most visible change
Jobs instituted was leveraging industrial design
to produce more aesthetically pleasing computers. Jobs almost
instantly revitalized Apple’s image by pushing the
limits of technology and design. He appointed Jonathan Ive, a
British designer, head of Apple’s in-house Industrial
Design group (IDg). There have been several distinct design
themes in Jobs and Ive’s collaboration over the years:
translucency, colors, minimalism, and dark aluminum. Ive has
been credited with being the chief designer of the
iMac, the aluminum and titanium PowerBook G4, the MacBook,
unibody MacBook Pro, iPod, iPhone, and the
iPad. 27 Ive’s work at Apple has won him a slew of awards
and widespread recognition.
Jobs also started to brand Apple as a functionally appealing,
hip alternative to other dull, clone-like comput-
ers in the market. Known for his candor, Steve Jobs once
accused Michael Dell of making “un-innovative beige
boxes.” 28 Continuing in the same vein as the infamous 1984
television ad, Apple launched its “Think Different”
campaign in 1997. The aim of the campaign was to reflect the
culture of Apple, comprised of great people who
think differently. The television advertisements featured major
artists, scientists, and politicians who were seen as
independent thinkers, including Albert Einstein, Martin Luther
King, Jr., John Lennon, Thomas Edison, Amelia
Earhart, Alfred Hitchcock, Pablo Picasso, and Jerry Seinfeld.
Similarly, Apple’s print advertisements had less to
do with specific products, and everything to do with company
image. They simply featured a portrait of one of
the historic figures and a small Apple logo with the words
“Think Different” in the bottom corner. In 2002, Apple
launched the “Switch” advertising campaign, which showed
various celebrities and non-celebrities talking about
the reasons they switched from Windows computers to Apple
computers. The “I’m a Mac, I’m a PC” commercials
in the last half of the decade, which featured young actor Justin
Long as a “Mac” and a middle-aged man (comic
John Hodgman) in a suit as a “PC,” helped to fortify the image
of the Mac as young and hip and the PC as only
suitable for business and not the creative needs of the younger
generation. As a result of these efforts, Apple’s
stock price experienced unprecedented growth compared to the
NASDAQ 100 index (see Exhibit 4 ). And this
growth continued with Cook at the helm (see Exhibit 5 ). Cook
had been Chief Operating Officer at Apple before
becoming CEO. With an MBA from Duke University and a BS
in Industrial Engineering from Auburn University,
Tim’s personality contrasted starkly with Jobs’; he displayed no
ego and was much happier out of the limelight.
However, there was a sharp increase in the value of Apple’s
stock from when Cook took over as CEO until its peak
in September of 2012. At its height in 2012, Apple’s stock price
enjoyed a 9,000 percent premium over the index.
It rose from $375 a share in August 2011 to $700 a share in
September 2012 (see Exhibit 6 ).
Apple’s Culture
As early as 1983, Steve Jobs coined the following motto at an
offsite retreat: “It’s better to be a pirate than join
the navy.” 29 Jobs’ Macintosh team had only 80 employees at
the time, but already he sensed that they were devel-
oping the group-think mentality that he detested. In response to
“Captain” Jobs’ cry, programmers Steve Capps
and Susan Kare painted a rainbow-colored Apple eye patch onto
a pirate flag and hung it above the Macintosh
building. This iconic image became illustrative of Apple’s
unique corporate culture and also symbolic of Apple’s
first inspired slogan in the late 1970s, “Byte into an Apple.”
rot45065_cases19_01-32.indd 5 12/24/13 10:00 PM
This document is authorized for use only by Deborah Melvin in
MGMT-6990-1/WMBA-6990-1/WMBA-6990B-1-Capstone2020
Spring Sem 01/06-04/26-PT2 at Laureate Education - Walden
University, 2020.
6
Apple (in 2013): How to Sustain a Competitive Advantage?
According to its website, working at Apple was “less of a job,
more of a calling.” 30 Apple looked for employees
who were on a mission to “change the world” and create “some
of the best-loved technology on the planet.” 31
Apple promoted itself to prospective candidates as “a whole
different thing” with “corporate jobs without the
corporate part.” 32 Apple looked for people who were “smart,
creative, up for any challenge, and incredibly excited
about what they do. In other words, Apple people. You know,
the kind of people you’d want to hang around with
anyway.” 33 From the start, Steve Jobs had been more than
instrumental in developing Apple’s envied corporate
culture. Employees typically worked 60 to 70 hours a week, and
no one complained.
Apple has been thought of as putting Silicon Valley on the map
with its hard-working but relaxed, casual
atmosphere. 34 This characterization would be an impossible
contradiction in most other corporations in the
United States, but not at Apple. When Jobs returned to Apple in
1997, he became famous for his standard
black turtleneck and jeans uniform, walking around the campus
with, or sometimes without, his sneakers. Jobs
even went barefoot to a 1999 meeting to settle a patent dispute
with executives from Microsoft. 35 Jobs was the
ultimate example of an “I’m-a-genius-and-I-don’t-care”
attitude. Apple employees embraced their hero and
became convinced that, with confidence and creativity, they too
could become rich and leave a legacy—sans
suit or shoes.
Apple’s rebel spirit not only attracted a long-lasting
appreciation from loyal employees but also created an
almost cult-like following among customers who appreciated
Apple’s propensity to think differently. Millions
of people wanted to be seen as unique individuals, and hence,
millions of people bought Apple products. The
“Cult of Apple” was a group of rumored fanatical followers
devoted to all things Apple, but “while there are
many customers who eat, think, and breathe Apple, members of
the Cult of Apple take their devotion one
step further and believe in Apple.” 36 The result was that
Apple had a conspicuous horde-like following walk-
ing down the streets of every major city in the world with the
signature white ear buds of Apple products
attached to their heads. Apple products became so trendy that
other companies had to design their consumer
electronics like Apple’s to have a hope of selling. The loyalty
of Apple customers has served the company
well, and now it is not just the die-hard fanatics who believe.
Even people in the mainstream were becoming
Apple converts.
Innovation at Apple
The one competency that kept Apple on the cutting edge, all
the way from startup to survival to success—and
finally to profitability and industry envy—has been innovation.
“Innovation distinguishes between a leader and a
follower,” Jobs repeatedly said. 37 Jobs believed that
innovation is a process that can be cultivated and managed
within an organization. It begins with idea generation, and then
moves to idea adoption and development, and
finally to idea implementation. All the while, the innovation
process is being enabled by effective leadership and a
supportive organizational culture.
Steve Jobs firmly believed that Apple could create major
innovation breakthroughs that would reshape future
industries. Jobs’ attitude toward innovation as key to a
successful strategy and competitive advantage was revealed
in an interview that UCLA professor Richard Rumelt conducted
shortly after Jobs returned to Apple in 1998:
“I was interested in what Steve Jobs might say about the future
of Apple. His survival strategy for Apple, for all its skill
and drama, was not going to propel Apple into the future. At
that moment in time, Apple had less than 4 percent of the
personal computer market. The de facto standard was Windows-
Intel and there seemed to be no way for Apple to do
more than just hang on to a tiny niche. I said, ‘Steve, this
turnaround at Apple has been impressive. But everything we
know about the PC business says that Apple cannot really push
beyond a small niche position. The network effects are
just too strong to upset the Wintel standard. So what are you
going to do in the longer term? What is your strategy?’
“[Steve Jobs] did not attack my argument. He didn’t agree with
it either. He just smiled and said, ‘I’m going to wait
for the next big thing.’” 38
rot45065_cases19_01-32.indd 6 12/24/13 10:00 PM
This document is authorized for use only by Deborah Melvin in
MGMT-6990-1/WMBA-6990-1/WMBA-6990B-1-Capstone2020
Spring Sem 01/06-04/26-PT2 at Laureate Education - Walden
University, 2020.
Apple (in 2013): How to Sustain a Competitive Advantage?
7
Apple’s top management was also critical in the effort to
nurture an innovative organization because employees
needed to know that they would not be reprimanded for making
risky choices when attempting a creative project.
A high tolerance for failure and calculated risk-taking is
necessary for employees to feel comfortable bringing up
new ideas in any organization. 39 Apple’s work force
appeared to have embraced this attitude fully, as they proudly
“[said] NO to 1,000 things.” 40
Compared to its competitors, Apple spent a mere 2.24 percent
of revenues on research and development (R&D)
for a grand total of $2.4 billion in 2011 ( Exhibit 7 ). In
contrast, Microsoft spent about 12.93 percent of annual
revenues on R&D, equating to a whopping budget of $9.0
billion. Google similarly spent over 13.62 percent of
annual revenues on R&D, for a total expenditure of $5.1 billion.
Comparing the amount of money spent at Apple
with that of other technology giants shows how effectively
Apple’s innovation process works, making possible a
significant return on R&D investment. In fact, Jobs was known
to say: “Innovation has nothing to do with how
many R&D dollars you have. When Apple came up with the
Mac, IBM was spending at least 100 times more on
R&D. It’s not about money. It’s about the people you have, how
you’re led, and how much you ‘get it.’” 41
Recently, Apple is spending more on R&D; it spent $3.38
billion on R&D in 2012 and several billion the
first few months in 2013. 42 Although Apple has not made
any new product introductions in the recent past, this
increase in spending could be indicative of attempts to launch
category-defining products and services such as
those for television or smart-watches in the near future.
The iPod/iPhone/iPad Revolution and Apple TV
THE IPOD
The big bang happened at Apple in October 2001 with the
launch of the iPod, a portable digital music player
based on the MP3 music format. The sleek design and smart
graphical user interface bewitched consumers. The
product was an instant hit, selling over 100 million units within
six years. 43 The profitability of the iPod was phe-
nomenal, with margins estimated as high as 47.4 percent before
freight, marketing, and other costs. 44
In April 2003, Apple provided iTunes as a complement for the
iPod. iTunes was the first online store from
which customers could buy songs individually at 99 cents each,
rather than purchasing entire albums for upward
of $15 to $20 or downloading songs illegally. Within three days
of launch, iTunes users had downloaded one
million songs. By June 2008, iTunes had exceeded five billion
downloads. 45 On February 25, 2010, which was
coincidentally Steve Jobs’ 55th birthday, Apple achieved the
great milestone of 10 billion iTunes downloaded.
Apple had seemingly effortlessly established itself as the
newest icon of the digital age, revolutionizing the music
industry and holding fast to its leadership position in the
technology race.
In keeping with its iconoclastic reputation, Apple promoted its
iPod as a stylish alternative to archetypal music
technology products with the new “iPod People” campaign. Ads
featured several silhouetted people with white
headphones in their ears dancing against a colorful background.
Apple advertising had always been creative by
design, but its “iPod People” promotion brought in an
unmistakable “coolness-factor” as the essence of the prod-
uct. That desired attribute was directly transferred to the
customer upon purchase.
THE IPHONE
In June 2007, Apple launched the iPhone, and soon Apple’s
share price passed the $100 mark. 46 The iPhone was
a multifunction smartphone that provided the customer with a
unique touch-based interface and a revolutionary
operating system delivering a computer-based experience.
According to Jobs, the iPhone was “the Internet in your
pocket.” 47 Apple partnered with AT&T to bring this device
to the market and make it affordable for consumers.
AT&T was happy to subsidize the phones, as long as it could
ride the Apple wave of “coolness” and innovation.
rot45065_cases19_01-32.indd 7 12/24/13 10:00 PM
This document is authorized for use only by Deborah Melvin in
MGMT-6990-1/WMBA-6990-1/WMBA-6990B-1-Capstone2020
Spring Sem 01/06-04/26-PT2 at Laureate Education - Walden
University, 2020.
8
Apple (in 2013): How to Sustain a Competitive Advantage?
One year later, Apple launched the iPhone 3G, which was
advertised as twice as fast at half the price. The
iPhone 3G supported all Microsoft document formats and had
full support for a Microsoft Exchange server. Apple
sold a record six million 3G iPhones in the first year, giving
birth to a whole new generation of smartphones. In
the summer of 2010, Apple released the iPhone 4 with two
built-in cameras and higher resolutions. In that same
year, Apple had captured 17.4 percent of the smartphone
market, with 82 percent sales growth since 2008. It had
taken only two years for Apple to jump to second place behind
Nokia, with 32.7 percent market share. BlackBerry
was third with 15.3 percent. 48 The iPhone 4S, an update to
the iPhone 4 with a voice assistant known as “Siri,” was
released in October of 2011. The iPhone 5, which had a larger
screen and was the first 4G iPhone, was released
in September of 2012.
THE IPAD
On January 25, 2010, Jobs took his biggest gamble yet with the
announcement of the iPad, a multimedia,
tablet-style computer designed to take the place of a pencil and
pad of paper. 49 (See Exhibit 8 for a historical
timeline of Apple’s product introductions and net income.)
During Jobs’ keynote address introducing the iPad two
days later, he praised his new invention as the “best browsing
experience you’ve ever had. You can see the whole
page—it’s phenomenal! It’s an incredible experience.” 50
Investors apparently shared Jobs’ excitement, as Apple’s
stock price rose 15 percent after the iPad was unveiled. 51
However, the idea of a keyboard-free, touchscreen portable
computer tablet had been around for more than two
decades. Apple had even launched its own Newton MessagePad
in 1993, which became known less for its pio-
neering features and more for being ridiculed in “Doonesbury”
for the software’s problem in recognizing hand-
writing. 52 Upon returning to Apple in 1997, Jobs withdrew
the Newton, which had become a commercial failure
and a public relations embarrassment. Competitors learned from
Apple’s Newton debacle and started to introduce
improved products at a lower price, including Palm’s Pilot,
Handspring’s Visor, and BlackBerry. Meanwhile, Jobs
continuously scrapped all of Apple’s new tablet prototypes for
over a decade, because they reportedly “weren’t
good for anything except browsing the Web from the
bathroom.” 53
Apple had come a long way since the Newton, as evidenced by
the fact that its iPad was the most highly
anticipated gadget of 2010. 54 Jobs in his keynote address
stated that “the iPad is our most advanced technology
in a magical and revolutionary device at an unbelievable price.”
52 The iPad was half an inch thick, weighed 1.5
pounds, and had a 9.7-inch “gorgeous, super-high quality
display” and was “multi-touch, super-responsive, and
super-precise.” 56 It had Wi-Fi wireless connectivity and
availability to e-mail, photos, video, music, games, and
e-books, and was capable of browsing the web. It operated much
like the smaller iPhone and could run all 140,000
existing apps designed for the iPhone. Additionally, the iPad
incorporated features like a calendar, photo manager,
spreadsheets, and presentations to take on a more multimedia
look. 57
Given initial rumors that the iPad would cost anywhere from
$700 to $1,000, customers were pleasantly
surprised when it debuted at prices ranging from $499 up to
$829. Many Apple fans remembered when Jobs
famously spouted his disdain for the growing development of
the notebook market: “We don’t know how to
make a $500 computer that’s not a piece of junk.” 58
However, customers had to pay an extra $30 a month
to AT&T for the same always-on Internet access that the Kindle
provided, 59 with an option to renew their
subscription on a monthly basis. This arrangement represented a
significant departure from the wireless
industry’s traditional carrier-centered model, allowing Apple to
extract more value while carriers bore more
of the cost.
Despite pent-up demand, it was estimated that the iPad would
cannibalize the market for other Apple products,
including the iPhone, iPod, and Mac notebooks, by around 10
percent. 60 To overcome this potential threat, Jobs
would have to convince customers that they needed another
gadget, in addition to their laptops and smartphones.
Jobs believed there was room for a third category between the
laptop and smartphone, but acknowledged that “it
must do things far better than both existing devices.” Jobs
argued that if the iPad could not do some tasks better
than laptops or smartphones, it was unnecessary. 61
rot45065_cases19_01-32.indd 8 12/24/13 10:00 PM
This document is authorized for use only by Deborah Melvin in
MGMT-6990-1/WMBA-6990-1/WMBA-6990B-1-Capstone2020
Spring Sem 01/06-04/26-PT2 at Laureate Education - Walden
University, 2020.
Apple (in 2013): How to Sustain a Competitive Advantage?
9
Yet critics pointed out that, unlike the iPhone, the iPad lacked
a built-in camera for taking photos. It also lacked
the ability to play Flash-based content on websites, which
accounted for 75 percent of video on the web, and it
could run only one app on the screen at a time. While Jobs
hailed the iPad as “a dream to type on,” 62 for many it
was not as easy as a typical keyboard with tactile keys to feel.
This caused many customers to express disappoint-
ment with the iPad as doing less than the iPhone, but on a
bigger screen. 63 In March 2011, Steve Jobs, in typical
showman fashion, unveiled the iPad2, a thinner and sleeker but
higher-performing version of the original iPad.
The iPad2 also contained two cameras to facilitate online video
chat. 64
With the introduction of the iPad, Steve Jobs defined Apple as
a mobile-devices company, competing against
Sony, Samsung, and Nokia. 65 At the same time, Apple faced
direct competition from other computer manufactur-
ers, who were quick to jump on the iPad bandwagon, hoping to
undercut Apple’s price to gain market share. For
example, Hewlett-Packard announced its own keyboardless
computer called the “Slate,” and Dell, Acer, and Sony
were all refining their own versions of the tablet. In addition,
the iPad was likely to face competition from the new
mini-laptops or “netbooks” being offered by Apple’s
competitors for around $100. 66 These devices could perform
all of the necessary functions needed for most personal,
academic, and even professional needs. Nevertheless, Jobs
did not appear to be too concerned: “The problem is netbooks
aren’t better at anything—they are just cheaper.” 67
APPLE TV
In March 2007, Steve Jobs introduced the first-generation
Apple TV to the world, having referred to it more as a
“hobby” than a mainstream product. The first-generation model
was a box that connected to a user’s television set.
It allowed the user to sync and then play his or her downloaded
content from the iTunes store. The content could be
rewound or fast-forwarded, making the Apple TV the equivalent
of the modern-day satellite or cable DVR.
The newest generation of the Apple TV provides users with
more flexibility. It allows them to view content
from their iPhone, iPad, or iPod. Additionally, users can watch
movies, play music, show off their videos and
photos, and even mirror what’s on their device’s screen to enjoy
games, web pages, and more. Ultimately, Apple
TV allows users to access all of the benefits of their
complementary Apple products from their living rooms. The
latest generation model retails for $99.
The evolved product was expected to have a major impact on
the market in time for the 2012 holiday shopping
season. However, the complexity of dealing and integrating with
established broadcast cable providers and hard-
ware design and supply issues held back the new Apple TV.
Even with these holdups, Apple continues to have an
“intense interest” in television, and the company continues to
test high-definition TVs and possible partnerships
with cable companies.
Revolutionizing the Publishing Industry?
Because the iPad allowed users to read books, newspapers, and
magazines, Jobs predicted that it would reshape
the publishing business much the way his iPod revolutionized
the music industry. 68 Technophiles envisioned that the
iPad would “save the newspaper and book publishing industries,
present another way to watch television and movies,
play video games, and offer a visually rich way to enjoy the
web and the expanding world of mobile applications.” 69
Many believed that the iPad represented the next technological
innovation to replace Amazon’s Kindle and
Sony’s Reader. Jobs described how Apple would take over
Amazon’s e-book market saying: “We’re going to
stand on its shoulders and go a bit further.” 70 He started by
announcing a new online store for electronic books
called iBookstore, along with new partnerships with major book
publishers including the Hatchette Book Group,
Macmillan, Penguin Group, HarperCollins, Simon & Schuster,
and McGraw-Hill to provide e-book content for
the iPad. The only publisher that did not sign on with the iPad
was Random House. One reason it held out is that
publishers and authors would make lower revenues and royalties
per book sold.
rot45065_cases19_01-32.indd 9 12/24/13 10:00 PM
This document is authorized for use only by Deborah Melvin in
MGMT-6990-1/WMBA-6990-1/WMBA-6990B-1-Capstone2020
Spring Sem 01/06-04/26-PT2 at Laureate Education - Walden
University, 2020.
10
Apple (in 2013): How to Sustain a Competitive Advantage?
With few exceptions, the publishing industry was enthusiastic
to tap into a market of 125 million Apple cus-
tomers. “It is never wise to stand between a consumer and a
preference for how they get their content,” said John
Makinson, CEO of Penguin. 71 Moreover, publishers detested
Amazon’s pricing model, which charged Kindle
customers a standard $9.99 for each e-book, causing publishers
to lose about $5 for each e-book sold. In contrast,
the iBookstore set the maximum e-book price at the cost of
printing the book, so publishers were able to charge
anywhere from $12.99 to $14.99 for most titles. Apple retained
30 percent of the sale price and returned the
remaining 70 percent to the publishers. What publishers liked
about the iPad deal was that they (and not Apple)
got to determine the prices of e-content for end consumers. In
addition, this deal gave publishers leverage to nego-
tiate higher prices for their content with Amazon. It was even
possible that publishers would withhold titles from
Amazon if they did not agree to raise their prices. As a result,
the competition between Apple and Amazon “is as
intense a situation as the industry has ever had. . . . It’s a huge
chess match.” 72
In April of 2012, the U.S. Department of Justice brought a
lawsuit against the publishers and Apple. The
Department of Justice alleges that the publishers conspired to
fix prices by joining together to force Amazon into
the same agency business model that Apple offered to the
publishers. In the pricing model, Apple gets 30 percent
of each book sale through its iBookstore and the publisher
retains 70 percent. By forcing Amazon into the same
model, Amazon would no longer be able to offer books at the
$9.99 price point that the publishers did not want
consumers to expect as the price of a new release. Three
publishers settled with the Department of Justice but
Apple has not. 73 If found guilty of collusion, Apple could be
required to change its e-book business model.
Current Competitors
Apple’s exceptional performance, brand loyalty, and
innovation capabilities would make any CEO envious.
Also, as the industry continues to evolve, the lines between
hardware, software, and search engines have blurred
as each company vies for market share and dominance. The
following companies pose the biggest threat to Apple
and consistently seek opportunities to take market share away
from the industry giant. (See Exhibits 9 , 10 , and 11
for comparisons of Apple’s stock performance versus these
companies.)
AMAZON.COM
Amazon competes directly against Apple in the sale of
electronic media such as music, videos, and books.
Amazon also runs an Android app store and is one of the
leading providers of cloud computing services.
Founded in 1994 by Jeffrey Bezos as an online book retailer,
Amazon’s sales grew from $20,000 in 1995 to
over $61 billion in 2012 ( Exhibit 12 ). 74 After the company
went public in 1997, it rapidly diversified into multiple
product areas, undercutting existing specialty and brick-and-
mortar retailers in price. 75 In 1998, Amazon launched
its online music and video store and began to sell toys as well
as consumer electronics; it added clothing in 2002.
More recently, Amazon has engaged in a series of acquisitions
to further expand the breadth of products offered.
The firm acquired the No. 1 online shoe retailer, Zappos, for
$890 million in 2009. In 2010, Amazon added both
Woot, a social shopping e-commerce site, and Quidsi, the owner
of Diapers.com and Soap.com , to its portfolio.
By 2012, Amazon employed 51,300 people all over the world
and had climbed to No. 56 in the Fortune 500. 76
The Kindle Fire tablet product line is seen as a direct
competitor to the iPad. In January 2013, the Kindle
Fire accounted for 7.78 percent of web traffic from tablet
computers in North America compared to the iPad’s
81 percent. 77 The Kindle Fire runs Google’s Android
operating system and the Kindle Fire HD was announced in
September 2012 and comes in two different sizes: 7” and 8.9.”
Amazon has long been rumored to be working toward
introducing a smartphone into the market. It has been
testing phones with Asian suppliers, and the device would most
likely be built using the company’s experience
with its Kindle Fire tablet product line, which competes against
the iPad. The company also has more than 60,000
rot45065_cases19_01-32.indd 10 12/24/13 10:00 PM
This document is authorized for use only by Deborah Melvin in
MGMT-6990-1/WMBA-6990-1/WMBA-6990B-1-Capstone2020
Spring Sem 01/06-04/26-PT2 at Laureate Education - Walden
University, 2020.
Apple (in 2013): How to Sustain a Competitive Advantage?
11
apps running on Google’s Android software, so a smartphone
would appear to be the next logical step in its inno-
vation process. The device could have a large impact on both
Apple and Samsung’s smartphone market share.
BLACKBERRY
Research in Motion (RIM) was founded in 1984 by University
of Waterloo engineering student Mike Lazaridis
and University of Windsor engineering student Douglas Fregin.
In 2002, the company revolutionized the cellular
phone market with its first data and voice product, the
BlackBerry 5810. The company won numerous design
and innovation awards and entered into partnerships with all of
the major phone carriers. By 2005, it had over
5 million subscribers and continued to upgrade and release
various new models around the world. 78
In 2009, Fortune named RIM the world’s fastest-growing
company; its profits grew at an astonishing rate of
84 percent ( Exhibit 13 ). But in 2012, RIM experienced a 90
percent drop in its stock price due to dismal sales
and market share numbers. It was the culmination of a decline
that began in 2007—the year Apple launched the
iPhone. Unlike the BlackBerry, which targeted a smaller
contingent of enterprise clients, the iPhone catered to the
everyday user, putting RIM at a distinct competitive
disadvantage. Also, RIM resisted the use of apps, touchscreen
technology, and full access to the Internet that competitors like
Apple offered as standard on their smartphones. 79
In 2013, RIM changed its name to BlackBerry to signal a new
start. Though struggling to compete with Apple
and the Android phone manufacturers, BlackBerry launched a
new operating system and two new phones in
January of 2013.
FACEBOOK
In 2004, 19-year-old Mark Zuckerberg and three college pals
founded Facebook in a dorm room at Harvard.
What began as a hobby to let Ivy Leaguers socialize online has
become the world’s largest social networking site,
with more than one billion users and revenues of over $4.5
billion in 2012 ( Exhibit 14 ). 80
Facebook continues to move toward a more mobile-centered
business model and has developed applications
and advertising specifically for these types of devices. In April
of 2013, Facebook and HTC unveiled the HTC
First, which is the first phone designed specifically for the
Facebook Home Android application. 81 Many wonder
if Facebook will ever launch its own phone and operating
system.
GOOGLE
In 1998, 24-year-old Sergey Brin and 25-year-old Larry Page
founded Google. They met as graduate students
in the computer science department at Stanford University
where they began working together on a web crawler,
with the goal of improving online searches. What they
developed was the PageRank algorithm, which returns the
most relevant web pages more or less instantaneously and ranks
them by how often they are referenced on other
important web pages. A clear improvement over early search
engines such as AltaVista, Overture, and Yahoo, all
of which indexed by keywords, the PageRank algorithm is able
to consider 500 million variables and three billion
terms. What started as a homework assignment launched the two
into an entrepreneurial venture when they set
up shop in a garage in Menlo Park, California. Today, Google is
the world’s leading online search and advertising
company, with some 70 percent market share of an industry
estimated to be worth more than $25 billion a year,
and growing quickly. (See Exhibit 15 for Google’s financials.)
Google’s current operating system, Android, is used
exclusively by Samsung Electronics, a Korean electron-
ics maker, in all of its smartphone devices. As an alternative to
the iPhone, Android phones created by Samsung,
HTC, and others have rapidly stolen market share from Apple
and BlackBerry. Samsung especially has been able
to create phones running Android that are viable alternatives to
the iPhone. In a move into the hardware space,
Google acquired Motorola Mobility in 2011 and plans to release
its own phones and tablets running Android.
rot45065_cases19_01-32.indd 11 12/24/13 10:00 PM
This document is authorized for use only by Deborah Melvin in
MGMT-6990-1/WMBA-6990-1/WMBA-6990B-1-Capstone2020
Spring Sem 01/06-04/26-PT2 at Laureate Education - Walden
University, 2020.
12
Apple (in 2013): How to Sustain a Competitive Advantage?
Google would have more control over the hardware and ideally
be able to optimize the hardware for future
Android features. By controlling the software on mobile
devices, Google plans to also control the ads shown to
users, thus extending its hold on the digital ads market, its main
source of revenue. Android is run on 79 percent
of all smartphones. 82
Google’s Chromebook is a line of laptop computers running
Google’s Chrome operating system. The Chrome
OS is designed to provide the user with the minimal amount of
hardware and installed applications needed. The
user runs applications from the cloud and uses Google’s Chrome
browser to access these applications. Several
manufacturers such as Samsung, Acer, and HP are partnering
with Google to create Chromebooks.
Google is also looking to develop more web-connected services
for people’s homes, powered by the Android
operating system. In addition, Google is trying to enter the
high-speed Internet market so it can deliver its products
to customers without having to worry about poor connection
speeds or being blocked by competitors. It began
wiring homes in Kansas City, both the Missouri and Kansas
sides, in 2012, with plans to expand to other locations
around the U.S. in 2013. 83 Google is also attempting to hold
off both Facebook and Amazon by enabling retailers
to reach consumers through its search engine exclusively.
MICROSOFT
The partnership that Paul Allen and Bill Gates formed in 1975
started out small, but Gates and Allen had a
vision to one day put a computer in everyone’s home. During
the next several decades, their company, Microsoft,
revolutionized the way people work and play on their
computers. 84
In the 1990s and early 2000s, Microsoft dominated the
technology market with its Windows operating system.
As it watched the likes of BlackBerry and Apple post
substantial profit numbers, it decided to enter the smart-
phone market and introduced the first Windows phone in late
2010, and then a second model in 2012.
In early 2011, Microsoft announced that it was entering into a
partnership with Nokia. Under the agreement,
Nokia agreed to use the Windows phone as its primary
smartphone and to leverage its strengths in imaging,
design, and pricing structure to drive growth for both
companies. Nokia’s CEO, Stephen Elop, boldly stated that
the smartphone market was now a “three-horse race” among
itself, Apple, and Samsung. 85
Microsoft has its own tablet PC to compete with the iPad. The
Microsoft Surface was released in October of
2012 with a large campaign to compare it to the iPad. The
Surface has an attachable keyboard/cover, a USB port,
and runs the Windows 8 operating system.
Like Apple, Microsoft has also opened its own stores to sell
Microsoft products and third-party products that
run Microsoft’s software. (See Exhibit 16 for Microsoft’s
financials.)
NOKIA
In 1922, three companies spanning five industries—rubber,
cable, forestry, electronics, and power generation—
officially merged to become the Nokia corporation. By 1998,
the company had become the global leader in mobile
phones and posted sales of over €30 billion. In 2005, the
company sold its billionth phone, but by 2010 it was
struggling to compete against more popular Samsung and Apple
products. 86
In early 2011, Nokia announced that it was entering into a
partnership with Microsoft to try to become a top
competitor in the smartphone market. Later that same year, it
launched two models of the Nokia Lumia phone,
both of which run Windows phone software. In September of
2012, the latest model, the Nokia Lumia 920, was
launched to dismal reviews, with most tech savvy people stating
that there was no reason for current Android or
iPhone customers to switch. The company’s stock price
continued to fall, dropping to $2.50 a share after the new
model introduction. 87 (See Exhibit 17 .)
rot45065_cases19_01-32.indd 12 12/24/13 10:00 PM
This document is authorized for use only by Deborah Melvin in
MGMT-6990-1/WMBA-6990-1/WMBA-6990B-1-Capstone2020
Spring Sem 01/06-04/26-PT2 at Laureate Education - Walden
University, 2020.
Apple (in 2013): How to Sustain a Competitive Advantage?
13
SAMSUNG
On March 1, 1938, Byung-Chull Lee started Samsung, which
means three stars in Korean, as a small export
business focusing primarily on fish, vegetables, and fruit.
Within a little over 10 years, Samsung would have
its own manufacturing and sales operations. Today, the
technology giant sells products around the globe and is
instantly recognized for its innovative, consumer-driven
products. 88 (See Exhibit 18 for Samsung’s financials.)
By 2012, Samsung Electronics had become the global
smartphone market leader, due mostly to its extremely
successful Galaxy S device and subsequent versions, which run
on Google’s Android operating system. The
phone is comparable in both design and technical features to the
iPhone and poses the biggest competitive threat
to Apple. It is estimated that Samsung holds a 28 percent share
of the smartphone market, up from 20 percent in
2011. It is the global leader in smartphone sales. Meanwhile,
Apple’s share was 20.5 percent in 2012, up from
19 percent in 2011. 89 Together, Samsung and Google have
been able to act as complementors to provide a product
comparable in quality and experience to the iPhone. With
Samsung’s manufacturing and hardware expertise and
Google’s software and user experience expertise, Apple faces
potentially its strongest competitor.
One of the main drivers of Samsung’s rise has been its two-
pronged pricing structure. Its premium products
are priced similarly to Apple’s in the U.S., but the company
also heavily discounts the prices of some phones,
sometimes to less than a quarter of the suggested retail price.
Additionally, Samsung manufactures all of its own
smartphones, including the components, which gives it a
distinct cost advantage over its closest competitors. Even
Apple uses Samsung to manufacture a portion of its iPhone
product line. Meanwhile, for the low-end and emerg-
ing smartphone markets, Samsung provides products that
compete directly with Microsoft’s Windows phone.
The intense competition between Apple and Samsung has led to
many legal battles, mostly over patent
infringement. In August 2012, a U.S. federal court ruled in
favor of Apple in one such case, awarding it more than
$1 billion in damages (later reduced to some $500 million).
Separate infringement cases are pending in various
other countries around the world pertaining to the design and
technology of both companies’ devices.
Challenges Ahead
Apple has created a competitive advantage through its
differentiated products, brand loyalty, and seamlessly
integrated devices. However, Tim Cook knows the competition
is constantly looking at new ways to take market
share away from the company. How should he respond to the
constant pressure? And where is Apple’s future
growth going to come from? A new, less expensive iPhone? The
next generation iPad? Or another revolutionary
product such as WebTV or smartwatches? Other category-
defining products and services?
There are also emerging economies, such as China and Brazil,
to consider. Sales to these countries could
make any company an industry leader with the key advantages
they offer: large populations, growing disposable
incomes, and low cost of living. How should Apple compete in
these markets? Should it stay with its differenti-
ated, premium-price strategy around the world? Or should it let
low-price, low-margin products from other com-
petitors battle it out in these areas?
Tim Cook not only has some enormous strategic decisions to
make in the short term but also needs to decide
where and how Apple should compete in the long term. Given
the blurring industry boundaries that allow capable
competitors to put pressure on Apple, Cook needs to carefully
plan the company’s next moves if he wants to sus-
tain Apple’s competitive advantage. As his MacBook Pro boots
up, Cook pops open a can of low-carb Monster
Energy drink and begins to jot down some of his thoughts.
rot45065_cases19_01-32.indd 13 12/24/13 10:00 PM
This document is authorized for use only by Deborah Melvin in
MGMT-6990-1/WMBA-6990-1/WMBA-6990B-1-Capstone2020
Spring Sem 01/06-04/26-PT2 at Laureate Education - Walden
University, 2020.
14
Apple (in 2013): How to Sustain a Competitive Advantage?
EXHIBIT 1 Apple’s Daily Market Cap since December 2011
700
650
600
550
500
450
400
350
300
20
-D
ec
-1
1
20
-J
an
-1
2
20
-F
eb
-1
2
20
-M
ar
-1
2
20
-A
pr
-1
2
20
-M
ay
-1
2
20
-J
un
-1
2
20
-J
ul-
12
20
-A
ug
-1
2
20
-S
ep
-1
2
20
-O
ct
-1
2
20
-N
ov
-1
2
20
-D
ec
-1
2
20
-J
an
-1
3
20
-F
eb
-1
3
20
-M
ar
-1
3
20
-A
pr
-1
3
$370
Apple Inc.
M
ar
ke
t
C
ap
(
in
U
.S
.
$
bi
lli
on
s)
Source: Author’s depiction of publicly available data drawn
from Bloomberg.
rot45065_cases19_01-32.indd 14 12/24/13 10:00 PM
This document is authorized for use only by Deborah Melvin in
MGMT-6990-1/WMBA-6990-1/WMBA-6990B-1-Capstone2020
Spring Sem 01/06-04/26-PT2 at Laureate Education - Walden
University, 2020.
Apple (in 2013): How to Sustain a Competitive Advantage?
15
Net Sales by Operating Segment 2008 2009 2010 2011
2012
Americas net sales 16,447 18,981 24,498 38,315 57,512
Europe net sales 9,233 11,810 18,692 27,778 36,323
Japan net sales 1,728 2,279 3,981 5,437 10,571
Asia-Pacific net sales 2,791 3,179 8,256 22,592 33,274
Retail net sales 7,292 6,656 9,798 14,127 18,828
Total net sales 37,491 42,905 65,225 108,249 156,508
Note: Other segments include Asia Pacific and FileMaker.
Source: Apple Annual Reports 2008–2012.
EXHIBIT 2A Apple’s Regional Sales, 2008–2012 (in $
millions)
S
al
es
(
in
$
m
ill
io
ns
)
Year
2008 2009 2010 2011 2012
10,000
0
20,000
30,000
40,000
50,000
60,000
Americas
Europe
Japan
Asia-Pacific
Retail
Apple Net Sales by Market
(2008−2012)
rot45065_cases19_01-32.indd 15 12/24/13 10:00 PM
This document is authorized for use only by Deborah Melvin in
MGMT-6990-1/WMBA-6990-1/WMBA-6990B-1-Capstone2020
Spring Sem 01/06-04/26-PT2 at Laureate Education - Walden
University, 2020.
16
Apple (in 2013): How to Sustain a Competitive Advantage?
Unit Sales by Product 2008 2009 2010 2011 2012
Desktops a 3,712 3,182 4,627 4,669 4,656
Portables b 6,003 7,214 9,035 12,066 13,502
Total Mac unit sales 9,715 10,396 13,662 16,735 18,158
Net sales per Mac unit sold c $1,478 $1,333 $1,279
$1,301 $1,278
iPod units sold 54,828 54,132 50,312 46,620 35,165
Net sales per iPod unit sold c $167 $149 $164 $174 $159
iPhone units sold 11,627 20,731 39,989 32,394 58,310
a Includes iMac, Mac mini, and Mac Pro product lines (2008–
2010 numbers also include Power Mac and Xserve product
lines).
b Includes MacBook, iBook, MacBook Air, MacBook Pro,
and PowerBook product lines.
c Derived by dividing total product-related net sales by total
product-related unit sales.
Source: Apple Annual Reports 2008–2012.
EXHIBIT 2C Unit Sales by Product, 2008–2012 (in millions,
except sales-per-unit-sold data)
Net Sales by Product 2008 2009 2010 2011 2012
Desktops a 5,622 4,324 6,201 6,439 6,040
Portables b 8,732 9,535 11,278 15,344 17,181
Total Mac net sales 14,354 13,859 17,479 21,783 23,221
iPod 9,153 8,091 8,274 7,453 5,615
Other music-related products and services c 3,340 4,036
4,948 6,314 8,534
iPhone and services d 6,742 13,033 25,179 47,057
80,477
iPad and related products e 4,958 20,358 32,424
Peripherals and hardware f 1,694 1,475 1,814 2,330
2,778
Software and service sales g 2,208 2,411 2,573 2,954
3,459
Total net sales 37,491 42,905 65,225 108,249 156,508
a Includes iMac, Mac mini, and Mac Pro product lines (2008–
2010 numbers also include Power Mac and Xserve product
lines).
b Includes MacBook, iBook, MacBook Air, MacBook Pro,
and PowerBook product lines.
c Includes sales from iTunes Store, App Store, and
iBookstore, as well as sales of iPod services and Apple-branded
and third-party iPod accessories.
d Includes revenue recognized from iPhone sales, carrier
agreements, services, and Apple-branded and third-party iPhone
accessories.
e Includes revenue recognized from iPad sales, services, and
Apple-branded and third-party iPad accessories.
f Includes sales of displays, wireless connectivity and
networking solutions, and other hardware accessories.
g Includes sales of Apple-branded operating system and
application software, third-party software, and Mac and Internet
services.
Source: Apple Annual Reports 2008–2012.
EXHIBIT 2B Net Sales by Product, 2008–2012 (in $ millions)
rot45065_cases19_01-32.indd 16 12/24/13 10:00 PM
This document is authorized for use only by Deborah Melvin in
MGMT-6990-1/WMBA-6990-1/WMBA-6990B-1-Capstone2020
Spring Sem 01/06-04/26-PT2 at Laureate Education - Walden
University, 2020.
Apple (in 2013): How to Sustain a Competitive Advantage?
17
Fiscal Year 2008 2009 2010 2011 2012
Cash and short-term investments 24,490 23,464 25,620
25,952 29,129
Receivables–total 4,704 5,057 9,924 11,717 18,692
Inventories–total 509 455 1,051 776 791
Property, plant, and equipment–total (net) 2,455 2,954
4,768 7,777 15,452
Depreciation, depletion, and amortization (accumulated)
1,292 1,713 2,466 3,991 6,435
Assets–total 39,572 47,501 75,183 116,371 176,064
Accounts payable–trade 5,520 5,601 12,015 14,632 21,175
Long-term debt 0 0 0 0 0
Liabilities–total 18,542 15,861 27,392 39,756 57,854
Stockholders’ equity–total 21,030 31,640 47,791 76,615
118,210
Sales (net) 32,479 42,905 65,225 108,249 156,508
Cost of goods sold 20,898 24,999 38,609 62,609 84,641
Selling, general, and administrative expense 4,870 5,482
7,299 10,028 13,421
Income taxes 2,061 3,831 4,527 8,283 14,030
Income before extraordinary items 4,834 8,235 14,013
25,922 41,733
Net income (loss) 4,834 8,235 14,013 25,922 41,733
Earnings per share (basic) excluding extraordinary items 5.48
9.22 15.41 28.05 44.64
Earnings per share (diluted) excluding extraordinary items
5.36 9.08 15.15 27.68 44.15
Source: Compustat.
EXHIBIT 3 Apple Financial Data, 2008–2012 (in $ millions,
except EPS data)
EXHIBIT 4 Apple’s Stock Price and NASDAQ, September
1984–August 2011
Source: Author’s depiction of publicly available data drawn
from Yahoo.
7,000%
Aug 23, 2011
Steve Jobs’ last day as CEO
Sept 16, 1997
Steve Jobs becomes CEO
6,500%
6,000%
5,500%
5,000%
4,500%
4,000%
3,500%
3,000%
2,500%
2,000%
1,500%
1,000%
500%
0%
2500%
Se
p 1
99
7
Ja
n 1
99
9
Ja
n 2
00
0
Ja
n 2
00
1
Ja
n 2
00
2
Ja
n 2
00
3
Ja
n 2
00
4
Ja
n 2
00
5
Ja
n 2
00
6
Ja
n 2
00
7
Ja
n 2
00
8
Ja
n 2
00
9
Ja
n 2
01
0
Au
g 2
01
1
Apple Inc.
NASDAQ Composite Index
rot45065_cases19_01-32.indd 17 12/24/13 10:00 PM
This document is authorized for use only by Deborah Melvin in
MGMT-6990-1/WMBA-6990-1/WMBA-6990B-1-Capstone2020
Spring Sem 01/06-04/26-PT2 at Laureate Education - Walden
University, 2020.
18
Apple (in 2013): How to Sustain a Competitive Advantage?
EXHIBIT 5 Apple’s Stock Price and NASDAQ, August 2011–
April 2013
Source: Author’s depiction of publicly available data drawn
from Yahoo.
80%
90%
60%
70%
50%
40%
30%
20%
10%
210%
0%
2011 2012Oct Feb Mar Apr
August 24, 2011
Tim Cook’s first day as CEO
May Jun Jul Aug Sep Oct Nov Dec Feb Mar Apr2013Nov Dec
NASDAQ Composite Index
Apple Inc.
EXHIBIT 6 Apple’s Stock Price, August 2011–September
2012
Source: Author’s depiction of publicly available data drawn
from MSN Money.
Se
p 2
01
1
Oc
t 2
01
1
No
v 2
01
1
De
c 2
01
1
Ja
n 2
01
2
Fe
b 2
01
2
Ma
r 2
01
2
Ap
r 2
01
2
Ma
y 2
01
2
Ju
n 2
01
2
Ju
l 2
01
2
Au
g 2
01
2
Se
p 2
01
2
Sept 21, 2012
Launch of iPhone 5
700
675
650
625
600
575
550
525
500
475
450
425
400
375
350
S
to
ck
P
ri
ce
Time
August 24, 2011
Tim Cook appointed CEO
rot45065_cases19_01-32.indd 18 12/24/13 10:00 PM
This document is authorized for use only by Deborah Melvin in
MGMT-6990-1/WMBA-6990-1/WMBA-6990B-1-Capstone2020
Spring Sem 01/06-04/26-PT2 at Laureate Education - Walden
University, 2020.
Apple (in 2013): How to Sustain a Competitive Advantage?
19
R&D, Most Recent
Rank Company Four Quarters Selected % of Revenue
1 Microsoft $9,043,000 12.93
2 Intel 8,350,000 15.46
3 IBM 6,258,000 5.85
4 Cisco 5,823,000 13.47
5 Google 5,162,000 13.62
6 Oracle 4,519,000 12.69
7 Hewlett-Packard 3,254,000 2.56
8 Apple 2,429,000 2.24
9 SAP 2,320,000 13.87
10 EMC 2,149,000 10.74
11 Advanced Micro Devices 1,453,000 22.12
12 BlackBerry 1,351,000 6.79
13 Yahoo 919,000 18.44
14 Seagate 875,000 7.98
15 Symantec 862,000 13.93
Source: Adapted from Robert Herzberg, “Top 50 Technology
R&D Spenders,” CIO Zone, http://bit.ly/gD0pRS .
EXHIBIT 7 R&D Spending at Selected Tech Companies, 2011
(in thousands)
rot45065_cases19_01-32.indd 19 12/24/13 10:00 PM
This document is authorized for use only by Deborah Melvin in
MGMT-6990-1/WMBA-6990-1/WMBA-6990B-1-Capstone2020
Spring Sem 01/06-04/26-PT2 at Laureate Education - Walden
University, 2020.
20
Apple (in 2013): How to Sustain a Competitive Advantage?
EXHIBIT 8 Apple’s Net Income ($ millions) and Key Events
over Time, 1981–2012
40,000
36,000
32,000
28,000
24,000
20,000
16,000
N
et
In
co
m
e
($
m
ill
io
ns
)
12,000
8,000
28,000
4,000
24,000
0
Year
19
78
19
81
19
83
19
85
19
87
19
89
19
91
19
93
19
95
19
97
19
99
20
01
20
03
20
05
20
07
20
09
20
11
20
12
Apple ll
Apple Macintosh LaserWriter
Steve Jobs returns
Powerbook G3
iPod 1st generation
iMac
iTunes
Intel-based Macs
iPhone 1st generation
iPhone 3G
iPhone 3GS, iPad
iPhone 4S
iPad Mini, iPhone 5
Source: Author’s depiction of publicly available data drawn
from Compustat and various Apple annual reports.
rot45065_cases19_01-32.indd 20 12/24/13 10:00 PM
This document is authorized for use only by Deborah Melvin in
MGMT-6990-1/WMBA-6990-1/WMBA-6990B-1-Capstone2020
Spring Sem 01/06-04/26-PT2 at Laureate Education - Walden
University, 2020.
Apple (in 2013): How to Sustain a Competitive Advantage?
21
EXHIBIT 9 Percent Growth in Stock Price since 1990
Source: Author’s depiction of publicly available data.
20,000%
15,000%
10,000%
Microsoft
5,000%
19
90
19
91
19
92
19
93
19
94
19
95
19
96
19
97
19
98
19
99
20
00
20
01
20
02
20
03
20
04
20
05
20
06
20
07
20
08
20
09
20
10
20
11
20
12
20
13
0%
25,000%
Samsung
Apple
Amazon
Google
EXHIBIT 10 Percent Growth in Stock Price in 2013
Source: Author’s depiction of publicly available data.
20%
220%
225%
230%
235%
9-
Ja
n
16
-J
an
23
-J
an
30
-J
an
6-
Fe
b
13
-F
eb
20
-F
eb
27
-F
eb
6-
M
ar
13
-M
ar
20
-M
ar
27
-M
ar
3-
A
pr
10
-A
pr
17
-A
pr
24
-A
pr
15%
215%
10%
210%
5%
25%
0%
Amazon
Apple
Microsoft
Samsung
Google
rot45065_cases19_01-32.indd 21 12/24/13 10:00 PM
This document is authorized for use only by Deborah Melvin in
MGMT-6990-1/WMBA-6990-1/WMBA-6990B-1-Capstone2020
Spring Sem 01/06-04/26-PT2 at Laureate Education - Walden
University, 2020.
22
Apple (in 2013): How to Sustain a Competitive Advantage?
EXHIBIT 11 Market Cap in 2013
Source: Author’s depiction of publicly available data.
100
0
1/
1/
20
13
1/
8/
20
13
1/
15
/2
01
3
1/
22
/2
01
3
1/
29
/2
01
3
2/
5/
20
13
2/
12
/2
01
3
2/
19
/2
01
3
2/
26
/2
01
3
3/
5/
20
13
3/
12
/2
01
3
3/
19
/2
01
3
3/
26
/2
01
3
4/
2/
20
13
4/
9/
20
13
4/
16
/2
01
3
4/
23
/2
01
3
200
300
400
500
600
700
M
ar
ke
t
C
ap
in
U
S
D
B
ill
io
ns
HTC
Samsung
Apple
Motorola
BlackBerry
rot45065_cases19_01-32.indd 22 12/24/13 10:00 PM
This document is authorized for use only by Deborah Melvin in
MGMT-6990-1/WMBA-6990-1/WMBA-6990B-1-Capstone2020
Spring Sem 01/06-04/26-PT2 at Laureate Education - Walden
University, 2020.
Apple (in 2013): How to Sustain a Competitive Advantage?
23
Fiscal Year 2008 2009 2010 2011 2012
Cash and short-term investments 3,727 6,366 8,762 9,576
11,448
Receivables–total 711 836 1,324 2,134 2,600
Inventories–total 1,399 2,171 3,202 4,992 6,031
Property, plant, and equipment–total (net) 854 1,290 2,414
4,417 7,060
Depreciation, depletion, and amortization (accumulated) 555
625 842 1,369 2,522
Assets–total 8,314 13,813 18,797 25,278 32,555
Accounts payable–trade 3,594 5,605 8,051 11,145 13,318
Long-term debt 533 252 641 1,415 3,830
Liabilities–total 5,642 8,556 11,933 17,521 24,363
Stockholders’ equity–total 2,672 5,257 6,864 7,757 8,192
Sales (net) 19,166 24,509 34,204 48,077 61,093
Cost of goods sold 14,585 18,594 26,009 36,288 44,271
Selling, general, and administrative expense 3,452 4,300
6,131 9,773 14,287
Income taxes 247 253 352 291 428
Income before extraordinary items 645 902 1,152 631 2
39
Net income (loss) 645 902 1,152 631 2 39
Earnings per share (basic) excluding extraordinary items 1.52
2.08 2.58 1.39 2 0.09
Earnings per share (diluted) excluding extraordinary items
1.49 2.04 2.53 1.37 2 0.09
Source: Compustat.
EXHIBIT 12 Amazon Financial Data, 2008–2012 (in $
millions, except EPS data)
rot45065_cases19_01-32.indd 23 12/24/13 10:00 PM
This document is authorized for use only by Deborah Melvin in
MGMT-6990-1/WMBA-6990-1/WMBA-6990B-1-Capstone2020
Spring Sem 01/06-04/26-PT2 at Laureate Education - Walden
University, 2020.
24
Apple (in 2013): How to Sustain a Competitive Advantage?
Fiscal Year 2008 2009 2010 2011 2012
Cash and short-term investments 1,518 1,911 2,121 1,774
2,654
Receivables–total 2,270 2,800 4,279 3,693 3,222
Inventories–total 682 622 618 1,027 603
Property, plant, and equipment–total (net) 1,335 1,957
2,504 2,748 2,395
Depreciation, depletion, and amortization (accumulated) 588
921 1,395 2,032 2,622
Assets–total 8,101 10,204 12,875 13,731 13,165
Accounts payable–trade 448 616 832 744 1,064
Long-term debt 0 0 0 0 0
Liabilities–total 2,227 2,602 3,937 3,631 3,705
Stockholders’ equity–total 5,874 7,603 8,938 10,100 9,460
Sales (net) 11,065 14,953 19,907 18,435 11,073
Cost of goods sold 5,835 8,064 10,593 10,890 6,339
Selling, general, and administrative expense 2,180 2,778
3,750 4,052 3,496
Income taxes 908 809 1,233 347 –592
Income before extraordinary items 1,893 2,457 3,411 1,164
–628
Net income (loss) 1,893 2,457 3,411 1,164 –646
Earnings per share (basic) excluding extraordinary items 3.35
4.35 6.36 2.22 –1.20
Earnings per share (diluted) excluding extraordinary items
3.30 4.31 6.34 2.22 –1.20
Source: Compustat.
EXHIBIT 13 BlackBerry Financial Data, 2008–2012 (in $
millions, except EPS data)
rot45065_cases19_01-32.indd 24 12/24/13 10:00 PM
This document is authorized for use only by Deborah Melvin in
MGMT-6990-1/WMBA-6990-1/WMBA-6990B-1-Capstone2020
Spring Sem 01/06-04/26-PT2 at Laureate Education - Walden
University, 2020.
Apple (in 2013): How to Sustain a Competitive Advantage?
25
Fiscal Year 2010 2011 2012
Cash and short-term investments 1,785 3,908 9,626
Receivables–total 373 547 1,170
Inventories–total 0 0 0
Property, plant, and equipment–total (net) 574 1,475 2,391
Depreciation, depletion, and amortization
(accumulated)
246 450 882
Assets–total 2,990 6,331 15,103
Accounts payable–trade 29 63 65
Long-term debt 367 398 1,991
Liabilities–total 828 1,432 3,348
Stockholders’ equity–total 2,162 4,899 11,755
Sales (net) 1,974 3,711 5,089
Cost of goods sold 354 537 720
Selling, general, and administrative expense 449 1,095
3,187
Income taxes 402 695 441
Income before extraordinary items 606 1,000 53
Net income (loss) 606 1,000 53
Earnings per share (basic) excluding
extraordinary items
0.28 0.47 0.02
Earnings per share (diluted) excluding
extraordinary items
0.28 0.47 0.02
Source: Compustat.
EXHIBIT 14 Facebook Financial Data, 2010–2012 (in $
millions, except EPS data)
rot45065_cases19_01-32.indd 25 12/24/13 10:00 PM
This document is authorized for use only by Deborah Melvin in
MGMT-6990-1/WMBA-6990-1/WMBA-6990B-1-Capstone2020
Spring Sem 01/06-04/26-PT2 at Laureate Education - Walden
University, 2020.
26
Apple (in 2013): How to Sustain a Competitive Advantage?
Fiscal Year 2008 2009 2010 2011 2012
Cash and short-term investments 15,846 24,485 34,975
44,626 48,088
Receivables–total 2,642 3,202 5,002 6,172 8,585
Inventories–total 0 0 0 0 505
Property, plant, and equipment–total (net) 5,234 4,845
7,759 9,603 11,854
Depreciation, depletion, and amortization (accumulated)
2,342 3,286 4,012 4,797 5,843
Assets–total 31,768 40,497 57,851 72,574 93,798
Accounts payable–trade 178 216 483 588 2,012
Long-term debt 0 0 0 2,986 2,988
Liabilities–total 3,529 4,493 11,610 14,429 22,083
Stockholders’ equity–total 28,239 36,004 46,241 58,145
71,715
Sales (net) 21,796 23,651 29,321 37,905 50,175
Cost of goods sold 7,130 7,338 9,036 11,351 17,633
Selling, general, and administrative expense 6,447 6,468
8,523 12,475 16,284
Income taxes 1,627 1,861 2,291 2,589 2,598
Income before extraordinary items 4,227 6,520 8,505 9,737
10,788
Net income (loss) 4,227 6,520 8,505 9,737 10,737
Earnings per share (basic) excluding extraordinary items
13.46 20.62 26.69 30.17 32.97
Earnings per share (diluted) excluding extraordinary items
13.31 20.41 26.31 29.76 32.46
Source: Compustat.
EXHIBIT 15 Google Financial Data, 2008–2012 (in $
millions, except EPS data)
rot45065_cases19_01-32.indd 26 12/24/13 10:00 PM
This document is authorized for use only by Deborah Melvin in
MGMT-6990-1/WMBA-6990-1/WMBA-6990B-1-Capstone2020
Spring Sem 01/06-04/26-PT2 at Laureate Education - Walden
University, 2020.
Apple (in 2013): How to Sustain a Competitive Advantage?
27
Fiscal Year 2008 2009 2010 2011 2012
Cash and short-term investments 23,662 31,447 36,788
52,772 63,040
Receivables–total 13,589 11,192 13,014 14,987 15,780
Inventories–total 985 717 740 1,372 1,137
Property, plant, and equipment–total (net) 6,242 7,535
7,630 8,162 8,269
Depreciation, depletion, and amortization (accumulated)
6,302 7,547 8,629 9,829 10,962
Assets–total 72,793 77,888 86,113 108,704 121,271
Accounts payable–trade 4,034 3,324 4,025 4,197 4,175
Long-term debt 1 3,756 4,939 11,921 10,713
Liabilities–total 36,507 38,330 39,938 51,621 54,908
Stockholders’ equity–total 36,286 39,558 46,175 57,083
66,363
Sales (net) 60,420 58,437 62,484 69,943 73,723
Cost of goods sold 9,726 9,864 9,888 13,040 14,772
Selling, general, and administrative expense 24,817 25,589
25,932 27,205 28,237
Income taxes 6,133 5,252 6,253 4,921 5,289
Income before extraordinary items 17,681 14,569 18,760
23,150 16,978
Net income (loss) 17,681 14,569 18,760 23,150 16,978
Earnings per share (basic) excluding extraordinary items 1.90
1.63 2.13 2.73 2.02
Earnings per share (diluted) excluding extraordinary items
1.87 1.62 2.10 2.69 2.00
Source: Compustat.
EXHIBIT 16 Microsoft Financial Data, 2008–2012 (in $
millions, except EPS data)
rot45065_cases19_01-32.indd 27 12/24/13 10:00 PM
This document is authorized for use only by Deborah Melvin in
MGMT-6990-1/WMBA-6990-1/WMBA-6990B-1-Capstone2020
Spring Sem 01/06-04/26-PT2 at Laureate Education - Walden
University, 2020.
28
Apple (in 2013): How to Sustain a Competitive Advantage?
Fiscal Year 2008 2009 2010 2011 2012
Cash and short-term investments 9,493 12,717 16,288
14,143 13,066
Receivables–total 13,145 11,438 10,045 9,316 7,320
Inventories–total 3,526 2,673 3,348 3,023 2,028
Property, plant, and equipment–total (net) 2,909 2,676
2,593 2,390 1,887
Depreciation, depletion, and amortization (accumulated)
4,958 5,131 4,876 4,943 4,670
Assets–total 55,094 51,220 51,912 46,969 39,491
Accounts payable–trade 7,273 7,094 8,095 7,177 5,794
Long-term debt 1,198 6,352 5,629 5,149 6,708
Liabilities–total 32,114 30,081 30,375 28,916 27,034
Stockholders’ equity–total 19,776 18,758 19,086 15,403
10,629
Sales (net) 71,168 59,094 56,639 50,375 40,075
Cost of goods sold 45,988 39,131 38,756 35,122 28,399
Selling, general, and administrative expense 13,520 13,739
12,567 12,047 10,751
Income taxes 1,505 1,006 588 376 1,510
Income before extraordinary items 5,551 1,277 2,455 2
1,510 2 4,096
Net income (loss) 5,551 1,277 2,455 2 1,510 2 4,096
Earnings per share (basic) excluding extraordinary items 1.49
0.34 0.66 2 0.40 2 1.11
Earnings per share (diluted) excluding extraordinary items
1.46 0.34 0.66 2 0.40 2 1.11
Source: Compustat.
EXHIBIT 17 Nokia Financial Data, 2008–2012 (in $ millions,
except EPS data)
rot45065_cases19_01-32.indd 28 12/24/13 10:00 PM
This document is authorized for use only by Deborah Melvin in
MGMT-6990-1/WMBA-6990-1/WMBA-6990B-1-Capstone2020
Spring Sem 01/06-04/26-PT2 at Laureate Education - Walden
University, 2020.
Apple (in 2013): How to Sustain a Competitive Advantage?
29
Fiscal Year 2008 2009 2010 2011 2012
Cash and short-term investments 18,311 25,584 20,943
25,040 34,888
Receivables–total 12,672 17,832 19,852 22,502 24,851
Inventories–total 8,844 9,299 12,451 14,642 16,534
Property, plant, and equipment–total (net) 39,591 37,094
49,343 57,802 63,802
Depreciation, depletion, and amortization (accumulated)
45,991 52,619 58,293 67,010 0
Assets–total 98,101 110,195 125,107 144,991 168,692
Accounts payable–trade 5,205 7,671 8,523 9,574 8,840
Long-term debt 5,743 3,418 1,138 4,623 5,080
Liabilities–total 39,479 42,135 41,867 50,109 55,517
Stockholders’ equity–total 0 0 83,240 94,882 113,175
Sales (net) 113,001 129,491 144,058 153,721 187,354
Cost of goods sold 74,583 82,258 85,571 92,438 104,180
Selling, general, and administrative expense 23,394 26,050
32,387 34,222 41,557
Income taxes 641 2,175 2,965 3,191 5,655
Income before extraordinary items 5,148 8,990 14,719
12,446 21,600
Net income (loss) 4,451 7,784 14,533 10,800 18,754
Earnings per share (basic) excluding extraordinary items
35.11 61.02 98.75 82.98 143.49
*Converted from South Korean Won (KWN) at 1 W 5
0.00093163$US.
Source: Compustat.
EXHIBIT 18 Samsung Financial Data, 2008–2012 (in $
millions,* except EPS data)
rot45065_cases19_01-32.indd 29 12/24/13 10:00 PM
This document is authorized for use only by Deborah Melvin in
MGMT-6990-1/WMBA-6990-1/WMBA-6990B-1-Capstone2020
Spring Sem 01/06-04/26-PT2 at Laureate Education - Walden
University, 2020.
30
Apple (in 2013): How to Sustain a Competitive Advantage?
Endnotes
1. Cook, T., Apple keynote address on iPhone 5,
September 21, 2012, San Francisco, CA.
2. Ibid.
3. “New mobile phone signals Apple’s ambition,” The
New York Times, January 9, 2007.
4. Jobs, S., Crunchbase,
www.crunchbase.com/person/steve-jobs .
5. Jobs, S. (2005), “‘You’ve got to find what you love,’
Jobs says.”
6. Ibid.
7. Ibid.
8. Ibid.
9. Ibid.
10. Sculley, J., and J. A. Byrne (1987), Odyssey: Pepsi to
Apple (New York: Harper & Row).
11. “DoubleTwist remakes Apple’s classic 1984 ad with a
new dictator: Steve Jobs,” TechCrunch, September 29, 2009.
12 . Text from Apple’s TV ad during Super Bowl, January
22, 1984.
13 . Jobs, S. (2005), “‘You’ve got to find what you love,’
Jobs says.”
14. Ibid.
15. Ibid.
16 . Isaacson, W. (2012), Steve Jobs (Simon & Schuster).
17 . “Disney buys Pixar,” CNN Money, January 25, 2006.
18. “Disney agrees to acquire Pixar in a $7 billion deal,”
The New York Times, January 25, 2006.
19. “Apple Computer, Inc. agrees to acquire NeXT
Software Inc.,” Apple Inc., December 20, 1996.
20. “Apple to trim jobs and its product line,” The New York
Times, March 15, 1997.
21. Yoffie, D. B., and R. Kim (2010), “Apple Inc. in 2010
(9-710-467),” Harvard Business School, April 13.
22 . “Steve Jobs’ Magic Kingdom,” BusinessWeek,
February 2006.
23. “Dell: Apple should close shop,” CNET News,
October 6, 1997.
24. Ibid.
24. “Microsoft and Apple affirm commitment to build next
generation software for Macintosh,” Apple Inc., August 6, 1997.
26. Time, cover, September 12, 2006.
27. “Jonathan Ive and Apple win again,” BusinessWeek,
June 7, 2007.
28. “Look forward in anger,” The Economist, March 18,
2010.
29. Hertzfeld, A. (1983), “Pirate flag,” Folklore, August,
www.folklore.org/StoryView.py?story 5 Pirate_Flag.txt .
30. “Jobs at Apple,” www.apple.com/jobs/us/ .
31. Ibid.
32. Ibid.
rot45065_cases19_01-32.indd 30 12/24/13 10:00 PM
This document is authorized for use only by Deborah Melvin in
MGMT-6990-1/WMBA-6990-1/WMBA-6990B-1-Capstone2020
Spring Sem 01/06-04/26-PT2 at Laureate Education - Walden
University, 2020.
Apple (in 2013): How to Sustain a Competitive Advantage?
31
33. Ibid.
34. “Growth by effort: The best company,” The Wise
Nutrition, December 2008.
35. “Apple and Microsoft: Jobs barefoot under a tree,”
Computergram International, January 26, 1999.
36. “Cult of Apple,” Uncyclopedia,
http://uncyclopedia.wikia.com/wiki/Cult_of_Apple .
37. Jobs, S., Crunchbase,
www.crunchbase.com/person/steve-jobs .
38. Rumelt, R. P. (2011), Good Strategy. Bad Strategy.
The Difference and Why It Matters (New York, NY: Crown
Business), p. 14.
39. Hill, C.W.L., and F. T. Rothaermel (2003), “The
performance of incumbent firms in the face of radical
technological
innovation,” Academy of Management Review 28 (2): 257–
274.
40. “The seed of Apple’s innovation,” BusinessWeek,
October 12, 2004.
41. “The second coming of Apple through a magical fusion
of man—Steve Jobs—and company, Apple is becoming itself
again: The little anticompany that could,” Fortune, November
9, 1998.
42. “Apple’s R&D spend reaches record high; execs
excited as new products loom,” Computer World, July 24,
2013.
43. “Apple enjoys ongoing iPod demand,” BBC News,
January 18, 2006.
44. “iPod tear-down suggests high Apple margins,” Apple
Insider, September 15, 2006.
45. “iTunes store tops five billion songs,” Apple Inc., June
19, 2008.
46. “AAPL surges past $100, target at $140,” MacNN,
April 26, 2007.
47. “Apple’s Jobs: Mobile Internet is terrible; iPhone
delivers the real Internet,” Information Week, May 31, 2007.
48. “iPhone sales double in 2009 as Apple claims third
place in smartphone sales,” MacRumors.com, February 23,
2010.
49. “Apple takes big gamble on new iPad,” The Wall
Street Journal, January 25, 2010.
50. “Will the Apple iPad have Flash? Nope, and Adobe is
mad,” Christian Science Monitor, January 28, 2010.
51. “Interest builds in Apple ahead of iPad’s launch,” The
Wall Street Journal, March 20, 2010.
52. “Just a touch away, the elusive tablet PC,” The New
York Times, October 4, 2009.
53. “Apple to take tablet beyond bathroom web browsing,”
Apple Insider, October 5, 2009.
54. “Just a touch away, the elusive tablet PC.”
55. Jobs, S., Keynote address to introduce iPad, January
27, 2010, www.apple.com .
56. Ibid.
57. “The Microsofting of Apple,” The New York Times,
February 10, 2010.
58. “Jobs, back at Apple, focuses on new tablet,” The Wall
Street Journal, August 25, 2009.
59. “Apple takes big gamble on new iPad.”
60. “iPhone sales double in 2009 as Apple claims third
place in smartphone sales.”
61. Jobs, S., Keynote address to introduce iPad.
62. Ibid.
63. “Apple’s showman takes the stage,” The Wall Street
Journal, March 3, 2011.
64 . “Apple takes big gamble on new iPad.”
rot45065_cases19_01-32.indd 31 12/24/13 10:00 PM
This document is authorized for use only by Deborah Melvin in
MGMT-6990-1/WMBA-6990-1/WMBA-6990B-1-Capstone2020
Spring Sem 01/06-04/26-PT2 at Laureate Education - Walden
University, 2020.
32
Apple (in 2013): How to Sustain a Competitive Advantage?
65. Jobs, S., Keynote address to introduce iPad.
66. “Apple says no to netbooks,” The New York Times,
April 24, 2009.
67. Jobs, S., Keynote address to introduce iPad.
68. “Apple sees money in old media,” The Wall Street
Journal, January 21, 2010.
69. “Just a touch away, the elusive tablet PC.”
70. “Apple takes big gamble on new iPad.”
71. “Books on iPad offer publishers a pricing edge,” The
New York Times, January 29, 2010.
72. “Apple tablet portends rewrite for publishers,” The
Wall Street Journal, January 27, 2010.
73. “U.S. alleges e-book scheme,” The Wall Street
Journal, April 11, 2012.
74.
http://finance.yahoo.com/q/is?s=AMZN+Income+Statement&an
nual .
75. Jannarone, J. (2011), “Forecast for Best Buy: Worst is
yet to come.”
76. www.amazon.com ,
http://money.cnn.com/magazines/fortune/fortune500/2012/full_l
ist/ .
77. “Kindle Fire & Android gain, but Apple’s iPad holds
commanding 81% tablet share,” AppleInsider, February 5,
2013.
78.
http://www.BlackBerry.com/select/get_the_facts/pdfs/rim/rim_h
istory.pdf .
79. “RIM: What the hell happened?” Fortune, May 30,
2012.
80. http://newsroom.fb.com/Key-Facts .
81. “Another setback for Facebook home,” The Wall Street
Journal, May 23, 2013.
82. “Android obliterates smartphone market,” The Wall
Street Journal, August 7, 2013.
83. “2013 preview; Apple vs. Google vs. Facebook vs.
Amazon; The lines between software and hardware continue to
blur,”
The Wall Street Journal (online), December 25, 2012.
84. http://windows.microsoft.com/en-
US/windows/history .
85. “Nokia and Microsoft announce plans for a broad
strategic partnership to build a new global mobile ecosystem,”
Microsoft press release ( www.microsoft.com ), February 10,
2011.
86. http://www.nokia.com/global/about-nokia/about-
us/the-nokia-story/ .
87. “Nokia tumbles as Lumia launch event fails to
impress,” Forbes, September 5, 2012.
88.
http://www.samsung.com/us/aboutsamsung/corporateprofile/hist
ory06.html .
89. “Has Apple lost its cool to Samsung?” The Wall Street
Journal, January 28, 2013.
rot45065_cases19_01-32.indd 32 12/24/13 10:00 PM
This document is authorized for use only by Deborah Melvin in
MGMT-6990-1/WMBA-6990-1/WMBA-6990B-1-Capstone2020
Spring Sem 01/06-04/26-PT2 at Laureate Education - Walden
University, 2020.
�
�
�
�
�
�
�
�
APPENDIX C
COMPOUND INTEREST TABLES
Values of Interest FactorsWhen n Equals Infinity
Single Payment: Uniform Payment Series:
(F/P, i, ∞) = ∞ (A/F, i, ∞) = 0
(P/F, i, ∞) = 0 (A/P, i, ∞) = i
Arithmetic Gradient Series: (F/A, i, ∞) = ∞
(A/G, i, ∞) = 1/ i (P/A, i, ∞) = 1/ i
(P/G, i, ∞) = 1/ i2
�
�
�
�
�
�
�
�
APPENDIX C: COMPOUND INTEREST TABLES 595
1/4% Compound Interest Factors 1/4%
Single Payment Uniform Payment Series Arithmetic Gradient
Compound Present Sinking Capital Compound Present Gradient
Gradient
Amount Worth Fund Recovery Amount Worth Uniform Present
Factor Factor Factor Factor Factor Factor Series Worth
Find F Find P Find A Find A Find F Find P Find A Find P
Given P Given F Given F Given P Given A Given A Given G
Given G
n F/P P/F A/F A/P F/A P/A A/G P/G n
1 1.003 .9975 1.0000 1.0025 1.000 0.998 0.000 0.000 1
2 1.005 .9950 .4994 .5019 2.003 1.993 0.499 0.995 2
3 1.008 .9925 .3325 .3350 3.008 2.985 0.998 2.980 3
4 1.010 .9901 .2491 .2516 4.015 3.975 1.497 5.950 4
5 1.013 .9876 .1990 .2015 5.025 4.963 1.995 9.901 5
6 1.015 .9851 .1656 .1681 6.038 5.948 2.493 14.826 6
7 1.018 .9827 .1418 .1443 7.053 6.931 2.990 20.722 7
8 1.020 .9802 .1239 .1264 8.070 7.911 3.487 27.584 8
9 1.023 .9778 .1100 .1125 9.091 8.889 3.983 35.406 9
10 1.025 .9753 .0989 .1014 10.113 9.864 4.479 44.184 10
11 1.028 .9729 .0898 .0923 11.139 10.837 4.975 53.913 11
12 1.030 .9705 .0822 .0847 12.167 11.807 5.470 64.589 12
13 1.033 .9681 .0758 .0783 13.197 12.775 5.965 76.205 13
14 1.036 .9656 .0703 .0728 14.230 13.741 6.459 88.759 14
15 1.038 .9632 .0655 .0680 15.266 14.704 6.953 102.244 15
16 1.041 .9608 .0613 .0638 16.304 15.665 7.447 116.657 16
17 1.043 .9584 .0577 .0602 17.344 16.624 7.944 131.992 17
18 1.046 .9561 .0544 .0569 18.388 17.580 8.433 148.245 18
19 1.049 .9537 .0515 .0540 19.434 18.533 8.925 165.411 19
20 1.051 .9513 .0488 .0513 20.482 19.485 9.417 183.485 20
21 1.054 .9489 .0464 .0489 21.534 20.434 9.908 202.463 21
22 1.056 .9465 .0443 .0468 22.587 21.380 10.400 222.341 22
23 1.059 .9442 .0423 .0448 23.644 22.324 10.890 243.113 23
24 1.062 .9418 .0405 .0430 24.703 23.266 11.380 264.775 24
25 1.064 .9395 .0388 .0413 25.765 24.206 11.870 287.323 25
26 1.067 .9371 .0373 .0398 26.829 25.143 12.360 310.752 26
27 1.070 .9348 .0358 .0383 27.896 26.078 12.849 335.057 27
28 1.072 .9325 .0345 .0370 28.966 27.010 13.337 360.233 28
29 1.075 .9301 .0333 .0358 30.038 27.940 13.825 386.278 29
30 1.078 .9278 .0321 .0346 31.114 28.868 14.313 413.185 30
36 1.094 .9140 .0266 .0291 37.621 34.387 17.231 592.499 36
40 1.105 .9049 .0238 .0263 42.014 38.020 19.167 728.740 40
48 1.127 .8871 .0196 .0221 50.932 45.179 23.021 1 040.055 48
50 1.133 .8826 .0188 .0213 53.189 46.947 23.980 1 125.777 50
52 1.139 .8782 .0180 .0205 55.458 48.705 24.938 1 214.588 52
60 1.162 .8609 .0155 .0180 64.647 55.653 28.751 1 600.085 60
70 1.191 .8396 .0131 .0156 76.395 64.144 33.481 2 147.611 70
72 1.197 .8355 .0127 .0152 78.780 65.817 34.422 2 265.557 72
80 1.221 .8189 .0113 .0138 88.440 72.427 38.169 2 764.457 80
84 1.233 .8108 .0107 .0132 93.343 75.682 40.033 3 029.759 84
90 1.252 .7987 .00992 .0124 100.789 80.504 42.816 3 446.870
90
96 1.271 .7869 .00923 .0117 108.349 85.255 45.584 3 886.283
96
100 1.284 .7790 .00881 .0113 113.451 88.383 47.422 4 191.242
100
104 1.297 .7713 .00843 .0109 118.605 91.480 49.252 4 505.557
104
120 1.349 .7411 .00716 .00966 139.743 103.563 56.508 5
852.112 120
240 1.821 .5492 .00305 .00555 328.306 180.312 107.586 19
398.985 240
360 2.457 .4070 .00172 .00422 582.745 237.191 152.890 36
263.930 360
480 3.315 .3016 .00108 .00358 926.074 279.343 192.670 53
820.752 480
�
�
�
�
�
�
�
�
596 APPENDIX C: COMPOUND INTEREST TABLES
1/2% Compound Interest Factors 1/2%
Single Payment Uniform Payment Series Arithmetic Gradient
Compound Present Sinking Capital Compound Present Gradient
Gradient
Amount Worth Fund Recovery Amount Worth Uniform Present
Factor Factor Factor Factor Factor Factor Series Worth
Find F Find P Find A Find A Find F Find P Find A Find P
Given P Given F Given F Given P Given A Given A GivenG
GivenG
n F/P P/F A/F A/P F/A P/A A/G P/G n
1 1.005 .9950 1.0000 1.0050 1.000 0.995 0 0 1
2 1.010 .9901 .4988 .5038 2.005 1.985 0.499 0.991 2
3 1.015 .9851 .3317 .3367 3.015 2.970 0.996 2.959 3
4 1.020 .9802 .2481 .2531 4.030 3.951 1.494 5.903 4
5 1.025 .9754 .1980 .2030 5.050 4.926 1.990 9.803 5
6 1.030 .9705 .1646 .1696 6.076 5.896 2.486 14.660 6
7 1.036 .9657 .1407 .1457 7.106 6.862 2.980 20.448 7
8 1.041 .9609 .1228 .1278 8.141 7.823 3.474 27.178 8
9 1.046 .9561 .1089 .1139 9.182 8.779 3.967 34.825 9
10 1.051 .9513 .0978 .1028 10.228 9.730 4.459 43.389 10
11 1.056 .9466 .0887 .0937 11.279 10.677 4.950 52.855 11
12 1.062 .9419 .0811 .0861 12.336 11.619 5.441 63.218 12
13 1.067 .9372 .0746 .0796 13.397 12.556 5.931 74.465 13
14 1.072 .9326 .0691 .0741 14.464 13.489 6.419 86.590 14
15 1.078 .9279 .0644 .0694 15.537 14.417 6.907 99.574 15
16 1.083 .9233 .0602 .0652 16.614 15.340 7.394 113.427 16
17 1.088 .9187 .0565 .0615 17.697 16.259 7.880 128.125 17
18 1.094 .9141 .0532 .0582 18.786 17.173 8.366 143.668 18
19 1.099 .9096 .0503 .0553 19.880 18.082 8.850 160.037 19
20 1.105 .9051 .0477 .0527 20.979 18.987 9.334 177.237 20
21 1.110 .9006 .0453 .0503 22.084 19.888 9.817 195.245 21
22 1.116 .8961 .0431 .0481 23.194 20.784 10.300 214.070 22
23 1.122 .8916 .0411 .0461 24.310 21.676 10.781 233.680 23
24 1.127 .8872 .0393 .0443 25.432 22.563 11.261 254.088 24
25 1.133 .8828 .0377 .0427 26.559 23.446 11.741 275.273 25
26 1.138 .8784 .0361 .0411 27.692 24.324 12.220 297.233 26
27 1.144 .8740 .0347 .0397 28.830 25.198 12.698 319.955 27
28 1.150 .8697 .0334 .0384 29.975 26.068 13.175 343.439 28
29 1.156 .8653 .0321 .0371 31.124 26.933 13.651 367.672 29
30 1.161 .8610 .0310 .0360 32.280 27.794 14.127 392.640 30
36 1.197 .8356 .0254 .0304 39.336 32.871 16.962 557.564 36
40 1.221 .8191 .0226 .0276 44.159 36.172 18.836 681.341 40
48 1.270 .7871 .0185 .0235 54.098 42.580 22.544 959.928 48
50 1.283 .7793 .0177 .0227 56.645 44.143 23.463 1 035.70 50
52 1.296 .7716 .0169 .0219 59.218 45.690 24.378 1 113.82 52
60 1.349 .7414 .0143 .0193 69.770 51.726 28.007 1 448.65 60
70 1.418 .7053 .0120 .0170 83.566 58.939 32.468 1 913.65 70
72 1.432 .6983 .0116 .0166 86.409 60.340 33.351 2 012.35 72
80 1.490 .6710 .0102 .0152 98.068 65.802 36.848 2 424.65 80
84 1.520 .6577 .00961 .0146 104.074 68.453 38.576 2 640.67 84
90 1.567 .6383 .00883 .0138 113.311 72.331 41.145 2 976.08 90
96 1.614 .6195 .00814 .0131 122.829 76.095 43.685 3 324.19 96
100 1.647 .6073 .00773 .0127 129.334 78.543 45.361 3 562.80
100
104 1.680 .5953 .00735 .0124 135.970 80.942 47.025 3 806.29
104
120 1.819 .5496 .00610 .0111 163.880 90.074 53.551 4 823.52
120
240 3.310 .3021 .00216 .00716 462.041 139.581 96.113 13
415.56 240
360 6.023 .1660 .00100 .00600 1 004.5 166.792 128.324 21
403.32 360
480 10.957 .0913 .00050 .00550 1 991.5 181.748 151.795 27
588.37 480
�
�
�
�
�
�
�
�
APPENDIX C: COMPOUND INTEREST TABLES 597
3/4% Compound Interest Factors 3/4%
Single Payment Uniform Payment Series Arithmetic Gradient
Compound Present Sinking Capital Compound Present Gradient
Gradient
Amount Worth Fund Recovery Amount Worth Uniform Present
Factor Factor Factor Factor Factor Factor Series Worth
Find F Find P Find A Find A Find F Find P Find A Find P
Given P Given F Given F Given P Given A Given A Given G
Given G
n F/P P/F A/F A/P F/A P/A A/G P/G n
1 1.008 .9926 1.0000 1.0075 1.000 0.993 0 0 1
2 1.015 .9852 .4981 .5056 2.008 1.978 0.499 0.987 2
3 1.023 .9778 .3308 .3383 3.023 2.956 0.996 2.943 3
4 1.030 .9706 .2472 .2547 4.045 3.926 1.492 5.857 4
5 1.038 .9633 .1970 .2045 5.076 4.889 1.986 9.712 5
6 1.046 .9562 .1636 .1711 6.114 5.846 2.479 14.494 6
7 1.054 .9490 .1397 .1472 7.160 6.795 2.971 20.187 7
8 1.062 .9420 .1218 .1293 8.213 7.737 3.462 26.785 8
9 1.070 .9350 .1078 .1153 9.275 8.672 3.951 34.265 9
10 1.078 .9280 .0967 .1042 10.344 9.600 4.440 42.619 10
11 1.086 .9211 .0876 .0951 11.422 10.521 4.927 51.831 11
12 1.094 .9142 .0800 .0875 12.508 11.435 5.412 61.889 12
13 1.102 .9074 .0735 .0810 13.602 12.342 5.897 72.779 13
14 1.110 .9007 .0680 .0755 14.704 13.243 6.380 84.491 14
15 1.119 .8940 .0632 .0707 15.814 14.137 6.862 97.005 15
16 1.127 .8873 .0591 .0666 16.932 15.024 7.343 110.318 16
17 1.135 .8807 .0554 .0629 18.059 15.905 7.822 124.410 17
18 1.144 .8742 .0521 .0596 19.195 16.779 8.300 139.273 18
19 1.153 .8676 .0492 .0567 20.339 17.647 8.777 154.891 19
20 1.161 .8612 .0465 .0540 21.491 18.508 9.253 171.254 20
21 1.170 .8548 .0441 .0516 22.653 19.363 9.727 188.352 21
22 1.179 .8484 .0420 .0495 23.823 20.211 10.201 206.170 22
23 1.188 .8421 .0400 .0475 25.001 21.053 10.673 224.695 23
24 1.196 .8358 .0382 .0457 26.189 21.889 11.143 243.924 24
25 1.205 .8296 .0365 .0440 27.385 22.719 11.613 263.834 25
26 1.214 .8234 .0350 .0425 28.591 23.542 12.081 284.421 26
27 1.224 .8173 .0336 .0411 29.805 24.360 12.548 305.672 27
28 1.233 .8112 .0322 .0397 31.029 25.171 13.014 327.576 28
29 1.242 .8052 .0310 .0385 32.261 25.976 13.479 350.122 29
30 1.251 .7992 .0298 .0373 33.503 26.775 13.942 373.302 30
36 1.309 .7641 .0243 .0318 41.153 31.447 16.696 525.038 36
40 1.348 .7416 .0215 .0290 46.447 34.447 18.507 637.519 40
48 1.431 .6986 .0174 .0249 57.521 40.185 22.070 886.899 48
50 1.453 .6882 .0166 .0241 60.395 41.567 22.949 953.911 50
52 1.475 .6780 .0158 .0233 63.312 42.928 23.822 1 022.64 52
60 1.566 .6387 .0133 .0208 75.425 48.174 27.268 1 313.59 60
70 1.687 .5927 .0109 .0184 91.621 54.305 31.465 1 708.68 70
72 1.713 .5839 .0105 .0180 95.008 55.477 32.289 1 791.33 72
80 1.818 .5500 .00917 .0167 109.074 59.995 35.540 2 132.23 80
84 1.873 .5338 .00859 .0161 116.428 62.154 37.137 2 308.22 84
90 1.959 .5104 .00782 .0153 127.881 65.275 39.496 2 578.09 90
96 2.049 .4881 .00715 .0147 139.858 68.259 41.812 2 854.04 96
100 2.111 .4737 .00675 .0143 148.147 70.175 43.332 3 040.85
100
104 2.175 .4597 .00638 .0139 156.687 72.035 44.834 3 229.60
104
120 2.451 .4079 .00517 .0127 193.517 78.942 50.653 3 998.68
120
240 6.009 .1664 .00150 .00900 667.901 111.145 85.422 9
494.26 240
360 14.731 .0679 .00055 .00805 1 830.8 124.282 107.115 13
312.50 360
480 36.111 .0277 .00021 .00771 4 681.5 129.641 119.662 15
513.16 480
�
�
�
�
�
�
  APRIL 22, 2013, 1123 P.M. After a hectic day, an exhausted .docx
  APRIL 22, 2013, 1123 P.M. After a hectic day, an exhausted .docx
  APRIL 22, 2013, 1123 P.M. After a hectic day, an exhausted .docx
  APRIL 22, 2013, 1123 P.M. After a hectic day, an exhausted .docx
  APRIL 22, 2013, 1123 P.M. After a hectic day, an exhausted .docx
  APRIL 22, 2013, 1123 P.M. After a hectic day, an exhausted .docx
  APRIL 22, 2013, 1123 P.M. After a hectic day, an exhausted .docx
  APRIL 22, 2013, 1123 P.M. After a hectic day, an exhausted .docx
  APRIL 22, 2013, 1123 P.M. After a hectic day, an exhausted .docx
  APRIL 22, 2013, 1123 P.M. After a hectic day, an exhausted .docx
  APRIL 22, 2013, 1123 P.M. After a hectic day, an exhausted .docx
  APRIL 22, 2013, 1123 P.M. After a hectic day, an exhausted .docx
  APRIL 22, 2013, 1123 P.M. After a hectic day, an exhausted .docx
  APRIL 22, 2013, 1123 P.M. After a hectic day, an exhausted .docx
  APRIL 22, 2013, 1123 P.M. After a hectic day, an exhausted .docx
  APRIL 22, 2013, 1123 P.M. After a hectic day, an exhausted .docx
  APRIL 22, 2013, 1123 P.M. After a hectic day, an exhausted .docx
  APRIL 22, 2013, 1123 P.M. After a hectic day, an exhausted .docx
  APRIL 22, 2013, 1123 P.M. After a hectic day, an exhausted .docx
  APRIL 22, 2013, 1123 P.M. After a hectic day, an exhausted .docx
  APRIL 22, 2013, 1123 P.M. After a hectic day, an exhausted .docx
  APRIL 22, 2013, 1123 P.M. After a hectic day, an exhausted .docx
  APRIL 22, 2013, 1123 P.M. After a hectic day, an exhausted .docx
  APRIL 22, 2013, 1123 P.M. After a hectic day, an exhausted .docx
  APRIL 22, 2013, 1123 P.M. After a hectic day, an exhausted .docx
  APRIL 22, 2013, 1123 P.M. After a hectic day, an exhausted .docx
  APRIL 22, 2013, 1123 P.M. After a hectic day, an exhausted .docx
  APRIL 22, 2013, 1123 P.M. After a hectic day, an exhausted .docx
  APRIL 22, 2013, 1123 P.M. After a hectic day, an exhausted .docx
  APRIL 22, 2013, 1123 P.M. After a hectic day, an exhausted .docx
  APRIL 22, 2013, 1123 P.M. After a hectic day, an exhausted .docx
  APRIL 22, 2013, 1123 P.M. After a hectic day, an exhausted .docx
  APRIL 22, 2013, 1123 P.M. After a hectic day, an exhausted .docx
  APRIL 22, 2013, 1123 P.M. After a hectic day, an exhausted .docx
  APRIL 22, 2013, 1123 P.M. After a hectic day, an exhausted .docx
  APRIL 22, 2013, 1123 P.M. After a hectic day, an exhausted .docx
  APRIL 22, 2013, 1123 P.M. After a hectic day, an exhausted .docx
  APRIL 22, 2013, 1123 P.M. After a hectic day, an exhausted .docx
  APRIL 22, 2013, 1123 P.M. After a hectic day, an exhausted .docx
  APRIL 22, 2013, 1123 P.M. After a hectic day, an exhausted .docx
  APRIL 22, 2013, 1123 P.M. After a hectic day, an exhausted .docx
  APRIL 22, 2013, 1123 P.M. After a hectic day, an exhausted .docx
  APRIL 22, 2013, 1123 P.M. After a hectic day, an exhausted .docx
  APRIL 22, 2013, 1123 P.M. After a hectic day, an exhausted .docx
  APRIL 22, 2013, 1123 P.M. After a hectic day, an exhausted .docx
  APRIL 22, 2013, 1123 P.M. After a hectic day, an exhausted .docx
  APRIL 22, 2013, 1123 P.M. After a hectic day, an exhausted .docx
  APRIL 22, 2013, 1123 P.M. After a hectic day, an exhausted .docx
  APRIL 22, 2013, 1123 P.M. After a hectic day, an exhausted .docx
  APRIL 22, 2013, 1123 P.M. After a hectic day, an exhausted .docx
  APRIL 22, 2013, 1123 P.M. After a hectic day, an exhausted .docx
  APRIL 22, 2013, 1123 P.M. After a hectic day, an exhausted .docx
  APRIL 22, 2013, 1123 P.M. After a hectic day, an exhausted .docx
  APRIL 22, 2013, 1123 P.M. After a hectic day, an exhausted .docx
  APRIL 22, 2013, 1123 P.M. After a hectic day, an exhausted .docx
  APRIL 22, 2013, 1123 P.M. After a hectic day, an exhausted .docx
  APRIL 22, 2013, 1123 P.M. After a hectic day, an exhausted .docx
  APRIL 22, 2013, 1123 P.M. After a hectic day, an exhausted .docx
  APRIL 22, 2013, 1123 P.M. After a hectic day, an exhausted .docx
  APRIL 22, 2013, 1123 P.M. After a hectic day, an exhausted .docx
  APRIL 22, 2013, 1123 P.M. After a hectic day, an exhausted .docx
  APRIL 22, 2013, 1123 P.M. After a hectic day, an exhausted .docx
  APRIL 22, 2013, 1123 P.M. After a hectic day, an exhausted .docx
  APRIL 22, 2013, 1123 P.M. After a hectic day, an exhausted .docx
  APRIL 22, 2013, 1123 P.M. After a hectic day, an exhausted .docx
  APRIL 22, 2013, 1123 P.M. After a hectic day, an exhausted .docx
  APRIL 22, 2013, 1123 P.M. After a hectic day, an exhausted .docx
  APRIL 22, 2013, 1123 P.M. After a hectic day, an exhausted .docx
  APRIL 22, 2013, 1123 P.M. After a hectic day, an exhausted .docx
  APRIL 22, 2013, 1123 P.M. After a hectic day, an exhausted .docx
  APRIL 22, 2013, 1123 P.M. After a hectic day, an exhausted .docx

More Related Content

Similar to APRIL 22, 2013, 1123 P.M. After a hectic day, an exhausted .docx

WAC IndividualWritten Analysis of the Case Apple Inc. Managing .docx
WAC IndividualWritten Analysis of the Case Apple Inc. Managing .docxWAC IndividualWritten Analysis of the Case Apple Inc. Managing .docx
WAC IndividualWritten Analysis of the Case Apple Inc. Managing .docxcelenarouzie
 
W14161APPLE INC. MANAGING A GLOBAL SUPPLY CHAIN1K.docx
    W14161APPLE INC. MANAGING A GLOBAL SUPPLY CHAIN1K.docx    W14161APPLE INC. MANAGING A GLOBAL SUPPLY CHAIN1K.docx
W14161APPLE INC. MANAGING A GLOBAL SUPPLY CHAIN1K.docxjoyjonna282
 
Apple inc. document
Apple inc. document Apple inc. document
Apple inc. document AkramMad1
 
Headquartered in Cupertino, California, Apple Inc. experienced many c.pdf
Headquartered in Cupertino, California, Apple Inc. experienced many c.pdfHeadquartered in Cupertino, California, Apple Inc. experienced many c.pdf
Headquartered in Cupertino, California, Apple Inc. experienced many c.pdffaizul123
 
W14161 APPLE INC. MANAGING A GLOBAL SUPPLY CHAIN1.docx
     W14161 APPLE INC. MANAGING A GLOBAL SUPPLY CHAIN1.docx     W14161 APPLE INC. MANAGING A GLOBAL SUPPLY CHAIN1.docx
W14161 APPLE INC. MANAGING A GLOBAL SUPPLY CHAIN1.docxShiraPrater50
 
Personal Computer Company At Apple
Personal Computer Company At ApplePersonal Computer Company At Apple
Personal Computer Company At AppleCamella Taylor
 
Steve Wozniak And The Apple Computer Essay
Steve Wozniak And The Apple Computer EssaySteve Wozniak And The Apple Computer Essay
Steve Wozniak And The Apple Computer EssayLisa Martinez
 
Case analysis on successful and unsuccessful entrepreneur
Case analysis on successful and unsuccessful entrepreneurCase analysis on successful and unsuccessful entrepreneur
Case analysis on successful and unsuccessful entrepreneurthakkar kathan
 
14459393 major-project-report-on-apple-inc (1)
14459393 major-project-report-on-apple-inc (1)14459393 major-project-report-on-apple-inc (1)
14459393 major-project-report-on-apple-inc (1)Gorakhanath Patil
 
CASE 16 APPLE INC. STILL TAKING A BITE OUT OF THE COMPETIT.docx
CASE 16  APPLE INC. STILL TAKING A BITE OUT OF THE COMPETIT.docxCASE 16  APPLE INC. STILL TAKING A BITE OUT OF THE COMPETIT.docx
CASE 16 APPLE INC. STILL TAKING A BITE OUT OF THE COMPETIT.docxjasoninnes20
 
International marketing of apple final
International marketing of apple finalInternational marketing of apple final
International marketing of apple finalJiten Menghani
 
Apple Inc. Innovation Timeline
Apple Inc. Innovation Timeline Apple Inc. Innovation Timeline
Apple Inc. Innovation Timeline Motaz Agamawi
 
Apple Case Questions for Marketing Strategy
Apple Case Questions for Marketing StrategyApple Case Questions for Marketing Strategy
Apple Case Questions for Marketing StrategyCory Kemp
 
Please revise the answer bellow.Q1. What historically have been Ap.pdf
Please revise the answer bellow.Q1. What historically have been Ap.pdfPlease revise the answer bellow.Q1. What historically have been Ap.pdf
Please revise the answer bellow.Q1. What historically have been Ap.pdffathimalinks
 

Similar to APRIL 22, 2013, 1123 P.M. After a hectic day, an exhausted .docx (20)

WAC IndividualWritten Analysis of the Case Apple Inc. Managing .docx
WAC IndividualWritten Analysis of the Case Apple Inc. Managing .docxWAC IndividualWritten Analysis of the Case Apple Inc. Managing .docx
WAC IndividualWritten Analysis of the Case Apple Inc. Managing .docx
 
W14161APPLE INC. MANAGING A GLOBAL SUPPLY CHAIN1K.docx
    W14161APPLE INC. MANAGING A GLOBAL SUPPLY CHAIN1K.docx    W14161APPLE INC. MANAGING A GLOBAL SUPPLY CHAIN1K.docx
W14161APPLE INC. MANAGING A GLOBAL SUPPLY CHAIN1K.docx
 
Apple inc. document
Apple inc. document Apple inc. document
Apple inc. document
 
Headquartered in Cupertino, California, Apple Inc. experienced many c.pdf
Headquartered in Cupertino, California, Apple Inc. experienced many c.pdfHeadquartered in Cupertino, California, Apple Inc. experienced many c.pdf
Headquartered in Cupertino, California, Apple Inc. experienced many c.pdf
 
Apple inc
Apple incApple inc
Apple inc
 
W14161 APPLE INC. MANAGING A GLOBAL SUPPLY CHAIN1.docx
     W14161 APPLE INC. MANAGING A GLOBAL SUPPLY CHAIN1.docx     W14161 APPLE INC. MANAGING A GLOBAL SUPPLY CHAIN1.docx
W14161 APPLE INC. MANAGING A GLOBAL SUPPLY CHAIN1.docx
 
Personal Computer Company At Apple
Personal Computer Company At ApplePersonal Computer Company At Apple
Personal Computer Company At Apple
 
Case Study #5 Appple
Case Study #5 ApppleCase Study #5 Appple
Case Study #5 Appple
 
Steve Wozniak And The Apple Computer Essay
Steve Wozniak And The Apple Computer EssaySteve Wozniak And The Apple Computer Essay
Steve Wozniak And The Apple Computer Essay
 
Case analysis on successful and unsuccessful entrepreneur
Case analysis on successful and unsuccessful entrepreneurCase analysis on successful and unsuccessful entrepreneur
Case analysis on successful and unsuccessful entrepreneur
 
14459393 major-project-report-on-apple-inc (1)
14459393 major-project-report-on-apple-inc (1)14459393 major-project-report-on-apple-inc (1)
14459393 major-project-report-on-apple-inc (1)
 
Apple
AppleApple
Apple
 
CASE 16 APPLE INC. STILL TAKING A BITE OUT OF THE COMPETIT.docx
CASE 16  APPLE INC. STILL TAKING A BITE OUT OF THE COMPETIT.docxCASE 16  APPLE INC. STILL TAKING A BITE OUT OF THE COMPETIT.docx
CASE 16 APPLE INC. STILL TAKING A BITE OUT OF THE COMPETIT.docx
 
International marketing of apple final
International marketing of apple finalInternational marketing of apple final
International marketing of apple final
 
Apple Inc. Innovation Timeline
Apple Inc. Innovation Timeline Apple Inc. Innovation Timeline
Apple Inc. Innovation Timeline
 
Apple Case Questions for Marketing Strategy
Apple Case Questions for Marketing StrategyApple Case Questions for Marketing Strategy
Apple Case Questions for Marketing Strategy
 
Apple
AppleApple
Apple
 
Apple
AppleApple
Apple
 
Apple
AppleApple
Apple
 
Please revise the answer bellow.Q1. What historically have been Ap.pdf
Please revise the answer bellow.Q1. What historically have been Ap.pdfPlease revise the answer bellow.Q1. What historically have been Ap.pdf
Please revise the answer bellow.Q1. What historically have been Ap.pdf
 

More from ShiraPrater50

Read Chapter 3. Answer the following questions1.Wha.docx
Read Chapter 3. Answer the following questions1.Wha.docxRead Chapter 3. Answer the following questions1.Wha.docx
Read Chapter 3. Answer the following questions1.Wha.docxShiraPrater50
 
Read Chapter 15 and answer the following questions 1.  De.docx
Read Chapter 15 and answer the following questions 1.  De.docxRead Chapter 15 and answer the following questions 1.  De.docx
Read Chapter 15 and answer the following questions 1.  De.docxShiraPrater50
 
Read Chapter 2 and answer the following questions1.  List .docx
Read Chapter 2 and answer the following questions1.  List .docxRead Chapter 2 and answer the following questions1.  List .docx
Read Chapter 2 and answer the following questions1.  List .docxShiraPrater50
 
Read chapter 7 and write the book report  The paper should be .docx
Read chapter 7 and write the book report  The paper should be .docxRead chapter 7 and write the book report  The paper should be .docx
Read chapter 7 and write the book report  The paper should be .docxShiraPrater50
 
Read Chapter 7 and answer the following questions1.  What a.docx
Read Chapter 7 and answer the following questions1.  What a.docxRead Chapter 7 and answer the following questions1.  What a.docx
Read Chapter 7 and answer the following questions1.  What a.docxShiraPrater50
 
Read chapter 14, 15 and 18 of the class textbook.Saucier.docx
Read chapter 14, 15 and 18 of the class textbook.Saucier.docxRead chapter 14, 15 and 18 of the class textbook.Saucier.docx
Read chapter 14, 15 and 18 of the class textbook.Saucier.docxShiraPrater50
 
Read Chapter 10 APA FORMAT1. In the last century, what historica.docx
Read Chapter 10 APA FORMAT1. In the last century, what historica.docxRead Chapter 10 APA FORMAT1. In the last century, what historica.docx
Read Chapter 10 APA FORMAT1. In the last century, what historica.docxShiraPrater50
 
Read chapter 7 and write the book report  The paper should b.docx
Read chapter 7 and write the book report  The paper should b.docxRead chapter 7 and write the book report  The paper should b.docx
Read chapter 7 and write the book report  The paper should b.docxShiraPrater50
 
Read Chapter 14 and answer the following questions1.  Explain t.docx
Read Chapter 14 and answer the following questions1.  Explain t.docxRead Chapter 14 and answer the following questions1.  Explain t.docx
Read Chapter 14 and answer the following questions1.  Explain t.docxShiraPrater50
 
Read Chapter 2 first. Then come to this assignment.The first t.docx
Read Chapter 2 first. Then come to this assignment.The first t.docxRead Chapter 2 first. Then come to this assignment.The first t.docx
Read Chapter 2 first. Then come to this assignment.The first t.docxShiraPrater50
 
Journal of Public Affairs Education 515Teaching Grammar a.docx
 Journal of Public Affairs Education 515Teaching Grammar a.docx Journal of Public Affairs Education 515Teaching Grammar a.docx
Journal of Public Affairs Education 515Teaching Grammar a.docxShiraPrater50
 
Learner Guide TLIR5014 Manage suppliers TLIR.docx
 Learner Guide TLIR5014 Manage suppliers TLIR.docx Learner Guide TLIR5014 Manage suppliers TLIR.docx
Learner Guide TLIR5014 Manage suppliers TLIR.docxShiraPrater50
 
Lab 5 Nessus Vulnerability Scan Report © 2012 by Jone.docx
 Lab 5 Nessus Vulnerability Scan Report © 2012 by Jone.docx Lab 5 Nessus Vulnerability Scan Report © 2012 by Jone.docx
Lab 5 Nessus Vulnerability Scan Report © 2012 by Jone.docxShiraPrater50
 
Leveled and Exclusionary Tracking English Learners Acce.docx
 Leveled and Exclusionary Tracking English Learners Acce.docx Leveled and Exclusionary Tracking English Learners Acce.docx
Leveled and Exclusionary Tracking English Learners Acce.docxShiraPrater50
 
Lab 5 Nessus Vulnerability Scan Report © 2015 by Jone.docx
 Lab 5 Nessus Vulnerability Scan Report © 2015 by Jone.docx Lab 5 Nessus Vulnerability Scan Report © 2015 by Jone.docx
Lab 5 Nessus Vulnerability Scan Report © 2015 by Jone.docxShiraPrater50
 
MBA 6941, Managing Project Teams 1 Course Learning Ou.docx
 MBA 6941, Managing Project Teams 1 Course Learning Ou.docx MBA 6941, Managing Project Teams 1 Course Learning Ou.docx
MBA 6941, Managing Project Teams 1 Course Learning Ou.docxShiraPrater50
 
Inventory Decisions in Dells Supply ChainAuthor(s) Ro.docx
 Inventory Decisions in Dells Supply ChainAuthor(s) Ro.docx Inventory Decisions in Dells Supply ChainAuthor(s) Ro.docx
Inventory Decisions in Dells Supply ChainAuthor(s) Ro.docxShiraPrater50
 
It’s Your Choice 10 – Clear Values 2nd Chain Link- Trade-offs .docx
 It’s Your Choice 10 – Clear Values 2nd Chain Link- Trade-offs .docx It’s Your Choice 10 – Clear Values 2nd Chain Link- Trade-offs .docx
It’s Your Choice 10 – Clear Values 2nd Chain Link- Trade-offs .docxShiraPrater50
 
MBA 5101, Strategic Management and Business Policy 1 .docx
 MBA 5101, Strategic Management and Business Policy 1 .docx MBA 5101, Strategic Management and Business Policy 1 .docx
MBA 5101, Strategic Management and Business Policy 1 .docxShiraPrater50
 
MAJOR WORLD RELIGIONSJudaismJudaism (began .docx
 MAJOR WORLD RELIGIONSJudaismJudaism (began .docx MAJOR WORLD RELIGIONSJudaismJudaism (began .docx
MAJOR WORLD RELIGIONSJudaismJudaism (began .docxShiraPrater50
 

More from ShiraPrater50 (20)

Read Chapter 3. Answer the following questions1.Wha.docx
Read Chapter 3. Answer the following questions1.Wha.docxRead Chapter 3. Answer the following questions1.Wha.docx
Read Chapter 3. Answer the following questions1.Wha.docx
 
Read Chapter 15 and answer the following questions 1.  De.docx
Read Chapter 15 and answer the following questions 1.  De.docxRead Chapter 15 and answer the following questions 1.  De.docx
Read Chapter 15 and answer the following questions 1.  De.docx
 
Read Chapter 2 and answer the following questions1.  List .docx
Read Chapter 2 and answer the following questions1.  List .docxRead Chapter 2 and answer the following questions1.  List .docx
Read Chapter 2 and answer the following questions1.  List .docx
 
Read chapter 7 and write the book report  The paper should be .docx
Read chapter 7 and write the book report  The paper should be .docxRead chapter 7 and write the book report  The paper should be .docx
Read chapter 7 and write the book report  The paper should be .docx
 
Read Chapter 7 and answer the following questions1.  What a.docx
Read Chapter 7 and answer the following questions1.  What a.docxRead Chapter 7 and answer the following questions1.  What a.docx
Read Chapter 7 and answer the following questions1.  What a.docx
 
Read chapter 14, 15 and 18 of the class textbook.Saucier.docx
Read chapter 14, 15 and 18 of the class textbook.Saucier.docxRead chapter 14, 15 and 18 of the class textbook.Saucier.docx
Read chapter 14, 15 and 18 of the class textbook.Saucier.docx
 
Read Chapter 10 APA FORMAT1. In the last century, what historica.docx
Read Chapter 10 APA FORMAT1. In the last century, what historica.docxRead Chapter 10 APA FORMAT1. In the last century, what historica.docx
Read Chapter 10 APA FORMAT1. In the last century, what historica.docx
 
Read chapter 7 and write the book report  The paper should b.docx
Read chapter 7 and write the book report  The paper should b.docxRead chapter 7 and write the book report  The paper should b.docx
Read chapter 7 and write the book report  The paper should b.docx
 
Read Chapter 14 and answer the following questions1.  Explain t.docx
Read Chapter 14 and answer the following questions1.  Explain t.docxRead Chapter 14 and answer the following questions1.  Explain t.docx
Read Chapter 14 and answer the following questions1.  Explain t.docx
 
Read Chapter 2 first. Then come to this assignment.The first t.docx
Read Chapter 2 first. Then come to this assignment.The first t.docxRead Chapter 2 first. Then come to this assignment.The first t.docx
Read Chapter 2 first. Then come to this assignment.The first t.docx
 
Journal of Public Affairs Education 515Teaching Grammar a.docx
 Journal of Public Affairs Education 515Teaching Grammar a.docx Journal of Public Affairs Education 515Teaching Grammar a.docx
Journal of Public Affairs Education 515Teaching Grammar a.docx
 
Learner Guide TLIR5014 Manage suppliers TLIR.docx
 Learner Guide TLIR5014 Manage suppliers TLIR.docx Learner Guide TLIR5014 Manage suppliers TLIR.docx
Learner Guide TLIR5014 Manage suppliers TLIR.docx
 
Lab 5 Nessus Vulnerability Scan Report © 2012 by Jone.docx
 Lab 5 Nessus Vulnerability Scan Report © 2012 by Jone.docx Lab 5 Nessus Vulnerability Scan Report © 2012 by Jone.docx
Lab 5 Nessus Vulnerability Scan Report © 2012 by Jone.docx
 
Leveled and Exclusionary Tracking English Learners Acce.docx
 Leveled and Exclusionary Tracking English Learners Acce.docx Leveled and Exclusionary Tracking English Learners Acce.docx
Leveled and Exclusionary Tracking English Learners Acce.docx
 
Lab 5 Nessus Vulnerability Scan Report © 2015 by Jone.docx
 Lab 5 Nessus Vulnerability Scan Report © 2015 by Jone.docx Lab 5 Nessus Vulnerability Scan Report © 2015 by Jone.docx
Lab 5 Nessus Vulnerability Scan Report © 2015 by Jone.docx
 
MBA 6941, Managing Project Teams 1 Course Learning Ou.docx
 MBA 6941, Managing Project Teams 1 Course Learning Ou.docx MBA 6941, Managing Project Teams 1 Course Learning Ou.docx
MBA 6941, Managing Project Teams 1 Course Learning Ou.docx
 
Inventory Decisions in Dells Supply ChainAuthor(s) Ro.docx
 Inventory Decisions in Dells Supply ChainAuthor(s) Ro.docx Inventory Decisions in Dells Supply ChainAuthor(s) Ro.docx
Inventory Decisions in Dells Supply ChainAuthor(s) Ro.docx
 
It’s Your Choice 10 – Clear Values 2nd Chain Link- Trade-offs .docx
 It’s Your Choice 10 – Clear Values 2nd Chain Link- Trade-offs .docx It’s Your Choice 10 – Clear Values 2nd Chain Link- Trade-offs .docx
It’s Your Choice 10 – Clear Values 2nd Chain Link- Trade-offs .docx
 
MBA 5101, Strategic Management and Business Policy 1 .docx
 MBA 5101, Strategic Management and Business Policy 1 .docx MBA 5101, Strategic Management and Business Policy 1 .docx
MBA 5101, Strategic Management and Business Policy 1 .docx
 
MAJOR WORLD RELIGIONSJudaismJudaism (began .docx
 MAJOR WORLD RELIGIONSJudaismJudaism (began .docx MAJOR WORLD RELIGIONSJudaismJudaism (began .docx
MAJOR WORLD RELIGIONSJudaismJudaism (began .docx
 

Recently uploaded

Capitol Tech U Doctoral Presentation - April 2024.pptx
Capitol Tech U Doctoral Presentation - April 2024.pptxCapitol Tech U Doctoral Presentation - April 2024.pptx
Capitol Tech U Doctoral Presentation - April 2024.pptxCapitolTechU
 
Introduction to AI in Higher Education_draft.pptx
Introduction to AI in Higher Education_draft.pptxIntroduction to AI in Higher Education_draft.pptx
Introduction to AI in Higher Education_draft.pptxpboyjonauth
 
Full Stack Web Development Course for Beginners
Full Stack Web Development Course  for BeginnersFull Stack Web Development Course  for Beginners
Full Stack Web Development Course for BeginnersSabitha Banu
 
Enzyme, Pharmaceutical Aids, Miscellaneous Last Part of Chapter no 5th.pdf
Enzyme, Pharmaceutical Aids, Miscellaneous Last Part of Chapter no 5th.pdfEnzyme, Pharmaceutical Aids, Miscellaneous Last Part of Chapter no 5th.pdf
Enzyme, Pharmaceutical Aids, Miscellaneous Last Part of Chapter no 5th.pdfSumit Tiwari
 
MICROBIOLOGY biochemical test detailed.pptx
MICROBIOLOGY biochemical test detailed.pptxMICROBIOLOGY biochemical test detailed.pptx
MICROBIOLOGY biochemical test detailed.pptxabhijeetpadhi001
 
Painted Grey Ware.pptx, PGW Culture of India
Painted Grey Ware.pptx, PGW Culture of IndiaPainted Grey Ware.pptx, PGW Culture of India
Painted Grey Ware.pptx, PGW Culture of IndiaVirag Sontakke
 
ECONOMIC CONTEXT - PAPER 1 Q3: NEWSPAPERS.pptx
ECONOMIC CONTEXT - PAPER 1 Q3: NEWSPAPERS.pptxECONOMIC CONTEXT - PAPER 1 Q3: NEWSPAPERS.pptx
ECONOMIC CONTEXT - PAPER 1 Q3: NEWSPAPERS.pptxiammrhaywood
 
Proudly South Africa powerpoint Thorisha.pptx
Proudly South Africa powerpoint Thorisha.pptxProudly South Africa powerpoint Thorisha.pptx
Proudly South Africa powerpoint Thorisha.pptxthorishapillay1
 
Blooming Together_ Growing a Community Garden Worksheet.docx
Blooming Together_ Growing a Community Garden Worksheet.docxBlooming Together_ Growing a Community Garden Worksheet.docx
Blooming Together_ Growing a Community Garden Worksheet.docxUnboundStockton
 
Procuring digital preservation CAN be quick and painless with our new dynamic...
Procuring digital preservation CAN be quick and painless with our new dynamic...Procuring digital preservation CAN be quick and painless with our new dynamic...
Procuring digital preservation CAN be quick and painless with our new dynamic...Jisc
 
ECONOMIC CONTEXT - LONG FORM TV DRAMA - PPT
ECONOMIC CONTEXT - LONG FORM TV DRAMA - PPTECONOMIC CONTEXT - LONG FORM TV DRAMA - PPT
ECONOMIC CONTEXT - LONG FORM TV DRAMA - PPTiammrhaywood
 
DATA STRUCTURE AND ALGORITHM for beginners
DATA STRUCTURE AND ALGORITHM for beginnersDATA STRUCTURE AND ALGORITHM for beginners
DATA STRUCTURE AND ALGORITHM for beginnersSabitha Banu
 
Hierarchy of management that covers different levels of management
Hierarchy of management that covers different levels of managementHierarchy of management that covers different levels of management
Hierarchy of management that covers different levels of managementmkooblal
 
Gas measurement O2,Co2,& ph) 04/2024.pptx
Gas measurement O2,Co2,& ph) 04/2024.pptxGas measurement O2,Co2,& ph) 04/2024.pptx
Gas measurement O2,Co2,& ph) 04/2024.pptxDr.Ibrahim Hassaan
 
Introduction to ArtificiaI Intelligence in Higher Education
Introduction to ArtificiaI Intelligence in Higher EducationIntroduction to ArtificiaI Intelligence in Higher Education
Introduction to ArtificiaI Intelligence in Higher Educationpboyjonauth
 
Roles & Responsibilities in Pharmacovigilance
Roles & Responsibilities in PharmacovigilanceRoles & Responsibilities in Pharmacovigilance
Roles & Responsibilities in PharmacovigilanceSamikshaHamane
 
“Oh GOSH! Reflecting on Hackteria's Collaborative Practices in a Global Do-It...
“Oh GOSH! Reflecting on Hackteria's Collaborative Practices in a Global Do-It...“Oh GOSH! Reflecting on Hackteria's Collaborative Practices in a Global Do-It...
“Oh GOSH! Reflecting on Hackteria's Collaborative Practices in a Global Do-It...Marc Dusseiller Dusjagr
 
POINT- BIOCHEMISTRY SEM 2 ENZYMES UNIT 5.pptx
POINT- BIOCHEMISTRY SEM 2 ENZYMES UNIT 5.pptxPOINT- BIOCHEMISTRY SEM 2 ENZYMES UNIT 5.pptx
POINT- BIOCHEMISTRY SEM 2 ENZYMES UNIT 5.pptxSayali Powar
 

Recently uploaded (20)

Capitol Tech U Doctoral Presentation - April 2024.pptx
Capitol Tech U Doctoral Presentation - April 2024.pptxCapitol Tech U Doctoral Presentation - April 2024.pptx
Capitol Tech U Doctoral Presentation - April 2024.pptx
 
Introduction to AI in Higher Education_draft.pptx
Introduction to AI in Higher Education_draft.pptxIntroduction to AI in Higher Education_draft.pptx
Introduction to AI in Higher Education_draft.pptx
 
Full Stack Web Development Course for Beginners
Full Stack Web Development Course  for BeginnersFull Stack Web Development Course  for Beginners
Full Stack Web Development Course for Beginners
 
Enzyme, Pharmaceutical Aids, Miscellaneous Last Part of Chapter no 5th.pdf
Enzyme, Pharmaceutical Aids, Miscellaneous Last Part of Chapter no 5th.pdfEnzyme, Pharmaceutical Aids, Miscellaneous Last Part of Chapter no 5th.pdf
Enzyme, Pharmaceutical Aids, Miscellaneous Last Part of Chapter no 5th.pdf
 
MICROBIOLOGY biochemical test detailed.pptx
MICROBIOLOGY biochemical test detailed.pptxMICROBIOLOGY biochemical test detailed.pptx
MICROBIOLOGY biochemical test detailed.pptx
 
Painted Grey Ware.pptx, PGW Culture of India
Painted Grey Ware.pptx, PGW Culture of IndiaPainted Grey Ware.pptx, PGW Culture of India
Painted Grey Ware.pptx, PGW Culture of India
 
ECONOMIC CONTEXT - PAPER 1 Q3: NEWSPAPERS.pptx
ECONOMIC CONTEXT - PAPER 1 Q3: NEWSPAPERS.pptxECONOMIC CONTEXT - PAPER 1 Q3: NEWSPAPERS.pptx
ECONOMIC CONTEXT - PAPER 1 Q3: NEWSPAPERS.pptx
 
Proudly South Africa powerpoint Thorisha.pptx
Proudly South Africa powerpoint Thorisha.pptxProudly South Africa powerpoint Thorisha.pptx
Proudly South Africa powerpoint Thorisha.pptx
 
Blooming Together_ Growing a Community Garden Worksheet.docx
Blooming Together_ Growing a Community Garden Worksheet.docxBlooming Together_ Growing a Community Garden Worksheet.docx
Blooming Together_ Growing a Community Garden Worksheet.docx
 
Procuring digital preservation CAN be quick and painless with our new dynamic...
Procuring digital preservation CAN be quick and painless with our new dynamic...Procuring digital preservation CAN be quick and painless with our new dynamic...
Procuring digital preservation CAN be quick and painless with our new dynamic...
 
ECONOMIC CONTEXT - LONG FORM TV DRAMA - PPT
ECONOMIC CONTEXT - LONG FORM TV DRAMA - PPTECONOMIC CONTEXT - LONG FORM TV DRAMA - PPT
ECONOMIC CONTEXT - LONG FORM TV DRAMA - PPT
 
DATA STRUCTURE AND ALGORITHM for beginners
DATA STRUCTURE AND ALGORITHM for beginnersDATA STRUCTURE AND ALGORITHM for beginners
DATA STRUCTURE AND ALGORITHM for beginners
 
Hierarchy of management that covers different levels of management
Hierarchy of management that covers different levels of managementHierarchy of management that covers different levels of management
Hierarchy of management that covers different levels of management
 
Gas measurement O2,Co2,& ph) 04/2024.pptx
Gas measurement O2,Co2,& ph) 04/2024.pptxGas measurement O2,Co2,& ph) 04/2024.pptx
Gas measurement O2,Co2,& ph) 04/2024.pptx
 
Introduction to ArtificiaI Intelligence in Higher Education
Introduction to ArtificiaI Intelligence in Higher EducationIntroduction to ArtificiaI Intelligence in Higher Education
Introduction to ArtificiaI Intelligence in Higher Education
 
Roles & Responsibilities in Pharmacovigilance
Roles & Responsibilities in PharmacovigilanceRoles & Responsibilities in Pharmacovigilance
Roles & Responsibilities in Pharmacovigilance
 
OS-operating systems- ch04 (Threads) ...
OS-operating systems- ch04 (Threads) ...OS-operating systems- ch04 (Threads) ...
OS-operating systems- ch04 (Threads) ...
 
“Oh GOSH! Reflecting on Hackteria's Collaborative Practices in a Global Do-It...
“Oh GOSH! Reflecting on Hackteria's Collaborative Practices in a Global Do-It...“Oh GOSH! Reflecting on Hackteria's Collaborative Practices in a Global Do-It...
“Oh GOSH! Reflecting on Hackteria's Collaborative Practices in a Global Do-It...
 
POINT- BIOCHEMISTRY SEM 2 ENZYMES UNIT 5.pptx
POINT- BIOCHEMISTRY SEM 2 ENZYMES UNIT 5.pptxPOINT- BIOCHEMISTRY SEM 2 ENZYMES UNIT 5.pptx
POINT- BIOCHEMISTRY SEM 2 ENZYMES UNIT 5.pptx
 
TataKelola dan KamSiber Kecerdasan Buatan v022.pdf
TataKelola dan KamSiber Kecerdasan Buatan v022.pdfTataKelola dan KamSiber Kecerdasan Buatan v022.pdf
TataKelola dan KamSiber Kecerdasan Buatan v022.pdf
 

APRIL 22, 2013, 1123 P.M. After a hectic day, an exhausted .docx

  • 1. APRIL 22, 2013, 11:23 P.M. After a hectic day, an exhausted Tim Cook is arriving back at Apple’s headquar- ters in Cupertino, California. The Apple CEO is trying to find some quiet time to look over the day’s events and handle some e-mails. Having joined Apple in 1998 as Senior Vice President of Worldwide Operations, Cook had been appointed CEO based on the recommendation of Steve Jobs, who lost his battle with cancer a few weeks after resigning from the top spot in August 2011. Cook had been filling in as CEO while Jobs had been on medical leave. Cook was a low-profile, but high-impact executive at Apple who was responsible for restructuring Apple’s supply chain, which had allowed Jobs to focus on high-profile product launches. Moreover, Apple’s now super- efficient supply chain also increased its profitability tremendously. Steve Jobs had led Apple through a period of innovation that saw the introduction of category-defining prod- ucts such as the iPod, iPhone, and iPad and disruptive business models complementary to those products, such as the Apple Retail Store and the iTunes online store. iTunes had started by selling music for Apple’s iPods and later expanded into books, movies, television shows, and applications for all of Apple’s iOS devices. Apple’s competitive advantage under Jobs was the ability to continually innovate, but Cook couldn’t help but wonder if such success was sustainable, especially without Jobs. Just the previous September, to great fanfare and expectations, Apple had launched the new iPhone 5. In his presentation to an exuberant crowd of loyal Apple devotees in
  • 2. San Francisco’s Moscone Center that day, Cook had highlighted Apple’s great performance by focusing on its retail stores and the sales of Mac notebooks and iPads. In particular, Cook had emphasized the performance of Apple’s 380 retail stores in 12 countries around the world. 1 An astounding 83 million people had visited Apple retail stores in the preceding quarter, which equates to almost one million people a day, on average. In addition, he had stated that Apple ranked number one in notebook sales in the United States, with 27 percent market share. That represented a notebook sales growth of 15 percent a year. Cook had also commented on the iPad, crediting it with creating a post-PC revolution. Having sold 17 million iPads between April and June 2012, Apple claimed 68 percent market share in tablet computers. In addition, the iPad accounted for 91 percent of web traffic by all tablets, which Cook attributed to the then over 700,000 iOS applications (apps) available to Apple users. A whopping 94 percent of Fortune 100 companies had begun deploying Apple iPads in the workplace, many with customized apps to provide enterprise-specific busi- ness solutions. “To put this achievement in some perspective, we sold more iPads than any PC manufacturer sold of their entire PC lineup,” Cook said. 2 By June 2012, Apple had sold a total of 84 million iPads, a product that had been introduced less than 2.5 years prior. On August 20, 2012, Apple’s stock market valuation reached $623 billion, making it the most valuable public company of all time. The company’s value would peak in mid- September at over $650 billion. Signs of trouble soon emerged, however, and Apple’s stock price started to fall. Though the iPhone 5 launch was successful, ana- lysts were able to see Apple’s competitors gaining parity. Also, despite Apple’s victory over Samsung in court over patent infringements, Samsung was outselling Apple in
  • 3. smartphones for the year 2012 and had proven that its Galaxy S3, which ran Google’s Android operating system, was a viable substitute for the popular Apple iPhone 5. 0 0 7 7 6 4 5 0 6 5 Apple (in 2013): How to Sustain a Competitive Advantage? F R A N K T. ROT H A E R M E L Professor Frank T. Rothaermel prepared this case from public sources. The author is indebted to Research Associate Alicia Ellberger (GT MBA ’10) for her con- tributions to an earlier version of this case and Professor Erin Zimmer and Justin Collins (GT MBA ’14) for their contributions to the current version. This case is developed for the purpose of class discussion. It is not intended to be used for any kind of endorsement, source of data, or depiction of efficient or inefficient management. All opinions expressed, and all errors and omissions, are entirely the author’s. © by Rothaermel, 2015. rot45065_cases19_01-32.indd 1 12/24/13 10:00 PM MH0019 This document is authorized for use only by Deborah Melvin in MGMT-6990-1/WMBA-6990-1/WMBA-6990B-1-Capstone2020 Spring Sem 01/06-04/26-PT2 at Laureate Education - Walden University, 2020. 2
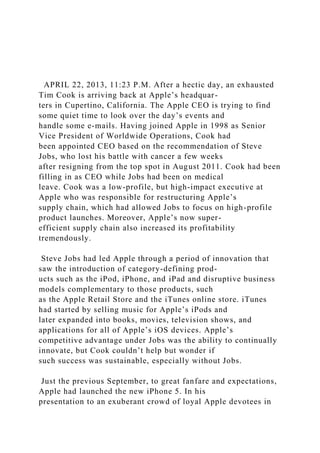
  • 4. Apple (in 2013): How to Sustain a Competitive Advantage? As Cook sat down at his desk, he wondered what the company’s next move should be, given the increasingly competitive marketplace for its products. The current company value was $370 billion. (See Exhibit 1 for a look at how fast Apple’s value had declined in recent months.) Steve Jobs had always looked for the “next big thing” despite how successful past ideas had been. Cook wondered if Apple would be able to sustain its competitive advantage or if Apple’s time had passed. The Creation of Apple, Inc. In 1976, Steve Jobs and Steve Wozniak conceived the idea of a personal computer company and founded Apple Computer, Inc. (The word Computer was dropped in 2007 to reflect Apple’s expansion from the personal com- puter market to consumer electronics in general. 3 ) Only 21 years of age, Jobs had to sell his Volkswagen to get money to start the company. Jobs and Wozniak, then 26, began to assemble personal computers in Jobs’ garage with a small group of friends. Soon after, they received additional financing to spur the growth of the company. In 1978, the Apple II, the first personal computer, was launched and sold for $666.66. 4 In December of that same year, Apple launched a successful IPO, making it a publicly traded company. By 1980, Apple had released three improved versions of the personal computer, and Jobs and Wozniak had become multimillionaires. Then, IBM entered the personal computer market in 1981 and quickly became a seri- ous competitor. IBM’s open architecture was easily imitable by other manufacturers and soon became the industry standard, giving rise to many more computer companies in the
  • 5. United States (e.g., Compaq and Dell), as well as in Taiwan, Korea, and other Asian countries. Even more threatening was the consortium between IBM, which spe- cialized in the development of computer hardware; the newly formed Microsoft with its DOS operating system; and Intel with its expertise in memory and processors. By 1982, IBM had increased its profitability and market share substantially, and Apple’s position was under attack. “OBSESSED WITH DESIGN” Nonetheless, in just over 10 years Apple had grown into a $2 billion company with over 4,000 employ- ees. 5 In 1984, Apple introduced its finest creation yet: the Macintosh. Jobs’ curiosity and intuition had led him to become fixated on design and style. This passion began when Jobs dropped out of Reed College at the youthful age of 17. “The minute I dropped out, I could stop taking the required classes that didn’t inter- est me, and begin dropping in on the ones that looked interesting,” Jobs remembered. 6 He decided to take a calligraphy class to learn about serif and sans serif typefaces and what makes great typography: “It was beautiful, historical, artistically subtle in a way that science can’t capture, and I found it fascinating. None of this had even a hope of any practical application in my life. But 10 years later, when we were designing the first Macintosh computer, it all came back to me. And we designed it all into the Mac. It was the first computer with beautiful typography.” 7 Jobs firmly believed that if he had not dropped out of college and into that calligraphy class, the Mac would never have had multiple typefaces and proportionally spaced fonts. And, “since Windows just copied the Mac, it’s likely that no personal computer would have them,” if he had not made that decision. 8
  • 6. Although the Macintosh was the first personal computer applauded for unique industrial design and ease of use, it had a slower processor than IBM PCs and their clones, and very few compatible software programs due to Apple’s closed proprietary operating system. As a result, the Mac was gradually pushed to the periphery as a niche player with customers mainly in education and graphic design. Apple’s integrated value chain enabled the company to produce computers of high quality, but placed the Macintosh at a price disadvantage as the growing consumer technology industry became increasingly commoditized. rot45065_cases19_01-32.indd 2 12/24/13 10:00 PM This document is authorized for use only by Deborah Melvin in MGMT-6990-1/WMBA-6990-1/WMBA-6990B-1-Capstone2020 Spring Sem 01/06-04/26-PT2 at Laureate Education - Walden University, 2020. Apple (in 2013): How to Sustain a Competitive Advantage? 3 NEW MARKETING GURU In 1983, Jobs decided to bring in John Sculley to run the company with him. At the time, Sculley was a market- ing guru from Pepsi whom Jobs “thought was very talented.” 9 Sculley was responsible for the “Pepsi Challenge” and “Pepsi Generation” ad campaigns that helped Pepsi overtake Coca-Cola in market share for the first time in the history of the “Cola Wars.” He had also turned around
  • 7. PepsiCo’s failing food division by bringing in new management, improving product quality, and instituting new accounting and financial controls. 10 Apple’s innovative advertising tale started on January 22, 1984. During the third quarter of the Super Bowl that year, “one of the most famous television commercials of all time” was broadcast. 11 The ad was based on the dystopian society depicted by George Orwell in his novel 1984. Hundreds of identical drones were shown listening to their larger-than-life dictator, whose black-and- white face was projected onto a screen in the middle of the room. Suddenly, a beautiful woman, escaping capture from armed guards, threw a hammer at the screen which exploded in a Technicolor display of dazzling light. The ad stated, “On January 24th, Apple Computer will introduce Macintosh. And you’ll see why 1984 won’t be like 1984. ” 12 In this fashion, customers were introduced to Apple as the revolutionary, subversive, and rebellious company of the 1980s, ready to take on the tyrant of IBM. For a while after John Sculley joined Apple, things went well. But Jobs later recalled that “our visions of the future began to diverge and eventually we had a falling out.” 13 Apple’s core identity changed with Sculley in charge. The business strategy shifted from differentiation based on a premium product with a high price tag to producing a low-cost product with mass-market appeal. Sculley’s new ambition for Apple was to compete directly with IBM in the household-computer market. Apple worked on bringing down the cost of manufacturing and formed alliances with Intel, Novell, and even its old nemesis, IBM. At the same time, Apple moved toward desktop publishing, multimedia, and peripherals. However, a series of major product flops, missed deadlines, and
  • 8. unrealistic earnings forecasts destroyed Apple’s reputation. As a consequence, Apple’s profitability continued on a downward slope. With dismal sales and declining net income, a power struggle erupted between Jobs and Sculley, who eventually succeeded in convincing Apple’s board of directors to throw Jobs out of Apple in 1985. HARD TIMES To add insult to injury, Microsoft released its graphical user interface (GUI)–based operating system, Windows 3.0, in 1990, effectively cementing the Wintel standard with 90 percent market share in the PC industry. Wintel represented the powerful combination of a Windows operating system running on the x86 architecture chips made by Intel. Today, the x86 architecture is ubiquitous among computers, and a large amount of software supports the platform, including operating systems such as MS-DOS, Windows, Linux, BSD, Solaris, and Mac OS X. The innovator Apple had become a non-factor in the PC industry, retreating to ever-smaller niches of the market. In June 1993, leadership changed hands again from Sculley to Michael Spindler. Spindler continued the com- pany’s focus on cost-cutting but also made international growth a main objective. By 1995, Apple was spreading itself too thin across product lines and geographic markets. It had lost any strategic focus and could not stop operating in the red. Steve Jobs Returns During this time, Jobs was starting over. “What had been the focus of my entire adult life was gone, and it was devastating.” 14 Jobs had been fired very publicly from a company he had helped to create, and even considered
  • 9. leaving Silicon Valley for good. He later reminisced, “I didn’t see it then, but it turned out that getting fired from rot45065_cases19_01-32.indd 3 12/24/13 10:00 PM This document is authorized for use only by Deborah Melvin in MGMT-6990-1/WMBA-6990-1/WMBA-6990B-1-Capstone2020 Spring Sem 01/06-04/26-PT2 at Laureate Education - Walden University, 2020. 4 Apple (in 2013): How to Sustain a Competitive Advantage? Apple was the best thing that could have ever happened to me. The heaviness of being successful was replaced by the lightness of being a beginner again. . . . It freed me to enter one of the most creative periods of my life.” 15 In 1986 Jobs invested $10 million in Pixar Animation Studios. 16 Since then, Pixar has earned 12 Academy Awards, 6 Golden Globes, and 11 Grammys, among many other awards. Pixar created the world’s first com- pletely computer-animated feature film, Toy Story, and is now the most successful animation studio in the world, with films like Toy Story 2 and 3, Monsters Inc., Cars, Finding Nemo, The Incredibles, WALL-E, Up, and Brave. In 2006, Disney bought Pixar for $7.4 billion in a deal that also landed Jobs a seat on Disney’s board of directors. “The addition of Pixar significantly enhances Disney animation, which is a critical creative engine for driving growth across our businesses,” Disney CEO Robert
  • 10. Iger stated. 17 Jobs, the majority shareholder of Pixar at the time with 50.1 percent, became Disney’s largest individual shareholder with 7 percent. 18 His hold- ings greatly exceeded those of the previous top shareholder of Disney, ex-CEO Michael Eisner, who owned 1.7 percent, and even Disney’s Director Emeritus Roy E. Disney, who owned less than 1 percent of the corporation’s shares. Just one year prior to starting Pixar, Jobs had founded a computer company called NeXT, Inc., later known as NeXTSoftware, Inc. NeXT developed one of the first enterprise web application frameworks for the higher- education and business markets. In a bizarre twist of fate, Apple purchased NeXT on December 20, 1996, for $429 million. 19 Earlier in 1996, Gilbert Amelio had replaced Spindler as CEO of Apple, which was reporting a mere $69 million in first-quarter revenues. Amelio’s intention was to revive Apple’s former strategy by focusing again on the premium-product market segment. Amelio made many changes at Apple, including terminating the IBM alliance and announcing massive layoffs of 30 percent of the company’s total work force of 13,400. 20 With the acquisition of NeXT, Amelio also brought Jobs back as a part- time adviser to Apple. Despite all these measures, Apple’s market share continued to tumble to just 3 percent worldwide. 21 Apple experienced its worst year ever in 1997 and subsequently ousted Amelio due to crippling financial losses and a low stock price. Jobs was brought back as interim CEO in September of that same year. Thereafter, Steve Jobs succeeded in orchestrating one of the greatest corporate comebacks in modern-day history. (See Exhibits 2
  • 11. and 3 for financial performance data.) Restructuring Apple When Steve Jobs returned to Apple in 1997, he was ready and eager to shake things up. In a meeting with Apple’s top executives, after hearing all their explanations as to why Apple was performing poorly, Jobs infa- mously roared: “The products SUCK! There’s no SEX in them anymore!” 22 Jobs swiftly refocused the company that he had helped start and discontinued several products such as the Newton PDA, the LaserWriter printer line, and the Apple QuickTake camera—all now collector items for Apple enthusiasts. During this time of restructuring, Jobs outsourced manufacturing to Taiwan and scaled down the distribu- tion system by ending relationships with smaller outlets. With Jobs’ savvy insight for what consumers wanted, he launched a new, revolutionary website to sell Apple products directly to customers online. For the first time ever, he also opened Apple retail stores, tied to his build-to- order manufacturing strategy. Although these moves seemed risky at the time, all of these operational improvements helped to boost previously declining sales. For the first time in five years (since 1993), Apple once again became profitable. Jobs also realized the necessity of making Apple’s operating system more accessible for software providers. He switched everything to the open-source, UNIX-based operating system, Mac OS X. This proved to be a more stable rot45065_cases19_01-32.indd 4 12/24/13 10:00 PM This document is authorized for use only by Deborah Melvin in
  • 12. MGMT-6990-1/WMBA-6990-1/WMBA-6990B-1-Capstone2020 Spring Sem 01/06-04/26-PT2 at Laureate Education - Walden University, 2020. Apple (in 2013): How to Sustain a Competitive Advantage? 5 operating environment and permitted the company to issue annual upgrades in response to customer feedback. In 2005, Apple completed this transition by switching from PowerPC to Intel processors, which meant that Apple Computers could run not only the Mac OS X but also any operating systems that used the x86 architecture. This marked the beginning of a truly open era for Apple computers: They were now the most flexible, as well as the most attractive. As a result, Apple’s stock price rose from $6 in 2003 to over $80 in 2006, surpassing even Dell’s market cap, the then-number-one computer maker in the U.S. 23 Dell’s CEO, Michael Dell, was left retracting the words he had very publicly spat nine years prior, “If I ran Apple, I would shut it down and give the money back to shareholders.” 24 Jobs even formed an alliance with Apple’s archrival Microsoft to release new versions of Microsoft Office for the Macintosh. In return, Microsoft made a $150 million investment in non-voting Apple stock. 25 Jobs, in a cell phone call with Gates said, “Bill, thank you. The world is a better place.” 26 Beyond changing the operating system, the most visible change Jobs instituted was leveraging industrial design to produce more aesthetically pleasing computers. Jobs almost instantly revitalized Apple’s image by pushing the
  • 13. limits of technology and design. He appointed Jonathan Ive, a British designer, head of Apple’s in-house Industrial Design group (IDg). There have been several distinct design themes in Jobs and Ive’s collaboration over the years: translucency, colors, minimalism, and dark aluminum. Ive has been credited with being the chief designer of the iMac, the aluminum and titanium PowerBook G4, the MacBook, unibody MacBook Pro, iPod, iPhone, and the iPad. 27 Ive’s work at Apple has won him a slew of awards and widespread recognition. Jobs also started to brand Apple as a functionally appealing, hip alternative to other dull, clone-like comput- ers in the market. Known for his candor, Steve Jobs once accused Michael Dell of making “un-innovative beige boxes.” 28 Continuing in the same vein as the infamous 1984 television ad, Apple launched its “Think Different” campaign in 1997. The aim of the campaign was to reflect the culture of Apple, comprised of great people who think differently. The television advertisements featured major artists, scientists, and politicians who were seen as independent thinkers, including Albert Einstein, Martin Luther King, Jr., John Lennon, Thomas Edison, Amelia Earhart, Alfred Hitchcock, Pablo Picasso, and Jerry Seinfeld. Similarly, Apple’s print advertisements had less to do with specific products, and everything to do with company image. They simply featured a portrait of one of the historic figures and a small Apple logo with the words “Think Different” in the bottom corner. In 2002, Apple launched the “Switch” advertising campaign, which showed various celebrities and non-celebrities talking about the reasons they switched from Windows computers to Apple computers. The “I’m a Mac, I’m a PC” commercials in the last half of the decade, which featured young actor Justin Long as a “Mac” and a middle-aged man (comic John Hodgman) in a suit as a “PC,” helped to fortify the image
  • 14. of the Mac as young and hip and the PC as only suitable for business and not the creative needs of the younger generation. As a result of these efforts, Apple’s stock price experienced unprecedented growth compared to the NASDAQ 100 index (see Exhibit 4 ). And this growth continued with Cook at the helm (see Exhibit 5 ). Cook had been Chief Operating Officer at Apple before becoming CEO. With an MBA from Duke University and a BS in Industrial Engineering from Auburn University, Tim’s personality contrasted starkly with Jobs’; he displayed no ego and was much happier out of the limelight. However, there was a sharp increase in the value of Apple’s stock from when Cook took over as CEO until its peak in September of 2012. At its height in 2012, Apple’s stock price enjoyed a 9,000 percent premium over the index. It rose from $375 a share in August 2011 to $700 a share in September 2012 (see Exhibit 6 ). Apple’s Culture As early as 1983, Steve Jobs coined the following motto at an offsite retreat: “It’s better to be a pirate than join the navy.” 29 Jobs’ Macintosh team had only 80 employees at the time, but already he sensed that they were devel- oping the group-think mentality that he detested. In response to “Captain” Jobs’ cry, programmers Steve Capps and Susan Kare painted a rainbow-colored Apple eye patch onto a pirate flag and hung it above the Macintosh building. This iconic image became illustrative of Apple’s unique corporate culture and also symbolic of Apple’s first inspired slogan in the late 1970s, “Byte into an Apple.” rot45065_cases19_01-32.indd 5 12/24/13 10:00 PM This document is authorized for use only by Deborah Melvin in MGMT-6990-1/WMBA-6990-1/WMBA-6990B-1-Capstone2020
  • 15. Spring Sem 01/06-04/26-PT2 at Laureate Education - Walden University, 2020. 6 Apple (in 2013): How to Sustain a Competitive Advantage? According to its website, working at Apple was “less of a job, more of a calling.” 30 Apple looked for employees who were on a mission to “change the world” and create “some of the best-loved technology on the planet.” 31 Apple promoted itself to prospective candidates as “a whole different thing” with “corporate jobs without the corporate part.” 32 Apple looked for people who were “smart, creative, up for any challenge, and incredibly excited about what they do. In other words, Apple people. You know, the kind of people you’d want to hang around with anyway.” 33 From the start, Steve Jobs had been more than instrumental in developing Apple’s envied corporate culture. Employees typically worked 60 to 70 hours a week, and no one complained. Apple has been thought of as putting Silicon Valley on the map with its hard-working but relaxed, casual atmosphere. 34 This characterization would be an impossible contradiction in most other corporations in the United States, but not at Apple. When Jobs returned to Apple in 1997, he became famous for his standard black turtleneck and jeans uniform, walking around the campus with, or sometimes without, his sneakers. Jobs even went barefoot to a 1999 meeting to settle a patent dispute with executives from Microsoft. 35 Jobs was the ultimate example of an “I’m-a-genius-and-I-don’t-care” attitude. Apple employees embraced their hero and
  • 16. became convinced that, with confidence and creativity, they too could become rich and leave a legacy—sans suit or shoes. Apple’s rebel spirit not only attracted a long-lasting appreciation from loyal employees but also created an almost cult-like following among customers who appreciated Apple’s propensity to think differently. Millions of people wanted to be seen as unique individuals, and hence, millions of people bought Apple products. The “Cult of Apple” was a group of rumored fanatical followers devoted to all things Apple, but “while there are many customers who eat, think, and breathe Apple, members of the Cult of Apple take their devotion one step further and believe in Apple.” 36 The result was that Apple had a conspicuous horde-like following walk- ing down the streets of every major city in the world with the signature white ear buds of Apple products attached to their heads. Apple products became so trendy that other companies had to design their consumer electronics like Apple’s to have a hope of selling. The loyalty of Apple customers has served the company well, and now it is not just the die-hard fanatics who believe. Even people in the mainstream were becoming Apple converts. Innovation at Apple The one competency that kept Apple on the cutting edge, all the way from startup to survival to success—and finally to profitability and industry envy—has been innovation. “Innovation distinguishes between a leader and a follower,” Jobs repeatedly said. 37 Jobs believed that innovation is a process that can be cultivated and managed within an organization. It begins with idea generation, and then moves to idea adoption and development, and
  • 17. finally to idea implementation. All the while, the innovation process is being enabled by effective leadership and a supportive organizational culture. Steve Jobs firmly believed that Apple could create major innovation breakthroughs that would reshape future industries. Jobs’ attitude toward innovation as key to a successful strategy and competitive advantage was revealed in an interview that UCLA professor Richard Rumelt conducted shortly after Jobs returned to Apple in 1998: “I was interested in what Steve Jobs might say about the future of Apple. His survival strategy for Apple, for all its skill and drama, was not going to propel Apple into the future. At that moment in time, Apple had less than 4 percent of the personal computer market. The de facto standard was Windows- Intel and there seemed to be no way for Apple to do more than just hang on to a tiny niche. I said, ‘Steve, this turnaround at Apple has been impressive. But everything we know about the PC business says that Apple cannot really push beyond a small niche position. The network effects are just too strong to upset the Wintel standard. So what are you going to do in the longer term? What is your strategy?’ “[Steve Jobs] did not attack my argument. He didn’t agree with it either. He just smiled and said, ‘I’m going to wait for the next big thing.’” 38 rot45065_cases19_01-32.indd 6 12/24/13 10:00 PM This document is authorized for use only by Deborah Melvin in MGMT-6990-1/WMBA-6990-1/WMBA-6990B-1-Capstone2020 Spring Sem 01/06-04/26-PT2 at Laureate Education - Walden University, 2020.
  • 18. Apple (in 2013): How to Sustain a Competitive Advantage? 7 Apple’s top management was also critical in the effort to nurture an innovative organization because employees needed to know that they would not be reprimanded for making risky choices when attempting a creative project. A high tolerance for failure and calculated risk-taking is necessary for employees to feel comfortable bringing up new ideas in any organization. 39 Apple’s work force appeared to have embraced this attitude fully, as they proudly “[said] NO to 1,000 things.” 40 Compared to its competitors, Apple spent a mere 2.24 percent of revenues on research and development (R&D) for a grand total of $2.4 billion in 2011 ( Exhibit 7 ). In contrast, Microsoft spent about 12.93 percent of annual revenues on R&D, equating to a whopping budget of $9.0 billion. Google similarly spent over 13.62 percent of annual revenues on R&D, for a total expenditure of $5.1 billion. Comparing the amount of money spent at Apple with that of other technology giants shows how effectively Apple’s innovation process works, making possible a significant return on R&D investment. In fact, Jobs was known to say: “Innovation has nothing to do with how many R&D dollars you have. When Apple came up with the Mac, IBM was spending at least 100 times more on R&D. It’s not about money. It’s about the people you have, how you’re led, and how much you ‘get it.’” 41 Recently, Apple is spending more on R&D; it spent $3.38 billion on R&D in 2012 and several billion the first few months in 2013. 42 Although Apple has not made any new product introductions in the recent past, this
  • 19. increase in spending could be indicative of attempts to launch category-defining products and services such as those for television or smart-watches in the near future. The iPod/iPhone/iPad Revolution and Apple TV THE IPOD The big bang happened at Apple in October 2001 with the launch of the iPod, a portable digital music player based on the MP3 music format. The sleek design and smart graphical user interface bewitched consumers. The product was an instant hit, selling over 100 million units within six years. 43 The profitability of the iPod was phe- nomenal, with margins estimated as high as 47.4 percent before freight, marketing, and other costs. 44 In April 2003, Apple provided iTunes as a complement for the iPod. iTunes was the first online store from which customers could buy songs individually at 99 cents each, rather than purchasing entire albums for upward of $15 to $20 or downloading songs illegally. Within three days of launch, iTunes users had downloaded one million songs. By June 2008, iTunes had exceeded five billion downloads. 45 On February 25, 2010, which was coincidentally Steve Jobs’ 55th birthday, Apple achieved the great milestone of 10 billion iTunes downloaded. Apple had seemingly effortlessly established itself as the newest icon of the digital age, revolutionizing the music industry and holding fast to its leadership position in the technology race. In keeping with its iconoclastic reputation, Apple promoted its iPod as a stylish alternative to archetypal music technology products with the new “iPod People” campaign. Ads featured several silhouetted people with white
  • 20. headphones in their ears dancing against a colorful background. Apple advertising had always been creative by design, but its “iPod People” promotion brought in an unmistakable “coolness-factor” as the essence of the prod- uct. That desired attribute was directly transferred to the customer upon purchase. THE IPHONE In June 2007, Apple launched the iPhone, and soon Apple’s share price passed the $100 mark. 46 The iPhone was a multifunction smartphone that provided the customer with a unique touch-based interface and a revolutionary operating system delivering a computer-based experience. According to Jobs, the iPhone was “the Internet in your pocket.” 47 Apple partnered with AT&T to bring this device to the market and make it affordable for consumers. AT&T was happy to subsidize the phones, as long as it could ride the Apple wave of “coolness” and innovation. rot45065_cases19_01-32.indd 7 12/24/13 10:00 PM This document is authorized for use only by Deborah Melvin in MGMT-6990-1/WMBA-6990-1/WMBA-6990B-1-Capstone2020 Spring Sem 01/06-04/26-PT2 at Laureate Education - Walden University, 2020. 8 Apple (in 2013): How to Sustain a Competitive Advantage? One year later, Apple launched the iPhone 3G, which was advertised as twice as fast at half the price. The iPhone 3G supported all Microsoft document formats and had
  • 21. full support for a Microsoft Exchange server. Apple sold a record six million 3G iPhones in the first year, giving birth to a whole new generation of smartphones. In the summer of 2010, Apple released the iPhone 4 with two built-in cameras and higher resolutions. In that same year, Apple had captured 17.4 percent of the smartphone market, with 82 percent sales growth since 2008. It had taken only two years for Apple to jump to second place behind Nokia, with 32.7 percent market share. BlackBerry was third with 15.3 percent. 48 The iPhone 4S, an update to the iPhone 4 with a voice assistant known as “Siri,” was released in October of 2011. The iPhone 5, which had a larger screen and was the first 4G iPhone, was released in September of 2012. THE IPAD On January 25, 2010, Jobs took his biggest gamble yet with the announcement of the iPad, a multimedia, tablet-style computer designed to take the place of a pencil and pad of paper. 49 (See Exhibit 8 for a historical timeline of Apple’s product introductions and net income.) During Jobs’ keynote address introducing the iPad two days later, he praised his new invention as the “best browsing experience you’ve ever had. You can see the whole page—it’s phenomenal! It’s an incredible experience.” 50 Investors apparently shared Jobs’ excitement, as Apple’s stock price rose 15 percent after the iPad was unveiled. 51 However, the idea of a keyboard-free, touchscreen portable computer tablet had been around for more than two decades. Apple had even launched its own Newton MessagePad in 1993, which became known less for its pio- neering features and more for being ridiculed in “Doonesbury” for the software’s problem in recognizing hand- writing. 52 Upon returning to Apple in 1997, Jobs withdrew
  • 22. the Newton, which had become a commercial failure and a public relations embarrassment. Competitors learned from Apple’s Newton debacle and started to introduce improved products at a lower price, including Palm’s Pilot, Handspring’s Visor, and BlackBerry. Meanwhile, Jobs continuously scrapped all of Apple’s new tablet prototypes for over a decade, because they reportedly “weren’t good for anything except browsing the Web from the bathroom.” 53 Apple had come a long way since the Newton, as evidenced by the fact that its iPad was the most highly anticipated gadget of 2010. 54 Jobs in his keynote address stated that “the iPad is our most advanced technology in a magical and revolutionary device at an unbelievable price.” 52 The iPad was half an inch thick, weighed 1.5 pounds, and had a 9.7-inch “gorgeous, super-high quality display” and was “multi-touch, super-responsive, and super-precise.” 56 It had Wi-Fi wireless connectivity and availability to e-mail, photos, video, music, games, and e-books, and was capable of browsing the web. It operated much like the smaller iPhone and could run all 140,000 existing apps designed for the iPhone. Additionally, the iPad incorporated features like a calendar, photo manager, spreadsheets, and presentations to take on a more multimedia look. 57 Given initial rumors that the iPad would cost anywhere from $700 to $1,000, customers were pleasantly surprised when it debuted at prices ranging from $499 up to $829. Many Apple fans remembered when Jobs famously spouted his disdain for the growing development of the notebook market: “We don’t know how to make a $500 computer that’s not a piece of junk.” 58 However, customers had to pay an extra $30 a month to AT&T for the same always-on Internet access that the Kindle
  • 23. provided, 59 with an option to renew their subscription on a monthly basis. This arrangement represented a significant departure from the wireless industry’s traditional carrier-centered model, allowing Apple to extract more value while carriers bore more of the cost. Despite pent-up demand, it was estimated that the iPad would cannibalize the market for other Apple products, including the iPhone, iPod, and Mac notebooks, by around 10 percent. 60 To overcome this potential threat, Jobs would have to convince customers that they needed another gadget, in addition to their laptops and smartphones. Jobs believed there was room for a third category between the laptop and smartphone, but acknowledged that “it must do things far better than both existing devices.” Jobs argued that if the iPad could not do some tasks better than laptops or smartphones, it was unnecessary. 61 rot45065_cases19_01-32.indd 8 12/24/13 10:00 PM This document is authorized for use only by Deborah Melvin in MGMT-6990-1/WMBA-6990-1/WMBA-6990B-1-Capstone2020 Spring Sem 01/06-04/26-PT2 at Laureate Education - Walden University, 2020. Apple (in 2013): How to Sustain a Competitive Advantage? 9 Yet critics pointed out that, unlike the iPhone, the iPad lacked a built-in camera for taking photos. It also lacked the ability to play Flash-based content on websites, which accounted for 75 percent of video on the web, and it
  • 24. could run only one app on the screen at a time. While Jobs hailed the iPad as “a dream to type on,” 62 for many it was not as easy as a typical keyboard with tactile keys to feel. This caused many customers to express disappoint- ment with the iPad as doing less than the iPhone, but on a bigger screen. 63 In March 2011, Steve Jobs, in typical showman fashion, unveiled the iPad2, a thinner and sleeker but higher-performing version of the original iPad. The iPad2 also contained two cameras to facilitate online video chat. 64 With the introduction of the iPad, Steve Jobs defined Apple as a mobile-devices company, competing against Sony, Samsung, and Nokia. 65 At the same time, Apple faced direct competition from other computer manufactur- ers, who were quick to jump on the iPad bandwagon, hoping to undercut Apple’s price to gain market share. For example, Hewlett-Packard announced its own keyboardless computer called the “Slate,” and Dell, Acer, and Sony were all refining their own versions of the tablet. In addition, the iPad was likely to face competition from the new mini-laptops or “netbooks” being offered by Apple’s competitors for around $100. 66 These devices could perform all of the necessary functions needed for most personal, academic, and even professional needs. Nevertheless, Jobs did not appear to be too concerned: “The problem is netbooks aren’t better at anything—they are just cheaper.” 67 APPLE TV In March 2007, Steve Jobs introduced the first-generation Apple TV to the world, having referred to it more as a “hobby” than a mainstream product. The first-generation model was a box that connected to a user’s television set. It allowed the user to sync and then play his or her downloaded content from the iTunes store. The content could be
  • 25. rewound or fast-forwarded, making the Apple TV the equivalent of the modern-day satellite or cable DVR. The newest generation of the Apple TV provides users with more flexibility. It allows them to view content from their iPhone, iPad, or iPod. Additionally, users can watch movies, play music, show off their videos and photos, and even mirror what’s on their device’s screen to enjoy games, web pages, and more. Ultimately, Apple TV allows users to access all of the benefits of their complementary Apple products from their living rooms. The latest generation model retails for $99. The evolved product was expected to have a major impact on the market in time for the 2012 holiday shopping season. However, the complexity of dealing and integrating with established broadcast cable providers and hard- ware design and supply issues held back the new Apple TV. Even with these holdups, Apple continues to have an “intense interest” in television, and the company continues to test high-definition TVs and possible partnerships with cable companies. Revolutionizing the Publishing Industry? Because the iPad allowed users to read books, newspapers, and magazines, Jobs predicted that it would reshape the publishing business much the way his iPod revolutionized the music industry. 68 Technophiles envisioned that the iPad would “save the newspaper and book publishing industries, present another way to watch television and movies, play video games, and offer a visually rich way to enjoy the web and the expanding world of mobile applications.” 69 Many believed that the iPad represented the next technological innovation to replace Amazon’s Kindle and
  • 26. Sony’s Reader. Jobs described how Apple would take over Amazon’s e-book market saying: “We’re going to stand on its shoulders and go a bit further.” 70 He started by announcing a new online store for electronic books called iBookstore, along with new partnerships with major book publishers including the Hatchette Book Group, Macmillan, Penguin Group, HarperCollins, Simon & Schuster, and McGraw-Hill to provide e-book content for the iPad. The only publisher that did not sign on with the iPad was Random House. One reason it held out is that publishers and authors would make lower revenues and royalties per book sold. rot45065_cases19_01-32.indd 9 12/24/13 10:00 PM This document is authorized for use only by Deborah Melvin in MGMT-6990-1/WMBA-6990-1/WMBA-6990B-1-Capstone2020 Spring Sem 01/06-04/26-PT2 at Laureate Education - Walden University, 2020. 10 Apple (in 2013): How to Sustain a Competitive Advantage? With few exceptions, the publishing industry was enthusiastic to tap into a market of 125 million Apple cus- tomers. “It is never wise to stand between a consumer and a preference for how they get their content,” said John Makinson, CEO of Penguin. 71 Moreover, publishers detested Amazon’s pricing model, which charged Kindle customers a standard $9.99 for each e-book, causing publishers to lose about $5 for each e-book sold. In contrast, the iBookstore set the maximum e-book price at the cost of printing the book, so publishers were able to charge
  • 27. anywhere from $12.99 to $14.99 for most titles. Apple retained 30 percent of the sale price and returned the remaining 70 percent to the publishers. What publishers liked about the iPad deal was that they (and not Apple) got to determine the prices of e-content for end consumers. In addition, this deal gave publishers leverage to nego- tiate higher prices for their content with Amazon. It was even possible that publishers would withhold titles from Amazon if they did not agree to raise their prices. As a result, the competition between Apple and Amazon “is as intense a situation as the industry has ever had. . . . It’s a huge chess match.” 72 In April of 2012, the U.S. Department of Justice brought a lawsuit against the publishers and Apple. The Department of Justice alleges that the publishers conspired to fix prices by joining together to force Amazon into the same agency business model that Apple offered to the publishers. In the pricing model, Apple gets 30 percent of each book sale through its iBookstore and the publisher retains 70 percent. By forcing Amazon into the same model, Amazon would no longer be able to offer books at the $9.99 price point that the publishers did not want consumers to expect as the price of a new release. Three publishers settled with the Department of Justice but Apple has not. 73 If found guilty of collusion, Apple could be required to change its e-book business model. Current Competitors Apple’s exceptional performance, brand loyalty, and innovation capabilities would make any CEO envious. Also, as the industry continues to evolve, the lines between hardware, software, and search engines have blurred as each company vies for market share and dominance. The following companies pose the biggest threat to Apple
  • 28. and consistently seek opportunities to take market share away from the industry giant. (See Exhibits 9 , 10 , and 11 for comparisons of Apple’s stock performance versus these companies.) AMAZON.COM Amazon competes directly against Apple in the sale of electronic media such as music, videos, and books. Amazon also runs an Android app store and is one of the leading providers of cloud computing services. Founded in 1994 by Jeffrey Bezos as an online book retailer, Amazon’s sales grew from $20,000 in 1995 to over $61 billion in 2012 ( Exhibit 12 ). 74 After the company went public in 1997, it rapidly diversified into multiple product areas, undercutting existing specialty and brick-and- mortar retailers in price. 75 In 1998, Amazon launched its online music and video store and began to sell toys as well as consumer electronics; it added clothing in 2002. More recently, Amazon has engaged in a series of acquisitions to further expand the breadth of products offered. The firm acquired the No. 1 online shoe retailer, Zappos, for $890 million in 2009. In 2010, Amazon added both Woot, a social shopping e-commerce site, and Quidsi, the owner of Diapers.com and Soap.com , to its portfolio. By 2012, Amazon employed 51,300 people all over the world and had climbed to No. 56 in the Fortune 500. 76 The Kindle Fire tablet product line is seen as a direct competitor to the iPad. In January 2013, the Kindle Fire accounted for 7.78 percent of web traffic from tablet computers in North America compared to the iPad’s 81 percent. 77 The Kindle Fire runs Google’s Android operating system and the Kindle Fire HD was announced in September 2012 and comes in two different sizes: 7” and 8.9.”
  • 29. Amazon has long been rumored to be working toward introducing a smartphone into the market. It has been testing phones with Asian suppliers, and the device would most likely be built using the company’s experience with its Kindle Fire tablet product line, which competes against the iPad. The company also has more than 60,000 rot45065_cases19_01-32.indd 10 12/24/13 10:00 PM This document is authorized for use only by Deborah Melvin in MGMT-6990-1/WMBA-6990-1/WMBA-6990B-1-Capstone2020 Spring Sem 01/06-04/26-PT2 at Laureate Education - Walden University, 2020. Apple (in 2013): How to Sustain a Competitive Advantage? 11 apps running on Google’s Android software, so a smartphone would appear to be the next logical step in its inno- vation process. The device could have a large impact on both Apple and Samsung’s smartphone market share. BLACKBERRY Research in Motion (RIM) was founded in 1984 by University of Waterloo engineering student Mike Lazaridis and University of Windsor engineering student Douglas Fregin. In 2002, the company revolutionized the cellular phone market with its first data and voice product, the BlackBerry 5810. The company won numerous design and innovation awards and entered into partnerships with all of the major phone carriers. By 2005, it had over
  • 30. 5 million subscribers and continued to upgrade and release various new models around the world. 78 In 2009, Fortune named RIM the world’s fastest-growing company; its profits grew at an astonishing rate of 84 percent ( Exhibit 13 ). But in 2012, RIM experienced a 90 percent drop in its stock price due to dismal sales and market share numbers. It was the culmination of a decline that began in 2007—the year Apple launched the iPhone. Unlike the BlackBerry, which targeted a smaller contingent of enterprise clients, the iPhone catered to the everyday user, putting RIM at a distinct competitive disadvantage. Also, RIM resisted the use of apps, touchscreen technology, and full access to the Internet that competitors like Apple offered as standard on their smartphones. 79 In 2013, RIM changed its name to BlackBerry to signal a new start. Though struggling to compete with Apple and the Android phone manufacturers, BlackBerry launched a new operating system and two new phones in January of 2013. FACEBOOK In 2004, 19-year-old Mark Zuckerberg and three college pals founded Facebook in a dorm room at Harvard. What began as a hobby to let Ivy Leaguers socialize online has become the world’s largest social networking site, with more than one billion users and revenues of over $4.5 billion in 2012 ( Exhibit 14 ). 80 Facebook continues to move toward a more mobile-centered business model and has developed applications and advertising specifically for these types of devices. In April of 2013, Facebook and HTC unveiled the HTC First, which is the first phone designed specifically for the
  • 31. Facebook Home Android application. 81 Many wonder if Facebook will ever launch its own phone and operating system. GOOGLE In 1998, 24-year-old Sergey Brin and 25-year-old Larry Page founded Google. They met as graduate students in the computer science department at Stanford University where they began working together on a web crawler, with the goal of improving online searches. What they developed was the PageRank algorithm, which returns the most relevant web pages more or less instantaneously and ranks them by how often they are referenced on other important web pages. A clear improvement over early search engines such as AltaVista, Overture, and Yahoo, all of which indexed by keywords, the PageRank algorithm is able to consider 500 million variables and three billion terms. What started as a homework assignment launched the two into an entrepreneurial venture when they set up shop in a garage in Menlo Park, California. Today, Google is the world’s leading online search and advertising company, with some 70 percent market share of an industry estimated to be worth more than $25 billion a year, and growing quickly. (See Exhibit 15 for Google’s financials.) Google’s current operating system, Android, is used exclusively by Samsung Electronics, a Korean electron- ics maker, in all of its smartphone devices. As an alternative to the iPhone, Android phones created by Samsung, HTC, and others have rapidly stolen market share from Apple and BlackBerry. Samsung especially has been able to create phones running Android that are viable alternatives to the iPhone. In a move into the hardware space, Google acquired Motorola Mobility in 2011 and plans to release its own phones and tablets running Android.
  • 32. rot45065_cases19_01-32.indd 11 12/24/13 10:00 PM This document is authorized for use only by Deborah Melvin in MGMT-6990-1/WMBA-6990-1/WMBA-6990B-1-Capstone2020 Spring Sem 01/06-04/26-PT2 at Laureate Education - Walden University, 2020. 12 Apple (in 2013): How to Sustain a Competitive Advantage? Google would have more control over the hardware and ideally be able to optimize the hardware for future Android features. By controlling the software on mobile devices, Google plans to also control the ads shown to users, thus extending its hold on the digital ads market, its main source of revenue. Android is run on 79 percent of all smartphones. 82 Google’s Chromebook is a line of laptop computers running Google’s Chrome operating system. The Chrome OS is designed to provide the user with the minimal amount of hardware and installed applications needed. The user runs applications from the cloud and uses Google’s Chrome browser to access these applications. Several manufacturers such as Samsung, Acer, and HP are partnering with Google to create Chromebooks. Google is also looking to develop more web-connected services for people’s homes, powered by the Android operating system. In addition, Google is trying to enter the high-speed Internet market so it can deliver its products to customers without having to worry about poor connection
  • 33. speeds or being blocked by competitors. It began wiring homes in Kansas City, both the Missouri and Kansas sides, in 2012, with plans to expand to other locations around the U.S. in 2013. 83 Google is also attempting to hold off both Facebook and Amazon by enabling retailers to reach consumers through its search engine exclusively. MICROSOFT The partnership that Paul Allen and Bill Gates formed in 1975 started out small, but Gates and Allen had a vision to one day put a computer in everyone’s home. During the next several decades, their company, Microsoft, revolutionized the way people work and play on their computers. 84 In the 1990s and early 2000s, Microsoft dominated the technology market with its Windows operating system. As it watched the likes of BlackBerry and Apple post substantial profit numbers, it decided to enter the smart- phone market and introduced the first Windows phone in late 2010, and then a second model in 2012. In early 2011, Microsoft announced that it was entering into a partnership with Nokia. Under the agreement, Nokia agreed to use the Windows phone as its primary smartphone and to leverage its strengths in imaging, design, and pricing structure to drive growth for both companies. Nokia’s CEO, Stephen Elop, boldly stated that the smartphone market was now a “three-horse race” among itself, Apple, and Samsung. 85 Microsoft has its own tablet PC to compete with the iPad. The Microsoft Surface was released in October of 2012 with a large campaign to compare it to the iPad. The Surface has an attachable keyboard/cover, a USB port,
  • 34. and runs the Windows 8 operating system. Like Apple, Microsoft has also opened its own stores to sell Microsoft products and third-party products that run Microsoft’s software. (See Exhibit 16 for Microsoft’s financials.) NOKIA In 1922, three companies spanning five industries—rubber, cable, forestry, electronics, and power generation— officially merged to become the Nokia corporation. By 1998, the company had become the global leader in mobile phones and posted sales of over €30 billion. In 2005, the company sold its billionth phone, but by 2010 it was struggling to compete against more popular Samsung and Apple products. 86 In early 2011, Nokia announced that it was entering into a partnership with Microsoft to try to become a top competitor in the smartphone market. Later that same year, it launched two models of the Nokia Lumia phone, both of which run Windows phone software. In September of 2012, the latest model, the Nokia Lumia 920, was launched to dismal reviews, with most tech savvy people stating that there was no reason for current Android or iPhone customers to switch. The company’s stock price continued to fall, dropping to $2.50 a share after the new model introduction. 87 (See Exhibit 17 .) rot45065_cases19_01-32.indd 12 12/24/13 10:00 PM This document is authorized for use only by Deborah Melvin in MGMT-6990-1/WMBA-6990-1/WMBA-6990B-1-Capstone2020 Spring Sem 01/06-04/26-PT2 at Laureate Education - Walden University, 2020.
  • 35. Apple (in 2013): How to Sustain a Competitive Advantage? 13 SAMSUNG On March 1, 1938, Byung-Chull Lee started Samsung, which means three stars in Korean, as a small export business focusing primarily on fish, vegetables, and fruit. Within a little over 10 years, Samsung would have its own manufacturing and sales operations. Today, the technology giant sells products around the globe and is instantly recognized for its innovative, consumer-driven products. 88 (See Exhibit 18 for Samsung’s financials.) By 2012, Samsung Electronics had become the global smartphone market leader, due mostly to its extremely successful Galaxy S device and subsequent versions, which run on Google’s Android operating system. The phone is comparable in both design and technical features to the iPhone and poses the biggest competitive threat to Apple. It is estimated that Samsung holds a 28 percent share of the smartphone market, up from 20 percent in 2011. It is the global leader in smartphone sales. Meanwhile, Apple’s share was 20.5 percent in 2012, up from 19 percent in 2011. 89 Together, Samsung and Google have been able to act as complementors to provide a product comparable in quality and experience to the iPhone. With Samsung’s manufacturing and hardware expertise and Google’s software and user experience expertise, Apple faces potentially its strongest competitor. One of the main drivers of Samsung’s rise has been its two-
  • 36. pronged pricing structure. Its premium products are priced similarly to Apple’s in the U.S., but the company also heavily discounts the prices of some phones, sometimes to less than a quarter of the suggested retail price. Additionally, Samsung manufactures all of its own smartphones, including the components, which gives it a distinct cost advantage over its closest competitors. Even Apple uses Samsung to manufacture a portion of its iPhone product line. Meanwhile, for the low-end and emerg- ing smartphone markets, Samsung provides products that compete directly with Microsoft’s Windows phone. The intense competition between Apple and Samsung has led to many legal battles, mostly over patent infringement. In August 2012, a U.S. federal court ruled in favor of Apple in one such case, awarding it more than $1 billion in damages (later reduced to some $500 million). Separate infringement cases are pending in various other countries around the world pertaining to the design and technology of both companies’ devices. Challenges Ahead Apple has created a competitive advantage through its differentiated products, brand loyalty, and seamlessly integrated devices. However, Tim Cook knows the competition is constantly looking at new ways to take market share away from the company. How should he respond to the constant pressure? And where is Apple’s future growth going to come from? A new, less expensive iPhone? The next generation iPad? Or another revolutionary product such as WebTV or smartwatches? Other category- defining products and services? There are also emerging economies, such as China and Brazil, to consider. Sales to these countries could
  • 37. make any company an industry leader with the key advantages they offer: large populations, growing disposable incomes, and low cost of living. How should Apple compete in these markets? Should it stay with its differenti- ated, premium-price strategy around the world? Or should it let low-price, low-margin products from other com- petitors battle it out in these areas? Tim Cook not only has some enormous strategic decisions to make in the short term but also needs to decide where and how Apple should compete in the long term. Given the blurring industry boundaries that allow capable competitors to put pressure on Apple, Cook needs to carefully plan the company’s next moves if he wants to sus- tain Apple’s competitive advantage. As his MacBook Pro boots up, Cook pops open a can of low-carb Monster Energy drink and begins to jot down some of his thoughts. rot45065_cases19_01-32.indd 13 12/24/13 10:00 PM This document is authorized for use only by Deborah Melvin in MGMT-6990-1/WMBA-6990-1/WMBA-6990B-1-Capstone2020 Spring Sem 01/06-04/26-PT2 at Laureate Education - Walden University, 2020. 14 Apple (in 2013): How to Sustain a Competitive Advantage? EXHIBIT 1 Apple’s Daily Market Cap since December 2011 700 650
  • 42. pr -1 3 $370 Apple Inc. M ar ke t C ap ( in U .S . $ bi lli on s) Source: Author’s depiction of publicly available data drawn from Bloomberg.
  • 43. rot45065_cases19_01-32.indd 14 12/24/13 10:00 PM This document is authorized for use only by Deborah Melvin in MGMT-6990-1/WMBA-6990-1/WMBA-6990B-1-Capstone2020 Spring Sem 01/06-04/26-PT2 at Laureate Education - Walden University, 2020. Apple (in 2013): How to Sustain a Competitive Advantage? 15 Net Sales by Operating Segment 2008 2009 2010 2011 2012 Americas net sales 16,447 18,981 24,498 38,315 57,512 Europe net sales 9,233 11,810 18,692 27,778 36,323 Japan net sales 1,728 2,279 3,981 5,437 10,571 Asia-Pacific net sales 2,791 3,179 8,256 22,592 33,274 Retail net sales 7,292 6,656 9,798 14,127 18,828 Total net sales 37,491 42,905 65,225 108,249 156,508 Note: Other segments include Asia Pacific and FileMaker. Source: Apple Annual Reports 2008–2012. EXHIBIT 2A Apple’s Regional Sales, 2008–2012 (in $ millions) S
  • 44. al es ( in $ m ill io ns ) Year 2008 2009 2010 2011 2012 10,000 0 20,000 30,000 40,000 50,000 60,000 Americas Europe
  • 45. Japan Asia-Pacific Retail Apple Net Sales by Market (2008−2012) rot45065_cases19_01-32.indd 15 12/24/13 10:00 PM This document is authorized for use only by Deborah Melvin in MGMT-6990-1/WMBA-6990-1/WMBA-6990B-1-Capstone2020 Spring Sem 01/06-04/26-PT2 at Laureate Education - Walden University, 2020. 16 Apple (in 2013): How to Sustain a Competitive Advantage? Unit Sales by Product 2008 2009 2010 2011 2012 Desktops a 3,712 3,182 4,627 4,669 4,656 Portables b 6,003 7,214 9,035 12,066 13,502 Total Mac unit sales 9,715 10,396 13,662 16,735 18,158 Net sales per Mac unit sold c $1,478 $1,333 $1,279 $1,301 $1,278 iPod units sold 54,828 54,132 50,312 46,620 35,165
  • 46. Net sales per iPod unit sold c $167 $149 $164 $174 $159 iPhone units sold 11,627 20,731 39,989 32,394 58,310 a Includes iMac, Mac mini, and Mac Pro product lines (2008– 2010 numbers also include Power Mac and Xserve product lines). b Includes MacBook, iBook, MacBook Air, MacBook Pro, and PowerBook product lines. c Derived by dividing total product-related net sales by total product-related unit sales. Source: Apple Annual Reports 2008–2012. EXHIBIT 2C Unit Sales by Product, 2008–2012 (in millions, except sales-per-unit-sold data) Net Sales by Product 2008 2009 2010 2011 2012 Desktops a 5,622 4,324 6,201 6,439 6,040 Portables b 8,732 9,535 11,278 15,344 17,181 Total Mac net sales 14,354 13,859 17,479 21,783 23,221 iPod 9,153 8,091 8,274 7,453 5,615 Other music-related products and services c 3,340 4,036 4,948 6,314 8,534 iPhone and services d 6,742 13,033 25,179 47,057 80,477 iPad and related products e 4,958 20,358 32,424 Peripherals and hardware f 1,694 1,475 1,814 2,330
  • 47. 2,778 Software and service sales g 2,208 2,411 2,573 2,954 3,459 Total net sales 37,491 42,905 65,225 108,249 156,508 a Includes iMac, Mac mini, and Mac Pro product lines (2008– 2010 numbers also include Power Mac and Xserve product lines). b Includes MacBook, iBook, MacBook Air, MacBook Pro, and PowerBook product lines. c Includes sales from iTunes Store, App Store, and iBookstore, as well as sales of iPod services and Apple-branded and third-party iPod accessories. d Includes revenue recognized from iPhone sales, carrier agreements, services, and Apple-branded and third-party iPhone accessories. e Includes revenue recognized from iPad sales, services, and Apple-branded and third-party iPad accessories. f Includes sales of displays, wireless connectivity and networking solutions, and other hardware accessories. g Includes sales of Apple-branded operating system and application software, third-party software, and Mac and Internet services. Source: Apple Annual Reports 2008–2012. EXHIBIT 2B Net Sales by Product, 2008–2012 (in $ millions) rot45065_cases19_01-32.indd 16 12/24/13 10:00 PM This document is authorized for use only by Deborah Melvin in MGMT-6990-1/WMBA-6990-1/WMBA-6990B-1-Capstone2020 Spring Sem 01/06-04/26-PT2 at Laureate Education - Walden University, 2020.
  • 48. Apple (in 2013): How to Sustain a Competitive Advantage? 17 Fiscal Year 2008 2009 2010 2011 2012 Cash and short-term investments 24,490 23,464 25,620 25,952 29,129 Receivables–total 4,704 5,057 9,924 11,717 18,692 Inventories–total 509 455 1,051 776 791 Property, plant, and equipment–total (net) 2,455 2,954 4,768 7,777 15,452 Depreciation, depletion, and amortization (accumulated) 1,292 1,713 2,466 3,991 6,435 Assets–total 39,572 47,501 75,183 116,371 176,064 Accounts payable–trade 5,520 5,601 12,015 14,632 21,175 Long-term debt 0 0 0 0 0 Liabilities–total 18,542 15,861 27,392 39,756 57,854 Stockholders’ equity–total 21,030 31,640 47,791 76,615 118,210 Sales (net) 32,479 42,905 65,225 108,249 156,508 Cost of goods sold 20,898 24,999 38,609 62,609 84,641
  • 49. Selling, general, and administrative expense 4,870 5,482 7,299 10,028 13,421 Income taxes 2,061 3,831 4,527 8,283 14,030 Income before extraordinary items 4,834 8,235 14,013 25,922 41,733 Net income (loss) 4,834 8,235 14,013 25,922 41,733 Earnings per share (basic) excluding extraordinary items 5.48 9.22 15.41 28.05 44.64 Earnings per share (diluted) excluding extraordinary items 5.36 9.08 15.15 27.68 44.15 Source: Compustat. EXHIBIT 3 Apple Financial Data, 2008–2012 (in $ millions, except EPS data) EXHIBIT 4 Apple’s Stock Price and NASDAQ, September 1984–August 2011 Source: Author’s depiction of publicly available data drawn from Yahoo. 7,000% Aug 23, 2011 Steve Jobs’ last day as CEO Sept 16, 1997 Steve Jobs becomes CEO
  • 51. Ja n 2 00 1 Ja n 2 00 2 Ja n 2 00 3 Ja n 2 00 4 Ja n 2 00 5 Ja n 2 00 6
  • 52. Ja n 2 00 7 Ja n 2 00 8 Ja n 2 00 9 Ja n 2 01 0 Au g 2 01 1 Apple Inc. NASDAQ Composite Index rot45065_cases19_01-32.indd 17 12/24/13 10:00 PM
  • 53. This document is authorized for use only by Deborah Melvin in MGMT-6990-1/WMBA-6990-1/WMBA-6990B-1-Capstone2020 Spring Sem 01/06-04/26-PT2 at Laureate Education - Walden University, 2020. 18 Apple (in 2013): How to Sustain a Competitive Advantage? EXHIBIT 5 Apple’s Stock Price and NASDAQ, August 2011– April 2013 Source: Author’s depiction of publicly available data drawn from Yahoo. 80% 90% 60% 70% 50% 40% 30% 20% 10% 210%
  • 54. 0% 2011 2012Oct Feb Mar Apr August 24, 2011 Tim Cook’s first day as CEO May Jun Jul Aug Sep Oct Nov Dec Feb Mar Apr2013Nov Dec NASDAQ Composite Index Apple Inc. EXHIBIT 6 Apple’s Stock Price, August 2011–September 2012 Source: Author’s depiction of publicly available data drawn from MSN Money. Se p 2 01 1 Oc t 2 01 1 No v 2 01 1
  • 55. De c 2 01 1 Ja n 2 01 2 Fe b 2 01 2 Ma r 2 01 2 Ap r 2 01 2 Ma y 2 01 2
  • 56. Ju n 2 01 2 Ju l 2 01 2 Au g 2 01 2 Se p 2 01 2 Sept 21, 2012 Launch of iPhone 5 700 675 650 625 600 575 550 525
  • 57. 500 475 450 425 400 375 350 S to ck P ri ce Time August 24, 2011 Tim Cook appointed CEO rot45065_cases19_01-32.indd 18 12/24/13 10:00 PM This document is authorized for use only by Deborah Melvin in MGMT-6990-1/WMBA-6990-1/WMBA-6990B-1-Capstone2020 Spring Sem 01/06-04/26-PT2 at Laureate Education - Walden University, 2020. Apple (in 2013): How to Sustain a Competitive Advantage? 19 R&D, Most Recent
  • 58. Rank Company Four Quarters Selected % of Revenue 1 Microsoft $9,043,000 12.93 2 Intel 8,350,000 15.46 3 IBM 6,258,000 5.85 4 Cisco 5,823,000 13.47 5 Google 5,162,000 13.62 6 Oracle 4,519,000 12.69 7 Hewlett-Packard 3,254,000 2.56 8 Apple 2,429,000 2.24 9 SAP 2,320,000 13.87 10 EMC 2,149,000 10.74 11 Advanced Micro Devices 1,453,000 22.12 12 BlackBerry 1,351,000 6.79 13 Yahoo 919,000 18.44 14 Seagate 875,000 7.98 15 Symantec 862,000 13.93 Source: Adapted from Robert Herzberg, “Top 50 Technology R&D Spenders,” CIO Zone, http://bit.ly/gD0pRS .
  • 59. EXHIBIT 7 R&D Spending at Selected Tech Companies, 2011 (in thousands) rot45065_cases19_01-32.indd 19 12/24/13 10:00 PM This document is authorized for use only by Deborah Melvin in MGMT-6990-1/WMBA-6990-1/WMBA-6990B-1-Capstone2020 Spring Sem 01/06-04/26-PT2 at Laureate Education - Walden University, 2020. 20 Apple (in 2013): How to Sustain a Competitive Advantage? EXHIBIT 8 Apple’s Net Income ($ millions) and Key Events over Time, 1981–2012 40,000 36,000 32,000 28,000 24,000 20,000 16,000 N et
  • 62. 07 20 09 20 11 20 12 Apple ll Apple Macintosh LaserWriter Steve Jobs returns Powerbook G3 iPod 1st generation iMac iTunes Intel-based Macs iPhone 1st generation iPhone 3G iPhone 3GS, iPad iPhone 4S iPad Mini, iPhone 5 Source: Author’s depiction of publicly available data drawn from Compustat and various Apple annual reports.
  • 63. rot45065_cases19_01-32.indd 20 12/24/13 10:00 PM This document is authorized for use only by Deborah Melvin in MGMT-6990-1/WMBA-6990-1/WMBA-6990B-1-Capstone2020 Spring Sem 01/06-04/26-PT2 at Laureate Education - Walden University, 2020. Apple (in 2013): How to Sustain a Competitive Advantage? 21 EXHIBIT 9 Percent Growth in Stock Price since 1990 Source: Author’s depiction of publicly available data. 20,000% 15,000% 10,000% Microsoft 5,000% 19 90 19 91 19 92
  • 66. Amazon Google EXHIBIT 10 Percent Growth in Stock Price in 2013 Source: Author’s depiction of publicly available data. 20% 220% 225% 230% 235% 9- Ja n 16 -J an 23 -J an 30 -J
  • 69. 0% Amazon Apple Microsoft Samsung Google rot45065_cases19_01-32.indd 21 12/24/13 10:00 PM This document is authorized for use only by Deborah Melvin in MGMT-6990-1/WMBA-6990-1/WMBA-6990B-1-Capstone2020 Spring Sem 01/06-04/26-PT2 at Laureate Education - Walden University, 2020. 22 Apple (in 2013): How to Sustain a Competitive Advantage? EXHIBIT 11 Market Cap in 2013 Source: Author’s depiction of publicly available data. 100 0 1/ 1/
  • 74. U S D B ill io ns HTC Samsung Apple Motorola BlackBerry rot45065_cases19_01-32.indd 22 12/24/13 10:00 PM This document is authorized for use only by Deborah Melvin in MGMT-6990-1/WMBA-6990-1/WMBA-6990B-1-Capstone2020 Spring Sem 01/06-04/26-PT2 at Laureate Education - Walden University, 2020. Apple (in 2013): How to Sustain a Competitive Advantage? 23 Fiscal Year 2008 2009 2010 2011 2012 Cash and short-term investments 3,727 6,366 8,762 9,576
  • 75. 11,448 Receivables–total 711 836 1,324 2,134 2,600 Inventories–total 1,399 2,171 3,202 4,992 6,031 Property, plant, and equipment–total (net) 854 1,290 2,414 4,417 7,060 Depreciation, depletion, and amortization (accumulated) 555 625 842 1,369 2,522 Assets–total 8,314 13,813 18,797 25,278 32,555 Accounts payable–trade 3,594 5,605 8,051 11,145 13,318 Long-term debt 533 252 641 1,415 3,830 Liabilities–total 5,642 8,556 11,933 17,521 24,363 Stockholders’ equity–total 2,672 5,257 6,864 7,757 8,192 Sales (net) 19,166 24,509 34,204 48,077 61,093 Cost of goods sold 14,585 18,594 26,009 36,288 44,271 Selling, general, and administrative expense 3,452 4,300 6,131 9,773 14,287 Income taxes 247 253 352 291 428 Income before extraordinary items 645 902 1,152 631 2 39 Net income (loss) 645 902 1,152 631 2 39
  • 76. Earnings per share (basic) excluding extraordinary items 1.52 2.08 2.58 1.39 2 0.09 Earnings per share (diluted) excluding extraordinary items 1.49 2.04 2.53 1.37 2 0.09 Source: Compustat. EXHIBIT 12 Amazon Financial Data, 2008–2012 (in $ millions, except EPS data) rot45065_cases19_01-32.indd 23 12/24/13 10:00 PM This document is authorized for use only by Deborah Melvin in MGMT-6990-1/WMBA-6990-1/WMBA-6990B-1-Capstone2020 Spring Sem 01/06-04/26-PT2 at Laureate Education - Walden University, 2020. 24 Apple (in 2013): How to Sustain a Competitive Advantage? Fiscal Year 2008 2009 2010 2011 2012 Cash and short-term investments 1,518 1,911 2,121 1,774 2,654 Receivables–total 2,270 2,800 4,279 3,693 3,222 Inventories–total 682 622 618 1,027 603 Property, plant, and equipment–total (net) 1,335 1,957 2,504 2,748 2,395
  • 77. Depreciation, depletion, and amortization (accumulated) 588 921 1,395 2,032 2,622 Assets–total 8,101 10,204 12,875 13,731 13,165 Accounts payable–trade 448 616 832 744 1,064 Long-term debt 0 0 0 0 0 Liabilities–total 2,227 2,602 3,937 3,631 3,705 Stockholders’ equity–total 5,874 7,603 8,938 10,100 9,460 Sales (net) 11,065 14,953 19,907 18,435 11,073 Cost of goods sold 5,835 8,064 10,593 10,890 6,339 Selling, general, and administrative expense 2,180 2,778 3,750 4,052 3,496 Income taxes 908 809 1,233 347 –592 Income before extraordinary items 1,893 2,457 3,411 1,164 –628 Net income (loss) 1,893 2,457 3,411 1,164 –646 Earnings per share (basic) excluding extraordinary items 3.35 4.35 6.36 2.22 –1.20 Earnings per share (diluted) excluding extraordinary items 3.30 4.31 6.34 2.22 –1.20 Source: Compustat. EXHIBIT 13 BlackBerry Financial Data, 2008–2012 (in $
  • 78. millions, except EPS data) rot45065_cases19_01-32.indd 24 12/24/13 10:00 PM This document is authorized for use only by Deborah Melvin in MGMT-6990-1/WMBA-6990-1/WMBA-6990B-1-Capstone2020 Spring Sem 01/06-04/26-PT2 at Laureate Education - Walden University, 2020. Apple (in 2013): How to Sustain a Competitive Advantage? 25 Fiscal Year 2010 2011 2012 Cash and short-term investments 1,785 3,908 9,626 Receivables–total 373 547 1,170 Inventories–total 0 0 0 Property, plant, and equipment–total (net) 574 1,475 2,391 Depreciation, depletion, and amortization (accumulated) 246 450 882 Assets–total 2,990 6,331 15,103 Accounts payable–trade 29 63 65 Long-term debt 367 398 1,991
  • 79. Liabilities–total 828 1,432 3,348 Stockholders’ equity–total 2,162 4,899 11,755 Sales (net) 1,974 3,711 5,089 Cost of goods sold 354 537 720 Selling, general, and administrative expense 449 1,095 3,187 Income taxes 402 695 441 Income before extraordinary items 606 1,000 53 Net income (loss) 606 1,000 53 Earnings per share (basic) excluding extraordinary items 0.28 0.47 0.02 Earnings per share (diluted) excluding extraordinary items 0.28 0.47 0.02 Source: Compustat. EXHIBIT 14 Facebook Financial Data, 2010–2012 (in $ millions, except EPS data) rot45065_cases19_01-32.indd 25 12/24/13 10:00 PM This document is authorized for use only by Deborah Melvin in MGMT-6990-1/WMBA-6990-1/WMBA-6990B-1-Capstone2020
  • 80. Spring Sem 01/06-04/26-PT2 at Laureate Education - Walden University, 2020. 26 Apple (in 2013): How to Sustain a Competitive Advantage? Fiscal Year 2008 2009 2010 2011 2012 Cash and short-term investments 15,846 24,485 34,975 44,626 48,088 Receivables–total 2,642 3,202 5,002 6,172 8,585 Inventories–total 0 0 0 0 505 Property, plant, and equipment–total (net) 5,234 4,845 7,759 9,603 11,854 Depreciation, depletion, and amortization (accumulated) 2,342 3,286 4,012 4,797 5,843 Assets–total 31,768 40,497 57,851 72,574 93,798 Accounts payable–trade 178 216 483 588 2,012 Long-term debt 0 0 0 2,986 2,988 Liabilities–total 3,529 4,493 11,610 14,429 22,083 Stockholders’ equity–total 28,239 36,004 46,241 58,145 71,715 Sales (net) 21,796 23,651 29,321 37,905 50,175
  • 81. Cost of goods sold 7,130 7,338 9,036 11,351 17,633 Selling, general, and administrative expense 6,447 6,468 8,523 12,475 16,284 Income taxes 1,627 1,861 2,291 2,589 2,598 Income before extraordinary items 4,227 6,520 8,505 9,737 10,788 Net income (loss) 4,227 6,520 8,505 9,737 10,737 Earnings per share (basic) excluding extraordinary items 13.46 20.62 26.69 30.17 32.97 Earnings per share (diluted) excluding extraordinary items 13.31 20.41 26.31 29.76 32.46 Source: Compustat. EXHIBIT 15 Google Financial Data, 2008–2012 (in $ millions, except EPS data) rot45065_cases19_01-32.indd 26 12/24/13 10:00 PM This document is authorized for use only by Deborah Melvin in MGMT-6990-1/WMBA-6990-1/WMBA-6990B-1-Capstone2020 Spring Sem 01/06-04/26-PT2 at Laureate Education - Walden University, 2020. Apple (in 2013): How to Sustain a Competitive Advantage? 27
  • 82. Fiscal Year 2008 2009 2010 2011 2012 Cash and short-term investments 23,662 31,447 36,788 52,772 63,040 Receivables–total 13,589 11,192 13,014 14,987 15,780 Inventories–total 985 717 740 1,372 1,137 Property, plant, and equipment–total (net) 6,242 7,535 7,630 8,162 8,269 Depreciation, depletion, and amortization (accumulated) 6,302 7,547 8,629 9,829 10,962 Assets–total 72,793 77,888 86,113 108,704 121,271 Accounts payable–trade 4,034 3,324 4,025 4,197 4,175 Long-term debt 1 3,756 4,939 11,921 10,713 Liabilities–total 36,507 38,330 39,938 51,621 54,908 Stockholders’ equity–total 36,286 39,558 46,175 57,083 66,363 Sales (net) 60,420 58,437 62,484 69,943 73,723 Cost of goods sold 9,726 9,864 9,888 13,040 14,772 Selling, general, and administrative expense 24,817 25,589 25,932 27,205 28,237 Income taxes 6,133 5,252 6,253 4,921 5,289
  • 83. Income before extraordinary items 17,681 14,569 18,760 23,150 16,978 Net income (loss) 17,681 14,569 18,760 23,150 16,978 Earnings per share (basic) excluding extraordinary items 1.90 1.63 2.13 2.73 2.02 Earnings per share (diluted) excluding extraordinary items 1.87 1.62 2.10 2.69 2.00 Source: Compustat. EXHIBIT 16 Microsoft Financial Data, 2008–2012 (in $ millions, except EPS data) rot45065_cases19_01-32.indd 27 12/24/13 10:00 PM This document is authorized for use only by Deborah Melvin in MGMT-6990-1/WMBA-6990-1/WMBA-6990B-1-Capstone2020 Spring Sem 01/06-04/26-PT2 at Laureate Education - Walden University, 2020. 28 Apple (in 2013): How to Sustain a Competitive Advantage? Fiscal Year 2008 2009 2010 2011 2012 Cash and short-term investments 9,493 12,717 16,288 14,143 13,066 Receivables–total 13,145 11,438 10,045 9,316 7,320
  • 84. Inventories–total 3,526 2,673 3,348 3,023 2,028 Property, plant, and equipment–total (net) 2,909 2,676 2,593 2,390 1,887 Depreciation, depletion, and amortization (accumulated) 4,958 5,131 4,876 4,943 4,670 Assets–total 55,094 51,220 51,912 46,969 39,491 Accounts payable–trade 7,273 7,094 8,095 7,177 5,794 Long-term debt 1,198 6,352 5,629 5,149 6,708 Liabilities–total 32,114 30,081 30,375 28,916 27,034 Stockholders’ equity–total 19,776 18,758 19,086 15,403 10,629 Sales (net) 71,168 59,094 56,639 50,375 40,075 Cost of goods sold 45,988 39,131 38,756 35,122 28,399 Selling, general, and administrative expense 13,520 13,739 12,567 12,047 10,751 Income taxes 1,505 1,006 588 376 1,510 Income before extraordinary items 5,551 1,277 2,455 2 1,510 2 4,096 Net income (loss) 5,551 1,277 2,455 2 1,510 2 4,096 Earnings per share (basic) excluding extraordinary items 1.49 0.34 0.66 2 0.40 2 1.11
  • 85. Earnings per share (diluted) excluding extraordinary items 1.46 0.34 0.66 2 0.40 2 1.11 Source: Compustat. EXHIBIT 17 Nokia Financial Data, 2008–2012 (in $ millions, except EPS data) rot45065_cases19_01-32.indd 28 12/24/13 10:00 PM This document is authorized for use only by Deborah Melvin in MGMT-6990-1/WMBA-6990-1/WMBA-6990B-1-Capstone2020 Spring Sem 01/06-04/26-PT2 at Laureate Education - Walden University, 2020. Apple (in 2013): How to Sustain a Competitive Advantage? 29 Fiscal Year 2008 2009 2010 2011 2012 Cash and short-term investments 18,311 25,584 20,943 25,040 34,888 Receivables–total 12,672 17,832 19,852 22,502 24,851 Inventories–total 8,844 9,299 12,451 14,642 16,534 Property, plant, and equipment–total (net) 39,591 37,094 49,343 57,802 63,802 Depreciation, depletion, and amortization (accumulated) 45,991 52,619 58,293 67,010 0
  • 86. Assets–total 98,101 110,195 125,107 144,991 168,692 Accounts payable–trade 5,205 7,671 8,523 9,574 8,840 Long-term debt 5,743 3,418 1,138 4,623 5,080 Liabilities–total 39,479 42,135 41,867 50,109 55,517 Stockholders’ equity–total 0 0 83,240 94,882 113,175 Sales (net) 113,001 129,491 144,058 153,721 187,354 Cost of goods sold 74,583 82,258 85,571 92,438 104,180 Selling, general, and administrative expense 23,394 26,050 32,387 34,222 41,557 Income taxes 641 2,175 2,965 3,191 5,655 Income before extraordinary items 5,148 8,990 14,719 12,446 21,600 Net income (loss) 4,451 7,784 14,533 10,800 18,754 Earnings per share (basic) excluding extraordinary items 35.11 61.02 98.75 82.98 143.49 *Converted from South Korean Won (KWN) at 1 W 5 0.00093163$US. Source: Compustat. EXHIBIT 18 Samsung Financial Data, 2008–2012 (in $ millions,* except EPS data) rot45065_cases19_01-32.indd 29 12/24/13 10:00 PM
  • 87. This document is authorized for use only by Deborah Melvin in MGMT-6990-1/WMBA-6990-1/WMBA-6990B-1-Capstone2020 Spring Sem 01/06-04/26-PT2 at Laureate Education - Walden University, 2020. 30 Apple (in 2013): How to Sustain a Competitive Advantage? Endnotes 1. Cook, T., Apple keynote address on iPhone 5, September 21, 2012, San Francisco, CA. 2. Ibid. 3. “New mobile phone signals Apple’s ambition,” The New York Times, January 9, 2007. 4. Jobs, S., Crunchbase, www.crunchbase.com/person/steve-jobs . 5. Jobs, S. (2005), “‘You’ve got to find what you love,’ Jobs says.” 6. Ibid. 7. Ibid. 8. Ibid. 9. Ibid.
  • 88. 10. Sculley, J., and J. A. Byrne (1987), Odyssey: Pepsi to Apple (New York: Harper & Row). 11. “DoubleTwist remakes Apple’s classic 1984 ad with a new dictator: Steve Jobs,” TechCrunch, September 29, 2009. 12 . Text from Apple’s TV ad during Super Bowl, January 22, 1984. 13 . Jobs, S. (2005), “‘You’ve got to find what you love,’ Jobs says.” 14. Ibid. 15. Ibid. 16 . Isaacson, W. (2012), Steve Jobs (Simon & Schuster). 17 . “Disney buys Pixar,” CNN Money, January 25, 2006. 18. “Disney agrees to acquire Pixar in a $7 billion deal,” The New York Times, January 25, 2006. 19. “Apple Computer, Inc. agrees to acquire NeXT Software Inc.,” Apple Inc., December 20, 1996. 20. “Apple to trim jobs and its product line,” The New York Times, March 15, 1997. 21. Yoffie, D. B., and R. Kim (2010), “Apple Inc. in 2010 (9-710-467),” Harvard Business School, April 13. 22 . “Steve Jobs’ Magic Kingdom,” BusinessWeek, February 2006. 23. “Dell: Apple should close shop,” CNET News,
  • 89. October 6, 1997. 24. Ibid. 24. “Microsoft and Apple affirm commitment to build next generation software for Macintosh,” Apple Inc., August 6, 1997. 26. Time, cover, September 12, 2006. 27. “Jonathan Ive and Apple win again,” BusinessWeek, June 7, 2007. 28. “Look forward in anger,” The Economist, March 18, 2010. 29. Hertzfeld, A. (1983), “Pirate flag,” Folklore, August, www.folklore.org/StoryView.py?story 5 Pirate_Flag.txt . 30. “Jobs at Apple,” www.apple.com/jobs/us/ . 31. Ibid. 32. Ibid. rot45065_cases19_01-32.indd 30 12/24/13 10:00 PM This document is authorized for use only by Deborah Melvin in MGMT-6990-1/WMBA-6990-1/WMBA-6990B-1-Capstone2020 Spring Sem 01/06-04/26-PT2 at Laureate Education - Walden University, 2020. Apple (in 2013): How to Sustain a Competitive Advantage? 31
  • 90. 33. Ibid. 34. “Growth by effort: The best company,” The Wise Nutrition, December 2008. 35. “Apple and Microsoft: Jobs barefoot under a tree,” Computergram International, January 26, 1999. 36. “Cult of Apple,” Uncyclopedia, http://uncyclopedia.wikia.com/wiki/Cult_of_Apple . 37. Jobs, S., Crunchbase, www.crunchbase.com/person/steve-jobs . 38. Rumelt, R. P. (2011), Good Strategy. Bad Strategy. The Difference and Why It Matters (New York, NY: Crown Business), p. 14. 39. Hill, C.W.L., and F. T. Rothaermel (2003), “The performance of incumbent firms in the face of radical technological innovation,” Academy of Management Review 28 (2): 257– 274. 40. “The seed of Apple’s innovation,” BusinessWeek, October 12, 2004. 41. “The second coming of Apple through a magical fusion of man—Steve Jobs—and company, Apple is becoming itself again: The little anticompany that could,” Fortune, November 9, 1998. 42. “Apple’s R&D spend reaches record high; execs excited as new products loom,” Computer World, July 24, 2013.
  • 91. 43. “Apple enjoys ongoing iPod demand,” BBC News, January 18, 2006. 44. “iPod tear-down suggests high Apple margins,” Apple Insider, September 15, 2006. 45. “iTunes store tops five billion songs,” Apple Inc., June 19, 2008. 46. “AAPL surges past $100, target at $140,” MacNN, April 26, 2007. 47. “Apple’s Jobs: Mobile Internet is terrible; iPhone delivers the real Internet,” Information Week, May 31, 2007. 48. “iPhone sales double in 2009 as Apple claims third place in smartphone sales,” MacRumors.com, February 23, 2010. 49. “Apple takes big gamble on new iPad,” The Wall Street Journal, January 25, 2010. 50. “Will the Apple iPad have Flash? Nope, and Adobe is mad,” Christian Science Monitor, January 28, 2010. 51. “Interest builds in Apple ahead of iPad’s launch,” The Wall Street Journal, March 20, 2010. 52. “Just a touch away, the elusive tablet PC,” The New York Times, October 4, 2009. 53. “Apple to take tablet beyond bathroom web browsing,” Apple Insider, October 5, 2009. 54. “Just a touch away, the elusive tablet PC.”
  • 92. 55. Jobs, S., Keynote address to introduce iPad, January 27, 2010, www.apple.com . 56. Ibid. 57. “The Microsofting of Apple,” The New York Times, February 10, 2010. 58. “Jobs, back at Apple, focuses on new tablet,” The Wall Street Journal, August 25, 2009. 59. “Apple takes big gamble on new iPad.” 60. “iPhone sales double in 2009 as Apple claims third place in smartphone sales.” 61. Jobs, S., Keynote address to introduce iPad. 62. Ibid. 63. “Apple’s showman takes the stage,” The Wall Street Journal, March 3, 2011. 64 . “Apple takes big gamble on new iPad.” rot45065_cases19_01-32.indd 31 12/24/13 10:00 PM This document is authorized for use only by Deborah Melvin in MGMT-6990-1/WMBA-6990-1/WMBA-6990B-1-Capstone2020 Spring Sem 01/06-04/26-PT2 at Laureate Education - Walden University, 2020. 32
  • 93. Apple (in 2013): How to Sustain a Competitive Advantage? 65. Jobs, S., Keynote address to introduce iPad. 66. “Apple says no to netbooks,” The New York Times, April 24, 2009. 67. Jobs, S., Keynote address to introduce iPad. 68. “Apple sees money in old media,” The Wall Street Journal, January 21, 2010. 69. “Just a touch away, the elusive tablet PC.” 70. “Apple takes big gamble on new iPad.” 71. “Books on iPad offer publishers a pricing edge,” The New York Times, January 29, 2010. 72. “Apple tablet portends rewrite for publishers,” The Wall Street Journal, January 27, 2010. 73. “U.S. alleges e-book scheme,” The Wall Street Journal, April 11, 2012. 74. http://finance.yahoo.com/q/is?s=AMZN+Income+Statement&an nual . 75. Jannarone, J. (2011), “Forecast for Best Buy: Worst is yet to come.” 76. www.amazon.com , http://money.cnn.com/magazines/fortune/fortune500/2012/full_l ist/ .
  • 94. 77. “Kindle Fire & Android gain, but Apple’s iPad holds commanding 81% tablet share,” AppleInsider, February 5, 2013. 78. http://www.BlackBerry.com/select/get_the_facts/pdfs/rim/rim_h istory.pdf . 79. “RIM: What the hell happened?” Fortune, May 30, 2012. 80. http://newsroom.fb.com/Key-Facts . 81. “Another setback for Facebook home,” The Wall Street Journal, May 23, 2013. 82. “Android obliterates smartphone market,” The Wall Street Journal, August 7, 2013. 83. “2013 preview; Apple vs. Google vs. Facebook vs. Amazon; The lines between software and hardware continue to blur,” The Wall Street Journal (online), December 25, 2012. 84. http://windows.microsoft.com/en- US/windows/history . 85. “Nokia and Microsoft announce plans for a broad strategic partnership to build a new global mobile ecosystem,” Microsoft press release ( www.microsoft.com ), February 10, 2011. 86. http://www.nokia.com/global/about-nokia/about- us/the-nokia-story/ .
  • 95. 87. “Nokia tumbles as Lumia launch event fails to impress,” Forbes, September 5, 2012. 88. http://www.samsung.com/us/aboutsamsung/corporateprofile/hist ory06.html . 89. “Has Apple lost its cool to Samsung?” The Wall Street Journal, January 28, 2013. rot45065_cases19_01-32.indd 32 12/24/13 10:00 PM This document is authorized for use only by Deborah Melvin in MGMT-6990-1/WMBA-6990-1/WMBA-6990B-1-Capstone2020 Spring Sem 01/06-04/26-PT2 at Laureate Education - Walden University, 2020. � � � � � � � �
  • 96. APPENDIX C COMPOUND INTEREST TABLES Values of Interest FactorsWhen n Equals Infinity Single Payment: Uniform Payment Series: (F/P, i, ∞) = ∞ (A/F, i, ∞) = 0 (P/F, i, ∞) = 0 (A/P, i, ∞) = i Arithmetic Gradient Series: (F/A, i, ∞) = ∞ (A/G, i, ∞) = 1/ i (P/A, i, ∞) = 1/ i (P/G, i, ∞) = 1/ i2 � � � � � � � � APPENDIX C: COMPOUND INTEREST TABLES 595 1/4% Compound Interest Factors 1/4%
  • 97. Single Payment Uniform Payment Series Arithmetic Gradient Compound Present Sinking Capital Compound Present Gradient Gradient Amount Worth Fund Recovery Amount Worth Uniform Present Factor Factor Factor Factor Factor Factor Series Worth Find F Find P Find A Find A Find F Find P Find A Find P Given P Given F Given F Given P Given A Given A Given G Given G n F/P P/F A/F A/P F/A P/A A/G P/G n 1 1.003 .9975 1.0000 1.0025 1.000 0.998 0.000 0.000 1 2 1.005 .9950 .4994 .5019 2.003 1.993 0.499 0.995 2 3 1.008 .9925 .3325 .3350 3.008 2.985 0.998 2.980 3 4 1.010 .9901 .2491 .2516 4.015 3.975 1.497 5.950 4 5 1.013 .9876 .1990 .2015 5.025 4.963 1.995 9.901 5 6 1.015 .9851 .1656 .1681 6.038 5.948 2.493 14.826 6 7 1.018 .9827 .1418 .1443 7.053 6.931 2.990 20.722 7 8 1.020 .9802 .1239 .1264 8.070 7.911 3.487 27.584 8 9 1.023 .9778 .1100 .1125 9.091 8.889 3.983 35.406 9 10 1.025 .9753 .0989 .1014 10.113 9.864 4.479 44.184 10 11 1.028 .9729 .0898 .0923 11.139 10.837 4.975 53.913 11 12 1.030 .9705 .0822 .0847 12.167 11.807 5.470 64.589 12 13 1.033 .9681 .0758 .0783 13.197 12.775 5.965 76.205 13 14 1.036 .9656 .0703 .0728 14.230 13.741 6.459 88.759 14 15 1.038 .9632 .0655 .0680 15.266 14.704 6.953 102.244 15 16 1.041 .9608 .0613 .0638 16.304 15.665 7.447 116.657 16 17 1.043 .9584 .0577 .0602 17.344 16.624 7.944 131.992 17 18 1.046 .9561 .0544 .0569 18.388 17.580 8.433 148.245 18 19 1.049 .9537 .0515 .0540 19.434 18.533 8.925 165.411 19 20 1.051 .9513 .0488 .0513 20.482 19.485 9.417 183.485 20
  • 98. 21 1.054 .9489 .0464 .0489 21.534 20.434 9.908 202.463 21 22 1.056 .9465 .0443 .0468 22.587 21.380 10.400 222.341 22 23 1.059 .9442 .0423 .0448 23.644 22.324 10.890 243.113 23 24 1.062 .9418 .0405 .0430 24.703 23.266 11.380 264.775 24 25 1.064 .9395 .0388 .0413 25.765 24.206 11.870 287.323 25 26 1.067 .9371 .0373 .0398 26.829 25.143 12.360 310.752 26 27 1.070 .9348 .0358 .0383 27.896 26.078 12.849 335.057 27 28 1.072 .9325 .0345 .0370 28.966 27.010 13.337 360.233 28 29 1.075 .9301 .0333 .0358 30.038 27.940 13.825 386.278 29 30 1.078 .9278 .0321 .0346 31.114 28.868 14.313 413.185 30 36 1.094 .9140 .0266 .0291 37.621 34.387 17.231 592.499 36 40 1.105 .9049 .0238 .0263 42.014 38.020 19.167 728.740 40 48 1.127 .8871 .0196 .0221 50.932 45.179 23.021 1 040.055 48 50 1.133 .8826 .0188 .0213 53.189 46.947 23.980 1 125.777 50 52 1.139 .8782 .0180 .0205 55.458 48.705 24.938 1 214.588 52 60 1.162 .8609 .0155 .0180 64.647 55.653 28.751 1 600.085 60 70 1.191 .8396 .0131 .0156 76.395 64.144 33.481 2 147.611 70 72 1.197 .8355 .0127 .0152 78.780 65.817 34.422 2 265.557 72 80 1.221 .8189 .0113 .0138 88.440 72.427 38.169 2 764.457 80 84 1.233 .8108 .0107 .0132 93.343 75.682 40.033 3 029.759 84 90 1.252 .7987 .00992 .0124 100.789 80.504 42.816 3 446.870 90 96 1.271 .7869 .00923 .0117 108.349 85.255 45.584 3 886.283 96 100 1.284 .7790 .00881 .0113 113.451 88.383 47.422 4 191.242 100 104 1.297 .7713 .00843 .0109 118.605 91.480 49.252 4 505.557 104 120 1.349 .7411 .00716 .00966 139.743 103.563 56.508 5 852.112 120 240 1.821 .5492 .00305 .00555 328.306 180.312 107.586 19
  • 99. 398.985 240 360 2.457 .4070 .00172 .00422 582.745 237.191 152.890 36 263.930 360 480 3.315 .3016 .00108 .00358 926.074 279.343 192.670 53 820.752 480 � � � � � � � � 596 APPENDIX C: COMPOUND INTEREST TABLES 1/2% Compound Interest Factors 1/2% Single Payment Uniform Payment Series Arithmetic Gradient Compound Present Sinking Capital Compound Present Gradient Gradient Amount Worth Fund Recovery Amount Worth Uniform Present Factor Factor Factor Factor Factor Factor Series Worth Find F Find P Find A Find A Find F Find P Find A Find P Given P Given F Given F Given P Given A Given A GivenG
  • 100. GivenG n F/P P/F A/F A/P F/A P/A A/G P/G n 1 1.005 .9950 1.0000 1.0050 1.000 0.995 0 0 1 2 1.010 .9901 .4988 .5038 2.005 1.985 0.499 0.991 2 3 1.015 .9851 .3317 .3367 3.015 2.970 0.996 2.959 3 4 1.020 .9802 .2481 .2531 4.030 3.951 1.494 5.903 4 5 1.025 .9754 .1980 .2030 5.050 4.926 1.990 9.803 5 6 1.030 .9705 .1646 .1696 6.076 5.896 2.486 14.660 6 7 1.036 .9657 .1407 .1457 7.106 6.862 2.980 20.448 7 8 1.041 .9609 .1228 .1278 8.141 7.823 3.474 27.178 8 9 1.046 .9561 .1089 .1139 9.182 8.779 3.967 34.825 9 10 1.051 .9513 .0978 .1028 10.228 9.730 4.459 43.389 10 11 1.056 .9466 .0887 .0937 11.279 10.677 4.950 52.855 11 12 1.062 .9419 .0811 .0861 12.336 11.619 5.441 63.218 12 13 1.067 .9372 .0746 .0796 13.397 12.556 5.931 74.465 13 14 1.072 .9326 .0691 .0741 14.464 13.489 6.419 86.590 14 15 1.078 .9279 .0644 .0694 15.537 14.417 6.907 99.574 15 16 1.083 .9233 .0602 .0652 16.614 15.340 7.394 113.427 16 17 1.088 .9187 .0565 .0615 17.697 16.259 7.880 128.125 17 18 1.094 .9141 .0532 .0582 18.786 17.173 8.366 143.668 18 19 1.099 .9096 .0503 .0553 19.880 18.082 8.850 160.037 19 20 1.105 .9051 .0477 .0527 20.979 18.987 9.334 177.237 20 21 1.110 .9006 .0453 .0503 22.084 19.888 9.817 195.245 21 22 1.116 .8961 .0431 .0481 23.194 20.784 10.300 214.070 22 23 1.122 .8916 .0411 .0461 24.310 21.676 10.781 233.680 23 24 1.127 .8872 .0393 .0443 25.432 22.563 11.261 254.088 24 25 1.133 .8828 .0377 .0427 26.559 23.446 11.741 275.273 25 26 1.138 .8784 .0361 .0411 27.692 24.324 12.220 297.233 26 27 1.144 .8740 .0347 .0397 28.830 25.198 12.698 319.955 27 28 1.150 .8697 .0334 .0384 29.975 26.068 13.175 343.439 28
  • 101. 29 1.156 .8653 .0321 .0371 31.124 26.933 13.651 367.672 29 30 1.161 .8610 .0310 .0360 32.280 27.794 14.127 392.640 30 36 1.197 .8356 .0254 .0304 39.336 32.871 16.962 557.564 36 40 1.221 .8191 .0226 .0276 44.159 36.172 18.836 681.341 40 48 1.270 .7871 .0185 .0235 54.098 42.580 22.544 959.928 48 50 1.283 .7793 .0177 .0227 56.645 44.143 23.463 1 035.70 50 52 1.296 .7716 .0169 .0219 59.218 45.690 24.378 1 113.82 52 60 1.349 .7414 .0143 .0193 69.770 51.726 28.007 1 448.65 60 70 1.418 .7053 .0120 .0170 83.566 58.939 32.468 1 913.65 70 72 1.432 .6983 .0116 .0166 86.409 60.340 33.351 2 012.35 72 80 1.490 .6710 .0102 .0152 98.068 65.802 36.848 2 424.65 80 84 1.520 .6577 .00961 .0146 104.074 68.453 38.576 2 640.67 84 90 1.567 .6383 .00883 .0138 113.311 72.331 41.145 2 976.08 90 96 1.614 .6195 .00814 .0131 122.829 76.095 43.685 3 324.19 96 100 1.647 .6073 .00773 .0127 129.334 78.543 45.361 3 562.80 100 104 1.680 .5953 .00735 .0124 135.970 80.942 47.025 3 806.29 104 120 1.819 .5496 .00610 .0111 163.880 90.074 53.551 4 823.52 120 240 3.310 .3021 .00216 .00716 462.041 139.581 96.113 13 415.56 240 360 6.023 .1660 .00100 .00600 1 004.5 166.792 128.324 21 403.32 360 480 10.957 .0913 .00050 .00550 1 991.5 181.748 151.795 27 588.37 480 �
  • 102. � � � � � � � APPENDIX C: COMPOUND INTEREST TABLES 597 3/4% Compound Interest Factors 3/4% Single Payment Uniform Payment Series Arithmetic Gradient Compound Present Sinking Capital Compound Present Gradient Gradient Amount Worth Fund Recovery Amount Worth Uniform Present Factor Factor Factor Factor Factor Factor Series Worth Find F Find P Find A Find A Find F Find P Find A Find P Given P Given F Given F Given P Given A Given A Given G Given G n F/P P/F A/F A/P F/A P/A A/G P/G n 1 1.008 .9926 1.0000 1.0075 1.000 0.993 0 0 1 2 1.015 .9852 .4981 .5056 2.008 1.978 0.499 0.987 2 3 1.023 .9778 .3308 .3383 3.023 2.956 0.996 2.943 3 4 1.030 .9706 .2472 .2547 4.045 3.926 1.492 5.857 4 5 1.038 .9633 .1970 .2045 5.076 4.889 1.986 9.712 5 6 1.046 .9562 .1636 .1711 6.114 5.846 2.479 14.494 6
  • 103. 7 1.054 .9490 .1397 .1472 7.160 6.795 2.971 20.187 7 8 1.062 .9420 .1218 .1293 8.213 7.737 3.462 26.785 8 9 1.070 .9350 .1078 .1153 9.275 8.672 3.951 34.265 9 10 1.078 .9280 .0967 .1042 10.344 9.600 4.440 42.619 10 11 1.086 .9211 .0876 .0951 11.422 10.521 4.927 51.831 11 12 1.094 .9142 .0800 .0875 12.508 11.435 5.412 61.889 12 13 1.102 .9074 .0735 .0810 13.602 12.342 5.897 72.779 13 14 1.110 .9007 .0680 .0755 14.704 13.243 6.380 84.491 14 15 1.119 .8940 .0632 .0707 15.814 14.137 6.862 97.005 15 16 1.127 .8873 .0591 .0666 16.932 15.024 7.343 110.318 16 17 1.135 .8807 .0554 .0629 18.059 15.905 7.822 124.410 17 18 1.144 .8742 .0521 .0596 19.195 16.779 8.300 139.273 18 19 1.153 .8676 .0492 .0567 20.339 17.647 8.777 154.891 19 20 1.161 .8612 .0465 .0540 21.491 18.508 9.253 171.254 20 21 1.170 .8548 .0441 .0516 22.653 19.363 9.727 188.352 21 22 1.179 .8484 .0420 .0495 23.823 20.211 10.201 206.170 22 23 1.188 .8421 .0400 .0475 25.001 21.053 10.673 224.695 23 24 1.196 .8358 .0382 .0457 26.189 21.889 11.143 243.924 24 25 1.205 .8296 .0365 .0440 27.385 22.719 11.613 263.834 25 26 1.214 .8234 .0350 .0425 28.591 23.542 12.081 284.421 26 27 1.224 .8173 .0336 .0411 29.805 24.360 12.548 305.672 27 28 1.233 .8112 .0322 .0397 31.029 25.171 13.014 327.576 28 29 1.242 .8052 .0310 .0385 32.261 25.976 13.479 350.122 29 30 1.251 .7992 .0298 .0373 33.503 26.775 13.942 373.302 30 36 1.309 .7641 .0243 .0318 41.153 31.447 16.696 525.038 36 40 1.348 .7416 .0215 .0290 46.447 34.447 18.507 637.519 40 48 1.431 .6986 .0174 .0249 57.521 40.185 22.070 886.899 48 50 1.453 .6882 .0166 .0241 60.395 41.567 22.949 953.911 50 52 1.475 .6780 .0158 .0233 63.312 42.928 23.822 1 022.64 52
  • 104. 60 1.566 .6387 .0133 .0208 75.425 48.174 27.268 1 313.59 60 70 1.687 .5927 .0109 .0184 91.621 54.305 31.465 1 708.68 70 72 1.713 .5839 .0105 .0180 95.008 55.477 32.289 1 791.33 72 80 1.818 .5500 .00917 .0167 109.074 59.995 35.540 2 132.23 80 84 1.873 .5338 .00859 .0161 116.428 62.154 37.137 2 308.22 84 90 1.959 .5104 .00782 .0153 127.881 65.275 39.496 2 578.09 90 96 2.049 .4881 .00715 .0147 139.858 68.259 41.812 2 854.04 96 100 2.111 .4737 .00675 .0143 148.147 70.175 43.332 3 040.85 100 104 2.175 .4597 .00638 .0139 156.687 72.035 44.834 3 229.60 104 120 2.451 .4079 .00517 .0127 193.517 78.942 50.653 3 998.68 120 240 6.009 .1664 .00150 .00900 667.901 111.145 85.422 9 494.26 240 360 14.731 .0679 .00055 .00805 1 830.8 124.282 107.115 13 312.50 360 480 36.111 .0277 .00021 .00771 4 681.5 129.641 119.662 15 513.16 480 � � � � � �