More Related Content
Similar to GHG Groundwater
Similar to GHG Groundwater (20)
GHG Groundwater
- 1. LIFE CYCLE ENERGY AND GREENHOUSE GAS EMISSION ANALYSIS OF
GROUNDWATER-BASED IRRIGATION SYSTEMS†
SHARMILA ACHARYA1
, BIJU GEORGE2
*, LU AYE1
, SUDEEP NAIR1
, BANDARA NAWARATHNA3
AND HECTOR MALANO1
1
Department of Infrastructure Engineering, The University of Melbourne, Victoria, 3010, Australia
2
Integrated Water and Land Management Program, ICARDA, Cairo, Egypt
3
Environment and Research Division, The Bureau of Meteorology, Australia
ABSTRACT
The reliance on groundwater for irrigation is increasing in Australia and India, which is causing concerns to policy
makers about energy consumption and greenhouse gas (GHG) emissions. Therefore, it is important to quantify the
GHG emissions of all components of the groundwater-based irrigation systems, over the entire life cycle to develop
more environmentally friendly groundwater management strategies. This study identified and analysed energy use and
GHG emissions associated with different components in the supply chain of groundwater-based irrigation systems. An
existing GHG emissions and energy-accounting framework was adapted to enhance its capabilities by considering dril-
ling techniques, water distribution and irrigation application methods. The results of this study highlighted that embodied
and direct GHG emissions from drilling tube wells were higher in the Musi catchment, India, compared to South
Australia. The study also highlighted that GHG emissions associated with water conveyance were higher for concrete
and plastic-lined channels than unlined channels. Drip irrigation systems in both countries were found to have more
GHG emissions than gravity-fed systems. Centre pivot systems were found to be emitting more than the drip systems
in South Australia. We conclude that different components of the system have an impact on total GHG emissions
and energy consumption for both countries. Any change in the most commonly used methods of drilling bore wells, wa-
ter distribution in channels, and the irrigation methods, will have distinct impacts on energy consumption rates and GHG
emissions. The developed conceptual framework provided a systematic complete analysis of the energy-consuming and
GHG-emitting components associated with groundwater-based irrigation systems. Policy makers and decision makers
may use the developed framework to compare different system components to develop strategies that have minimal im-
pact on the environment. Copyright © 2015 John Wiley & Sons, Ltd.
key words: life cycle analysis; greenhouse gas emissions; groundwater irrigation
Received 7 March 2013; Revised 15 August 2014; Accepted 18 August 2014
RÉSUMÉ
Le recours à des eaux souterraines pour l’irrigation est en augmentation en Australie et en Inde, ce qui préoccupe les décideurs
politiques sur la consommation d’énergie et la production de gaz à effet de serre (GES). Par conséquent, il est important de
quantifier les émissions de GES de toutes les composantes des systèmes d’irrigation basé sur les eaux souterraines, sur le cycle
de vie complet afin d’élaborer des stratégies de gestion des eaux souterraines plus respectueuses de l’environnement. Cette
étude a identifié et analysé la consommation d’énergie et les émissions de GES associées aux différentes composantes de la
filière et de l’irrigation à base d’eaux souterraines. Un système de comptabilité des émissions réelles de GES et de l’énergie
a été adapté pour renforcer leurs capacités en tenant compte des techniques de forage, de la distribution de l’eau et des
méthodes d’application de l’irrigation. Les résultats de cette étude ont mis en évidence que les émissions grises et directes
de GES pendant le forage des puits ont été plus élevées dans le bassin versant de Musi en Inde par rapport à ceux d’Australie
*Correspondence to: Dr. Biju George, Integrated Water & Land Management Program, ICARDA, P. O. Box 2416, Cairo, Egypt. E-mail: b.george@cgiar.org
†
Analyse des cycle de vie de l’énergie et des émissions de gaz a effet de serre des systèmes d’irrigation basés sur des nappes souterraines.
IRRIGATION AND DRAINAGE
Irrig. and Drain. (2015)
Published online in Wiley Online Library (wileyonlinelibrary.com) DOI: 10.1002/ird.1896
Copyright © 2015 John Wiley & Sons, Ltd.
- 2. du Sud. L’étude a également souligné que les émissions de GES liées à l’adduction d’eau étaient plus élevées pour les canaux
revêtus de béton ou doublés de plastique que les canaux non revêtus. Les systèmes d’irrigation goutte à goutte dans les deux
pays émettent plus de GES que les systèmes d’alimentation par gravité. Les systèmes à pivot central émettent plus que les
systèmes de goutte à goutte en Australie du Sud. Nous concluons que les différentes composantes du système ont un impact
sur les émissions totales de GES et la consommation d’énergie pour les deux pays. Tout changement dans les méthodes les
plus couramment utilisées pour la réalisation des puits de forage, la distribution de l’eau dans les canaux et les méthodes
d’irrigation, aura des effets distincts sur les taux de consommation d’énergie et les émissions de GES. Le cadre conceptuel
élaboré permet l’analyse complète et systématique de la consommatrice d’énergie et de composants émetteurs de GES associés
à des systèmes d’irrigation basés sur les eaux souterraines. Les décideurs et les gestionnaires peuvent utiliser le cadre élaboré
pour comparer les différentes composantes du système à développer des stratégies qui ont un impact minimal sur
l’environnement. Copyright © 2015 John Wiley & Sons, Ltd.
mots clés: analyse du cycle de vie; émissions de gaz à effet de serre; irrigation avec des eaux souterraines
INTRODUCTION
The agricultural sector is the largest water user globally.
Groundwater is a highly important resource for irrigation
not only in ’India and Australia’ but also in many countries
in the world. More than 50% of the irrigation requirements
in India are met from groundwater sources (Shah et al.,
2003, 2004), whereas in Australia the contribution of
groundwater is 29%. Studies on the impacts of climate
change on agriculture suggest that the irrigation water
requirement is likely to increase in the future due to increas-
ing ambient temperature and higher variability of rainfall
(Nune et al., 2014). Irrigation involves extensive use of
energy as pumping is typically needed for lifting and distri-
bution to crops. Energy required for water delivery depends
on the location of the water source, its depth and the water
application method.
As the variability of surface water availability increases,
farmers will depend more on groundwater for irrigation to
improve supply reliability. The reliance on groundwater
for irrigation has introduced new concerns for policy makers
about energy consumption and greenhouse gas (GHG) emis-
sions, both of which are inextricably linked to agricultural
production. As one of the first studies focusing on energy
consumption and GHG emissions of groundwater-based ir-
rigation systems, Tyson et al. (2012) have shown, through
the development of a conceptual framework, the importance
of considering all necessary supply chain components,
which consist of embodied and operational energy and asso-
ciated GHG emissions. The study also showed that the mag-
nitude of embodied GHG emissions in comparison to the
operation of the systems varies according to location. Tyson
et al. (2012) limited their study to quantifying and compar-
ing the energy use and GHG emissions associated with only
groundwater pumping using three different pump types. The
study did not quantify the GHG emissions from other
components of the framework such as well drilling, water
distribution and irrigation application methods. Therefore,
it is important to quantify energy consumption and GHG
emissions of all the components associated with the entire
life cycle of groundwater-based irrigation systems. Such
an approach is critical to develop new strategies for making
the irrigation sector more environmentally friendly in
groundwater-dependent regions around the world.
The quantification of energy consumption and GHG emis-
sions associated with groundwater-based irrigation involves
several stages, beginning with drilling of the tube well to
delivering water onto the cropland using different water applica-
tion methods. Several of the steps are energy-intensive. To ef-
fectively develop more environmentally friendly groundwater
irrigation practices, the entire framework for groundwater-based
irrigation systems must be extended to identify all contributing
factors. Separately quantifying energy consumption rates as
well as their associated GHG emissions for each factor within
the life cycle framework plays a critical role in the process.
This study extended the conceptual framework developed
by Tyson et al. (2012) to incorporate all the supply-chain
components making up the life cycle of groundwater-based
irrigation systems. This extended framework allows
managers to determine which strategies provide improved
environmental performance in terms of energy consumption
and GHG emissions for groundwater-dependent irrigation
regions in both countries.
BACKGROUND
Tyson et al. (2012) estimated embodied GHG emissions in
addition to operational GHG emissions for groundwater irri-
gation. The conceptual framework developed was applied to
quantify energy consumption and the GHG emissions asso-
ciated with pumping of groundwater from the bore/well; and
conveyance of the water through PVC fabricated pipe to the
surface. In that paper, the life cycle energy consumptions
and life cycle GHG emissions of three of the most common
pump power sources used (electricity, diesel, and a diesel-
powered electric generator) in Australia and India were
compared for one-pump farms.
S. ACHARYA ET AL.
Copyright © 2015 John Wiley & Sons, Ltd. Irrig. and Drain. (2015)
- 3. Several previous studies (Amaya, 2000; Chen et al.,
2005; Lukose, 2005; Jacobs, 2006) have analysed the life
cycle energy consumption of the most commonly used
irrigation systems in Australia. However, these studies
lacked the analysis of embodied GHG emissions of irriga-
tion systems. The previous life cycle energy consumption
analyses considered embodied, recurring, operational, and
decommissioning energy for all the irrigation distribution
systems investigated, however it only considered opera-
tional energy when calculating the GHG emissions for each
irrigation method (Aye et al., 2007). Additionally, the units
applied to calculate energy consumption rates were in
GJ haÀ1
yrÀ1
, which also affected the ability to make ade-
quate comparisons for water consumed.
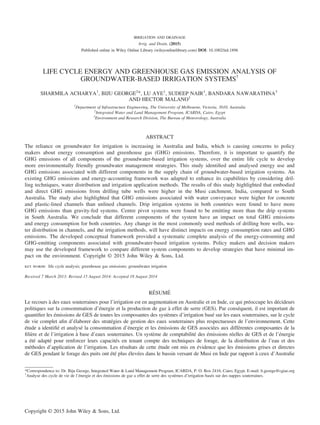
CONCEPTUAL FRAMEWORK
Relevant literature on GHG emissions from agriculture as
well as life cycle and supply chain methodologies was used
to break down the total emissions associated with ground-
water irrigation into its contributing elements. The frame-
work developed by Tyson et al. (2012) has been extended
(Figure 1) to include the complete life cycle energy
consumption and GHG emissions of all components of the
water supply system, from groundwater tube well drilling
to water application onto cropland.
The system boundaries determined for the study as shown
in Figure 1 involves three main elements:
• different components (levels) along the path of water
delivery (right-hand box);
• energy consumption and GHG emissions associated
with each contributing activity (left-hand box);
• life cycle assessment of energy and GHG over the life
cycle of each contributing activity.
The energy-consuming and GHG emission-contributing
components that were added in the revised framework for
use in modelling are in non-shaded (white) text boxes in
Figure 1 (i.e. well/bore, pipe/channel, and irrigation
methods). The last life cycle component (i.e. crop) was not
considered in detail since only one crop type was considered
for each study region. The crop type used for each study
region was chosen based on available literature on current
practice (Jackson et al., 2010; George et al., 2011a).
Life cycle and supply chain boundaries
System boundaries were considered for each energy-
consuming and GHG-emitting component of the water
supply chain and all upstream activities involved in each
segment of the supply chain. Published component specifi-
cations were available for specific items; however, several
components of the supply chain required further assump-
tions (Tyson et al., 2012). For ease of comparison between
water supply scenarios, the model is developed to quantify
energy consumption and GHG emissions per unit of water
delivered (MJ MLÀ1
, kg CO2-e MLÀ1
).
Life cycle energy and greenhouse gas emissions
Modelling methodology. A supply chain and life cycle
energy consumption and GHG emissions calculation model
was created in Microsoft Excel™
. The model estimates the
total quantity of energy consumption and GHG emissions
of the groundwater-based irrigation segments of the supply
chain considered in this study including the tube well, the
conveyance channel, and the irrigation application onto the
cropland (Figure 1). The lifetime of the bore was assumed
to be 50 years for both Australia and India. The energy
required for maintenance and repair of tube well was not
considered in this study.
The units used in the literature to present life cycle energy
consumption and GHG emissions in agriculture are diverse.
A summary of parameters and variables and parameter
values used in this study is shown in Table I.
Study areas. Two study areas, one in Australia and one
in India, were selected for this study. In Australia, an area in
the south-east (SE) of South Australia was studied and in
India, the Musi catchment in Andhra Pradesh was selected
(George et al., 2011a, 2011b). These study areas were
selected because of their dependence on groundwater and
data availability (Jackson et al., 2010, George et al., 2011a).
Data collection and assumptions.
Tube well drilling. For the Musi site all drilling-related
data were obtained from relevant literature sources (Massuel
et al., 2013; George et al., 2011a) and for the SE of South
Australia relevant data were collected through discussion
with a senior drilling engineer (Noonan, 2011), including
bore depth, drilling operation time, and drilling equipment
manufacturers’ data. The tube well depths and drilling times
summarized in Table I were used for both South Australia
and Musi for all drilling calculations.
Quantifying the energy consumption and GHG emissions
associated with drilling required an understanding of the key
steps involved in the entire supply chain, beginning with
groundwater exploration. Exploration is necessary to pro-
vide indirect evidence of the sub-surface formations that
indicate whether the formations may possibly be aquifers
(Michael, 2008). Data were readily available on the electri-
cal resistivity method of groundwater exploration, which is
a common method used in both Australia and India, there-
fore it was assumed for this study. Embodied GHG emission
ENERGY AND GHG EMISSION ACCOUNTING
Copyright © 2015 John Wiley & Sons, Ltd. Irrig. and Drain. (2015)
- 4. and GHG emissions for transporting the exploration
equipment was considered. The most common methods
used to drill the tube wells in Australia and India are
either mud rotary drilling or compressed air rotary drilling
techniques (Noonan, 2011). It is common practice to
power equipment in both methods using diesel engines
(Noonan, 2011; Michael, 2008). Additionally, both
drilling methods are relatively similar in their operation
and are energy-intensive.
Water distribution channels. A typical groundwater-
irrigated farm discharges the pumped groundwater from
the pipe to an open channel distribution system from where
it will be applied to the crops. Energy consumption and
GHG emissions associated with channel construction in-
volve operational components of heavy excavation equip-
ment and their embodied energy. Additionally, the
production and placement of the lining material require en-
ergy (Michael, 2008).
Figure 1. Extended conceptual framework of components contributing GHG emissions in groundwater-based irrigation systems
S. ACHARYA ET AL.
Copyright © 2015 John Wiley & Sons, Ltd. Irrig. and Drain. (2015)
- 5. It was found that due to the low pumping rates of the tube
wells in the Musi catchment, channels are not used for con-
veyance. Therefore, only the energy consumption and GHG
emissions for groundwater-irrigated farms in the SE of
South Australia were included in the calculation. The calcu-
lated cross-sectional area and estimated length for a channel
in the SE of South Australia are summarized in Table I.
Energy consumption and GHG emission calculations were
completed for unlined channels and channels lined with
the commonly used materials of concrete and plastic
(Michael, 2008).
Irrigation methods. A comparison of energy consump-
tion and GHG emissions was conducted for three irrigation
methods—flood, drip and centre pivot irrigation systems—
to apply water on to the cropland. Flood and drip irrigation
systems are commonly used in both Australia and India;
however, centre pivot irrigation is not commonly used in
India and therefore it was only included in the calculation
for the SE of South Australia.
The irrigation areas for both regions were calculated
based on the crop water requirement (George et al., 2004,
2002) and the groundwater quantity supplied from the wells.
Since this study is only concerned with the energy consump-
tion and GHG emissions associated with different irrigation
methods, only one crop type was used for each study area.
All the necessary design data were extracted from several
sources, which are summarized in Acharya (2011):
• flood irrigation system. Flood irrigation is a method
that applies water directly to the soil surface from a
channel located in the upper reach of the field
(Michael, 2008). For the purpose of this study, only mi-
nor land levelling (no removal of hills) and excavation
of the channel in the upper reach of the field, were
assumed for field preparation for flood irrigation in
both countries;
• drip irrigation system. Typical drip irrigation systems
for both regions in this study were assumed to consist
of a centrifugal pump (driven by a diesel engine) and
a trolley, a main pipe, sub-main pipes, lateral pipes,
inline drip tubes, which discharge the water, and sole-
noid valves (Seby, 2011). The main is assumed to lie
within an excavated channel at a depth of 0.30 m.
Energy consumed in the channel excavation process
is also included in the calculation (Michael, 2008).
For this study, drip irrigation system component sizes
were designed for both study regions based on the calcu-
lated cropping areas, assumed crop type, and associated crop
water requirements. The design details provided by Seby
(2011) were used to estimate the energy consumption and
GHG emissions for all system components. The pipe
material was assumed to be polyvinyl chloride (PVC);
• centre pivot irrigation system. Centre pivot irrigation is
not commonly used in India. Therefore, quantification of
energy consumption and GHG emissions for this
irrigation method was completed only for Australia.
Overall, centre pivot systems require minimal mainte-
nance and once erected in the field, no major labour is re-
quired during operation. The major components
associated with the design of the centre pivot system
are a diesel pump, a main pipe, lateral pipes, and the
Table I. Key hydraulic data
Data type Parameter Unit
Value
Australia India
Hydrological
data
Well/bore flow rate L sÀ1
65.3 2.89
Pumping hours per irrigation year
for lifting water from the tube well
h 144 369
Crop type Lucerne seed
(Source: Jackson et al., 2010)
Fruit crop
(Source: Davidson et al., 2009)
Net irrigation requirement ML haÀ1
10.27 (Source: Jackson
et al., 2010)
3.65
(Source: Davidson et al., 2009)
Area irrigated ha 3.5 1.5
Well properties Average bore depth m 50.0 (Noonan, 2011) 35.4 (Ganapuram et al., 2009)
Drill time h mÀ1
0.3 (Noonan, 2011) 0.3 (Noonan, 2011)
Channel
properties
Length m 300
Width m 0.5 (calculated; Michael, 2008)
Depth m 0.25 (calculated; Michael, 2008)
Lining width m 0.05 (Michael, 2008)
Irrigation
pumping
Annual pump running time
for drip system
h 1,095 (estimated) 1058 (calculated based on
NCPAH data, 2011)
ENERGY AND GHG EMISSION ACCOUNTING
Copyright © 2015 John Wiley & Sons, Ltd. Irrig. and Drain. (2015)
- 6. nozzles from where water is discharged and applied to
the crop. Based on the irrigated area for the SE of South
Australia, a centre pivot system was designed and all its
design components selected (Acharya, 2011; New and
Fipps, 2001).
Additional assumptions and estimates
The previous sections contain several assumptions that were
made to estimate the embodied energy and GHG emissions
as well as the operational energy and related GHG emis-
sions. It should be noted that the embodied GHG emissions
encompass equipment use, manufacture and transport to
site, while the embodied energy considers only transport of
the materials to site. Details of equipment transportation dis-
tances by truck from manufacturing site to irrigation site for
the SE of South Australia and Musi are shown in Table II.
The operational GHG emissions and energy encompass the
power requirements to operate all the equipment necessary
for the system. The energy use rates and GHG emission fac-
tors of various components are presented in Tables III and
IV. Recurring and decommissioning energy and GHG emis-
sions, which are negligible in general, were not considered
in this study.
RESULTS
Modelled GHG emissions and energy consumption for
tube well drilling
Life cycle energy consumption for well/bore drilling.
Table V shows the life cycle energy consumption estimates
per ML of water produced from the tube well drilling for
the one-pump farms in Musi and the SE of South Australia.
Musi has significantly higher energy consumption per ML in
comparison to South Australia due to low discharge from the
wells in Musi.
The compressed air rotary drilling consumes slightly
higher amounts of energy in both countries during operation
due to slightly higher fuel consumption over mud rotary
drilling. The relative energy used by the drilling methods
differs by approximately 8% in India and approximately
25% in Australia. The results also show that the embodied
energy associated with each drilling method was signifi-
cantly less in comparison to the operational energy required
for drilling the bore well in both study areas (less than 3% in
India and less than 20% in Australia).
Life cycle greenhouse gas emissions for bore well
drilling. Table V also shows the life cycle GHG emission
estimates per ML of water pumped from the tube well dril-
ling for the one-pump farms in Musi and the SE of South
Australia using the conceptual framework developed in this
study. The trend for GHG emissions is similar to that of the
energy consumption rates. Musi had significantly higher per
unit GHG emissions for the drilling method used in compar-
ison to the SE of South Australia due to the lower tube well
water production.
In both study areas, the compressed air rotary drilling
method had slightly higher GHG emission estimates over
mud rotary drilling. As per the results for life cycle energy
consumption of the drilling methods, the embodied GHG
emissions associated with each drilling method were lower
in comparison to the operational energy for both study areas
(Table V).
Modelled GHG emissions and energy consumption for
channel water distribution
Life cycle energy consumption for channel water
distribution. Table V summarizes the energy consump-
tion estimates per ML of water produced for channel water
conveyance for the one-pump farm in the SE of South
Australia. As expected, the life cycle energy consumption
for unlined channels is lower than for lined channels, with
the majority of energy consumption occurring during chan-
nel establishment (excavation) using heavy machinery.
Using either plastic or concrete material as lining material
requires similar operational energy since the same amount
of time is expected for channel excavation and lining
placement in the channel. There is very minimal embodied
energy associated with the manufacture, transportation and
placement of the lining material for the lined channels, and
the embodied energy is almost insignificant in comparison
to the operational energy (22% for concrete lining and 5%
Table II. Equipment transportation distances by truck from
manufacturing site to irrigation site for the SE of South Australia
and the Musi catchment
Equipment item
Distance
travelled to the
SE of South
Australia (km)
Distance
travelled to
Musi (km)
Well/bore drilling
Exploration machinery 300 30
Drilling rig 2500 50
Mud pump/air compressor 300 30
Well tube casing/drill bit/concrete 300 30
Water distribution through channels
Excavation equipment 300 –
Lining materials (i.e. plastic, concrete) 300 –
Irrigation methods
Excavation equipment 300 30
Drip irrigation equipment 500 30
Centre pivot irrigation equipment 500 –
Pumps, engine, trolley 500 1000
S. ACHARYA ET AL.
Copyright © 2015 John Wiley & Sons, Ltd. Irrig. and Drain. (2015)
- 7. Table III. Energy use rates of relevant pieces of equipment
Equipment item Quantity Unit Descriptions Source
Level 1— Well/bore development
Electrical resistivity exploration
equipment
7.2 kW Power required to run exploration
equipment
Omega resistivity
Lightweight drill rig 25 L hÀ1
Drill rig for Indian operations,
diesel fuel consumption
Noonan (2011)
Heavyweight drill rig 40 L hÀ1
Drill rig for Australian operations,
diesel fuel consumption
Noonan (2011)
Mud pump 22.4 L hÀ1
Diesel fuel consumption Gardner Denver
Excavator 25 L hÀ1
Diesel fuel consumption Noonan (2011)
Excavator 10 h haÀ1
Operating time per unit area
Air compressor 0.332 L kWhÀ1
Diesel fuel consumption
Level 2— Water distribution through channels
Excavator 59 kW Engine rated power Vermeer
Level 3— Irrigation methods
Excavator 59 kW Engine rated power Vermeer
Centrifugal pump for irrigation systems 0.240 L kWhÀ1
Australian and Indian operation,
diesel fuel consumption
BBA self-priming
Table IV. Emission factor estimates used for the SE of South Australia and the Musi catchment
Relevant factor Estimated value used
Transport fuel—fuel combustion energy content
(automotive diesel oil)
38.6 GJ kLÀ1
(Source: Table 4, DCCEE, 2011)
Transport fuel— full fuel cycle emissions factor
(automotive diesel oil)
2.698 kg CO2-e LÀ1
(Source: Calculated using DCCEE, 2011)
Emissions factor for electricity per kWh delivered 0.81 kg CO2-e kWhÀ1
(Source: Table 39, DCCEE, 2011)
Embodied emission factor for steel 3062.4 kg CO2-e tÀ1
(Source: Calculated using 0.088 kg CO2-e MJÀ1
content and energy intensity values from Aye et al., 2012)
Embodied emission factor for concrete (30 MPa) 201 kg CO2-e tÀ1
(Source: Calculated using 0.088 kg CO2-e MJÀ1
content and energy intensity values from Aye et al., 2012)
Embodied emission factor for plastic 2700 kg CO2-e tÀ1
(Hammond and Jones, 2008)
Embodied emission factor for PVC pipe 2500 kg CO2-e tÀ1
(Hammond and Jones, 2008)
Table V. Results of emissions and energy analysis of different well drilling and lining methods
Energy consumption GHG emissions
Total Operational Embodied Total Operational Embodied
Region Method used MJ MLÀ1
MJ MLÀ1
% MJ/ML % kg CO2-e MLÀ1
kg CO2-e MLÀ1
% kg CO2-e MLÀ1
%
India Mud rotary 101.4 98.5 97.2 2.8 2.8 11.0 7.0 63.7 4.0 36.3
India Compressed air 110.2 107.3 97.4 2.8 2.6 11.5 7.6 73.7 3.9 26.3
South Australia Mud rotary 25.5 20.9 81.9 4.6 18.1 2.8 1.5 53.5 1.3 46.5
South Australia Compressed air 32.1 27.4 85.6 4.6 14.4 3.1 1.9 62.9 1.1 37.1
South Australia Unlined 7.8 7.6 97.6 0.2 2.4 0.6 0.5 94.6 0.02 5.4
South Australia Lined—concrete 9.7 9.3 95.8 0.4 4.2 0.9 0.7 78.0 0.2 22.0
South Australia Lined—plastic 9.7 9.3 95.8 0.4 4.2 0.7 0.65 93.0 0.05 7.0
ENERGY AND GHG EMISSION ACCOUNTING
Copyright © 2015 John Wiley & Sons, Ltd. Irrig. and Drain. (2015)
- 8. for plastic lining). From the perspective of the life cycle
energy results obtained, the unlined channel seems to be
most desirable; however, it is not a practical solution due
to water losses (i.e. high seepage) incurred without a lining
material.
Life cycle greenhouse gas emissions for channel wa-
ter distribution. Table V also shows the GHG emission
rates per ML of water produced for channel water convey-
ance for the one-pump farm in the SE of South Australia.
As expected, the unlined channel emits the least amount of
GHG emissions. Using either plastic or concrete material
as lining material has the same operational GHG emissions
for the same reason mentioned in the previous section.
However, the embodied GHG emissions associated with
manufacturing the concrete material are approximately
50% lower than the plastic lining due to a lower embodied
emissions factor.
Modelled GHG emissions and energy consumption for
irrigation methods
Life cycle energy consumption for irrigation
methods. Table VI summarizes the energy consumption
rates per ML of water delivered for the most commonly used
irrigation methods in Musi and the SE of South Australia.
The GHG emissions and energy results are higher in Musi,
India, due to the lower water production rate from the bores
in comparison to that produced by the bores in Australia.
For both regions, the flood irrigation system was estimated
to be less energy consuming in comparison to the drip irriga-
tion system. In the SE of South Australia, the highest energy
consumption was estimated in using the centre pivot irrigation
system since it utilized a pump to distribute water through the
lines with a higher pumping head requirement than that used
for the drip system. There are more components required for
setting up a centre pivot system, which increases the transport
energy in comparison to the drip system.
Life cycle greenhouse gas emissions for irrigation
methods. The flood irrigation method was estimated to
have fewer GHG emissions in comparison to the drip system
in the Musi and drip and centre pivot in the SE of South
Australia. The GHG emissions associated with the drip irri-
gation method were five and nine times higher than those
emitted by the flood irrigation method in Musi and the SE
of South Australia respectively.
The embodied GHG emissions associated with the drip irri-
gation system contribute quite significantly to the overall
GHG emissions of the system (Table VII) due to the high
quantity of PVC pipe and concrete material required in the
construction of the system (embodied GHG emissions of ap-
proximately 23% in India and 25% in Australia). The centre
pivot irrigation system, estimated for only the SE of South
Australia, also has high embodied equipment GHG emissions
(Table VI) (approximately 8% of the overall GHG emissions).
Life cycle greenhouse gas emissions from the whole
life cycle of different components
Table VIII shows the total GHG emissions for the whole
life cycle of the groundwater supplied by the various sce-
nario combinations for the two regions. The following
drilling, pumping and irrigation methods were considered:
• two tube well drilling methods: mud rotary and air
compressor rotary;
• three groundwater pumping methods: electricity, diesel
engine and diesel generator (Tyson et al., 2012) drives;
• three irrigation methods: flood, drip and centre pivot.
The scenario combining mud rotary drilling, a diesel en-
gine as the pumping power source and flood irrigation
Table VI. Results of emissions and energy analysis of different irrigation methods
Energy consumption GHG emissions
Total Operational Embodied Total Operational Embodied
Region Method used MJ MLÀ1
MJ/MLÀ1
% MJ MLÀ1
% kg CO2-e MLÀ1
kg CO2-e MLÀ1
% kg CO2-e MLÀ1
%
India Flood 210 209 99.7 0.7 0.3 14.7 14.6 99.2 0.1 0.8
India Drip 804 789 98.1 14.9 1.9 71.4 55.2 77.3 16.2 22.7
South
Australia
Flood 56 55 99.1 0.5 0.9 3.9 3.9 98.7 0.1 1.3
South
Australia
Drip 417 404 96.9 13.0 3.1 37.4 28.3 75.6 9.1 24.4
South
Australia
Centre pivot 1218 1200 98.5 17.9 1.5 92.5 85.2 92.1 7.3 7.9
S. ACHARYA ET AL.
Copyright © 2015 John Wiley & Sons, Ltd. Irrig. and Drain. (2015)
- 9. distribution for Australia provides the lowest life cycle GHG
emissions per ML of water supplied at the farm (118 kg
CO2-e MLÀ1
). The scenario combining air compressor ro-
tary drilling, a diesel generator as the pumping power source
and centre pivot irrigation has the most emissions and is
estimated as 271 kg CO2-e MLÀ1
. For India, the scenario
that combines mud rotary drilling, a diesel engine and flood
irrigation has the least (80 kg CO2-e MLÀ1
) and air compres-
sor rotary drilling, a diesel generator and drip irrigation sys-
tem has the most (167 kg CO2-e MLÀ1
). It should be noted
Table VII. Relative contributed embodied emissions for irrigation methods
GHG emissions(kg CO2-e MLÀ1
) GHG emissions%
Region Method used Total Manufacturingand materials Transport Manufacturingand materials Transport
India Flood 0.12 0.07 0.05 58.0 42.0
India Drip 16.2 14.2 2.0 87.7 12.3
South Australia Flood 0.05 0.02 0.03 40.0 60.0
South Australia Drip 9.1 7.7 1.4 84.3 15.6
South Australia Centre pivot 7.3 6.1 1.2 82.9 17.1
Table VIII. GHG emissions from different elements of groundwater pumping and application
Region
Drilling type Pumping type Water application type
Total GHG emission
kg CO2-e MLÀ1
Mud rotary Compressed air Electricity Diesel Generator Flood Drip Centre pivot
South Australia 2.8 3.1 122.2 111.2 175.5 4 37.5 92.5
√ √ √ 129
√ √ √ 163
√ √ √ 218
√ √ √ 118
√ √ √ 152
√ √ √ 207
√ √ √ 182
√ √ √ 216
√ √ √ 271
√ √ √ 129
√ √ √ 163
√ √ √ 218
√ √ √ 118
√ √ √ 152
√ √ √ 207
√ √ √ 183
√ √ √ 216
√ √ √ 271
Musi 11.0 11.5 69.3 54 84 14.8 71.4
√ √ √ 95
√ √ √ 152
√ √ √ 80
√ √ √ 136
√ √ √ 110
√ √ √ 166
√ √ √ 96
√ √ √ 152
√ √ √ 80
√ √ √ 137
√ √ √ 110
√ √ √ 167
ENERGY AND GHG EMISSION ACCOUNTING
Copyright © 2015 John Wiley & Sons, Ltd. Irrig. and Drain. (2015)
- 10. that, as mentioned previously, these figures are based on per
ML water supplied to the cropland, not the ML of produc-
tive water uptake by the plants.
Supply chain embodied emissions
Table VII shows the relative contributing embodied GHG
emissions for the irrigation methods compared to the total
GHG emissions from equipment transport to site and the
manufacture of equipment/materials.
The estimates show that the majority of the embodied
GHG emissions for drip and centre pivot systems are in
the manufacture of the equipment/materials for both study
regions (>80% of embodied emissions). Both drip irrigation
and centre pivot designs incorporate pumps, pipe, and other
additional items for operation. The majority of the embodied
GHG emissions for the flood irrigation system lie in trans-
port of the equipment/materials to the site because this irri-
gation method does not require much equipment for
operation. A flood irrigation system has far fewer embodied
GHG emissions in comparison to the other two irrigation
methods. This analysis shows the significant impact that
the types of equipment/materials used have on the embodied
GHG emissions for the different irrigation systems.
DISCUSSION
Energy use and GHG emissions
From this study we can conclude that all component levels
of the conceptual framework have an impact on the total
GHG emissions and energy consumption for both countries.
Any change in the most commonly used methods for bore
drilling, channel water distribution and irrigation methods
will have an impact on GHG emissions and energy con-
sumption rates. The embodied GHG emissions for all the
categories are the least contributor to total GHG emissions,
in both regions. Within the embodied emissions,
equipment/material manufacture is the largest contributor
in comparison to the transport GHG emission estimates
from manufacturing site to bore site.
The GHG emission and energy consumption rates were
substantially lower for flood irrigation systems in compari-
son to drip and centre pivot. Items that would normally have
major impacts on flood irrigation methods are terrain and
soil properties, which would affect the time and energy re-
quired to prepare the land using heavy equipment. In spite
of the time- and energy-consuming task of field preparation,
the flood irrigation method has been shown to have lower
life cycle energy consumption and GHG emissions than
other irrigation methods considered, since minimal energy
is required to operate the system (Lukose, 2005; Amaya,
2000; Jacobs, 2006).
The drip irrigation method has significantly higher emis-
sions associated with it in both study regions in comparison
to flood irrigation due to the power required to operate the
system. Due to high operational energy consumption, the
centre pivot system has high GHG emissions compared
to the drip system (SE of South Australia). Of the three,
the centre pivot system has the highest embodied GHG
emissions due to the high use of steel pipes, wheel motors,
and other additional equipment required to operate the
system.
It should be highlighted that for all component levels con-
sidered in this study, the difference in irrigation water vol-
umes between the two study areas is likely to be a
significant reason for the large discrepancy in emissions
and energy use for both regions.
Future model applicability
Estimates and assumptions were used where indicated and
when data were not available. Country-specific estimates
of quantities were used where possible, and this should be
incorporated for aspects like fuel consumption and equip-
ment transport distances to obtain better estimates. GHG
emission factors for diesel fuel combustion for South Aus-
tralia were applied to the Indian region. For future model-
ling, temporal and region-specific Indian emission factors
may be used, if available.
All contributions from manufacturing embodied GHG
emissions for equipment are related largely to the GHG
emission factor of equipment materials, the mass and size of
the equipment, and the transportation distance. It should be
noted that the majority of the equipment used in the estima-
tions was not region specific; therefore any variation in power
use specifications could have an impact on the total calculated
emissions and energy consumption. As per Tyson et al.
(2012), it would be best to use survey data on local equip-
ment and specifications in modelling GHG emissions in the
future.
CONCLUSIONS
This study estimated energy use and GHG emissions asso-
ciated with different components in the supply chain of
groundwater-based irrigation systems. The results of this
study highlight that different components of the system
have an impact on total GHG emissions and energy con-
sumption for both countries. The key findings of this re-
search indicate that:
• there is no significant variance between the mud rotary
and compressed air rotary drilling methods in both
countries; there are slightly lower life cycle GHG emis-
sions and less life cycle energy required applying the
S. ACHARYA ET AL.
Copyright © 2015 John Wiley & Sons, Ltd. Irrig. and Drain. (2015)
- 11. mud rotary drilling technique, making that technique
more desirable than the compressed air drilling tech-
nique from an environmental perspective;
• unlined channels contribute the least energy and GHG
emissions in comparison to lined channels, but the
practicality of using an unlined channel for farming is
limited due to the high seepage losses that are incurred
during conveyance;
• at low water flow rates, like that identified in this study,
lining material is a necessary component to allow for
adequate conveyance by minimizing water losses in
the channel. When comparing lining materials, con-
crete has slightly lower embodied GHG emissions,
making it a more desirable lining material over its alter-
native, plastic;
• for irrigation application methods, the drip irrigation
system contributes more life cycle energy and GHG
emissions in both study regions than gravity systems.
In Australia, the centre pivot irrigation system has more
GHG emissions than the drip irrigation system due
mostly to a high operational pump head requirement.
The developed conceptual framework and model provide
a systematic complete analysis of the energy-consuming and
GHG-emitting components associated with groundwater-
based irrigation systems.
ACKNOWLEDGEMENTS
The authors gratefully acknowledge the financial support
from the Australia-India Institute for carrying out this re-
search project.
REFERENCES
Acharya S. 2011. Development of an Energy-GHG Accounting Framework
for Groundwater-based Irrigation Systems. Department of Infrastructure
Engineering, the University of Melbourne, Parkville.
Amaya CA. 2000. Life Cycle Energy Analysis of Irrigation Systems. The
Department of Civil and Environmental Engineering, the University of
Melbourne, Parkville.
Aye L, Mirza MA, Robinson JRW. 2007. Life cycle greenhouse gas emis-
sion of building and construction: an indicator for sustainability. In Pro-
ceedings of the MDCMS 1—Vietnam First International Conference on
Modern Design, Construction and Maintenance of Structures, Hanoi,
10–11 December; S1–S6.
Aye L, Ngo T, Crawford RH, Gammampila R, Mendis P. 2012. Life cycle
greenhouse gas emissions and energy analysis of prefabricated reusable
building modules. Energy and Buildings 47: 59–68.
Chen G, Orphant S, Kenman SJ, Chataway, RG. 2005. Life cycle assess-
ment of a representative farm with limited irrigation pastures. In 4th Aus-
tralian Conference on Life Cycle Assessment Proceedings, Sydney,
Australia, 23–25 February.
Davidson B, Hellegers P, Samad M. 2009. Assessing the economic impact
of redistributing water within a catchment: a case study of the Musi
catchment in the Krishna Basin in India. International Water Manage-
ment Institute (IWMI) Working Paper 134, Colombo, Sri Lanka.
Department of Climate Change and Energy Efficiency (DCCEE). 2011. Na-
tional Greenhouse Accounts (NGA) Factors. Commonwealth of Australia.
http://www.climatechange.gov.au/~/media/publications/greenhouse-
acctg/nga-factors-july-2011.pdf (assessed September 2011).
Ganapuram S, Kumar GTV, Krishna IVM, Kahya E, Demirel MC. 2009.
Mapping of groundwater potential zones in the Musi basin using remote
sensing data and GIS. Advances in Engineering Software 40(7):
506–518.
George BA, Reddy BRS, Raghuwanshi NS, Wallender WW. 2002. Deci-
sion support system for estimating reference evapotranspiration. Journal
of Irrigation and Drainage Engineering Div. ASCE 128(1): 1–10.
George BA, Malano HM, Tri VK, Turral H. 2004. Using modelling to im-
prove operational performance in the Cu Chi irrigation system, Vietnam.
Irrigation and Drainage 53(3): 237–249.
George BA, Malano HM, Davidson B, Hellegers P, Bharathi L, Sylvian M.
2011a. An integrated hydro-economic modelling framework to evaluate
water allocation strategies I: Model development. Agricultural Water
Management 98(5): 733–746.
George BA, Malano HM, Davidson B, Hellegers P, Bharathi L, Sylvian M.
2011b. An integrated hydro-economic modelling framework to evaluate
water allocation strategies II: Scenario assessment. Agricultural Water
Management 98(5): 747–758.
Hammond G. Jones C. 2008. Inventory of Carbon and Energy (ICE) Ver-
sion 1.6a. University of Bath, UK.
Jackson TM, Khan S, Hafeez M. 2010. A comparative analysis of water ap-
plication and energy consumption at the irrigated field level. Agricultural
Water Management 97: 1477–1485.
Jacobs S. 2006. Comparison of Life Cycle Energy Consumption of Alterna-
tive Irrigation Systems. Faculty of Engineering and Surveying, the Uni-
versity of Southern Queensland.
Lukose MJ. 2005. Life Cycle Energy Analysis of Irrigation Systems. De-
partment of Civil and Environmental Engineering, the University of Mel-
bourne, Parkville.
Massuel S, George BA, Venot JP, Bharati L, Acharya S. 2013. Improving
assessment of groundwater-resource sustainability with deterministic
modelling: a case study of the semi-arid Musi sub-basin, South India.
Hydrogeology Journal 21(7): 1567–1580.
Michael AM. 2008. Irrigation—Theory and Practice, 2nd edn. Vikas Pub-
lishing House PVT Ltd: Jangpura, New Delhi.
New L, Fipps G. 2001. Texas Agricultural Extension Service—Centre
Pivot Irrigation. Brochure of the Texas A&M University System. http://
texaserc.tamu.edu (accessed on 19 August 2011).
Noonan G. 2011. Personal communication, 5 July 2011. Senior engineer,
Geotechnical Engineering, Port Melbourne, Victoria, 3207.
Nune R, George BA, Teluguntla P, Western AW. 2014. Relating trends in
streamflow to anthropogenic influences: A case study of Himayat Sagar
catchment, India. Water Resources Management 28(6): 1579–1595.
Seby KJ. 2011. Design details for drip irrigation system. Personal commu-
nication, 13 September 2011. Irrigation engineer, Ascon LLC, Dubai,
UAE.
Shah T, Roy AD, Qureshi AS, Wang J. 2003. Sustaining Asia’s groundwa-
ter boom: an overview of issues and evidence. Natural Resources Forum
27: 103–141.
Shah T, Scott C, Kishore A, Sharma A. 2004. Energy-irrigation nexus in
South Asia: Improving groundwater conservation and power sector
viability. Second (Revised) Edition. Research Report 70. Colombo,
Sri Lanka: International Water Management Institute.
Tyson A, George B, Aye L, Nawarathna B, Malano H. 2012. Energy and
greenhouse gas emission accounting framework for groundwater use in
agriculture. Irrigation and Drainage 61(4): 542–554.
ENERGY AND GHG EMISSION ACCOUNTING
Copyright © 2015 John Wiley & Sons, Ltd. Irrig. and Drain. (2015)