SlideShare a Scribd company logo
1 of 10
Department 103
                 Fall “Active Wear” Product


                      Total $ Sales LW    $52,817

                      Total Units Sales
                                           1,067
                             LW

                     Current On Hand      10,810

                     Overall Unit ST %
                                            9%
                            LW

                        Future WOS         10.1


                      On Order Units       4.040


Buyer: Jacqueline Geserick                Planner: Shakeema Hampton
Style Overview


                                         Sell-
                      Sales    OH                        On
            Sales $                    Through   WOS
                      Units   Units                     Order
                                          %
 Velour
  Basic     $32,027    647    6,470     9.1%     10.0   1520
 Hoodie
 Velour
Mock Neck   $14,801    299    3,692     7.5%     12.3   1800
 Jacket
 Velour
 Graphic    $5,990     121     648      15.7%    5.4     720
 Hoodie
            $52,81
  ALL                 1,067   10,810    9.0%     10.1   4040
              7
Buyer Analysis on Styles

 Best Performers                $35,000
    Volume Drivers:             $30,000                           Sales $
        Velour Basic Hoodie                                       Average
                                 $25,000
              9.1% ST LW
                                 $20,000
    Customer’s Top Pick:        $15,000   $32,027
        Velour Graphic Hoodie                          $14,801
 o         15.7% ST LW           $10,000

                                  $5,000      $17,606        $17,606      $17,606
                                                                       $5,990
 Under Performing                   $0
    Style: Mock Neck Jacket               Velour Basic Velour Mock     Velour
                                             Hoodie     Neck Jacket     Graphic
         7.5%ST LW

 
Last Week
 Buyer Results               Color Sell-Through
   by color        16.0%
                   14.0%
•Top 3 Colors
                   12.0%
  -Truffle
  -Red             10.0%
  -Aquarium
                   8.0%
                                                              14.5%
Bottom 3 Colors    6.0% 10.9%                            12.3%
  - Navy           4.0%       7.8% 8.5% 7.6% 7.3%
   - Lingonberry                                  5.6%
                   2.0%
  - Grape Rizz
                   0.0%
Planner Department Overview

               LAST WEEK RESULTS
                        on
               “Velour Basic Hoodie”

             Total Units Sales
                                  647
                    LW

             Current On Hand     6,470

             Overall Unit ST %
                                 24.2%
                    LW

               Future WOS         10.0


              On Order Units      1520
Breakdown
     of                            LW Regions (WOS)
       Region             14.0
                          12.0
     Lowest
                OH pen.   10.0
Region 5 7.9     .3%      8.0
Region 1 8.6     .2%
                          6.0                      12.3         11.3
                                       10.0 10.4                       10.0
                          4.0    8.4                      7.9
    Highest
                OH pen.    2.0
Region 4 12.3    .2%
Region 3 10.4    .1%      0.0
Region 6 11.3    .3%
Breakdown of LW Regions

           Best Performing Regions                                        Underperforming Regions

                                                                                          Sales
                                 OH                             Store Name       Region           OH Units ST %   WOS GRADE
Store Name Region Sales Units           ST %    WOS    GRADE                              Units
                                Units
                                                                Chicago (4)        3       19       254    7.0%   13.4   D
Columbus
              1       51        320     13.7%   6.3      A     Chicago (23)        3       24       241    9.1%   10.0   D
   (1)
                                                               Oakbrook (11)       3       28       241   10.4%   8.6    C
Cleveland
              1       15        120     11.1%   8.0     C                                  71       736   8.8%    10.4
   (21)
                                                               Houston (16)        4       23       306    7.0%   13.3   D
Akron (19)    1       17        260     6.1%    15.3     E       Dallas (25)       4       20       244    7.6%   12.2   D
                                                                Ft Worth (5)       4       29       338    7.9%   11.7   D
                      83        700     10.6%   8.4
                                                                                           72       888   7.5%    12.3
Malibu (7)    5       41        304     11.9%   7.4      B      Orlando (14)       6       21       291    6.7%   13.9   D
                                                               Richmond (24)       6       20       258    7.2%   12.9   D
Thousand                                                       Greenville (22)     6       21       255    7.6%   12.1   D
              5       38        303     11.1%   8.0     C
Oaks (12)
                                                                Atlanta (10)       6       35       367    8.7%   10.5   D
                                                                Daytona (8)        6       25       236    9.6%   9.4    C
  LA (3)      5       28        235     10.6%   8.4     C
                                                                Atlanta (18)       6       13       119    9.8%   9.2    C
                      107       842     11.3%   7.9                                       135      1526   8.1%    11.3
Regions By Location

   Best Performing Locations                                Underperforming Locations


    • Most Units Sales LW                                        • Fewest Units Sales LW
    • Least OH Units                                             • Most OH Units
    • Least WOS                                                  • Most WOS


  Store               Sales                             Store              Sales
             Region           OH Units   WOS   GRADES             Region           OH Units   WOS    GRADES
  Name                Units                             Name               Units


                                                        Newark
Malibu (7)     5       41       304      7.4     B                  2       7        135      19.3     F
                                                          (6)


                                                        Akron
NYC (17)       2       49       338      6.9     B                  1       17       260      15.3     E
                                                         (19)


Columbus                                                Boston
               1       51       320      6.3     A                  2       17       239      14.1     E
   (1)                                                    (9)
Buyer Memo to All FMM INC. Stores

Issue:
 Velour Basic Hoodie and Velour Graphic Hoodie are driving the business in active
  tops however the Velour Mock Neck Jacket need some help selling on the floor.
 If the Velour Mock Neck Jacket keeps selling the way it is, then we will need to
  mark it down.

Goal:
   Corporate has decided that with a pricing strategy and remerchandising the floor
    in active tops it will improve our profits and eliminate markdowns

Steps to Successful Execution
 Determine traffic flow and #1 location
 Merchandising the Floor:
       2-Tier Table:
       4-way rack
      Signage
      Customer Service

Time Frame:
   Floor change: November 11,2011- November 25, 2011
Planner Memo to All FMM INC. Stores

Issue:
   Underperforming regions ( 3, 4, and 6) are not pushing products off the floor as
    fast as other regions. Also, region 2 and 7 can potentially become an
    underperforming region.

Goal:
   Corporate expects the following regions 3, 4, 6, 2 and 7 to increase its sell through
    percent to at least a 10% or above.

Steps to Solution:
   Department Meeting (Managers and Sales Associates)
   Stress the SELL sequence
   Pricing and remerchandising strategies must go into effect according to corporate
    standards.

Rewards
   Regions that reach a 10% or above sell through will receive a shirt voucher.

More Related Content

Similar to Women Knit Department

Page 1 Front Page Page 2 Stocks & Bonds Page 3 Financial.docx
Page 1 Front Page Page 2 Stocks & Bonds Page 3 Financial.docxPage 1 Front Page Page 2 Stocks & Bonds Page 3 Financial.docx
Page 1 Front Page Page 2 Stocks & Bonds Page 3 Financial.docxbunyansaturnina
 
2222020 Report Pagehttpsww3.capsim.comcgi-bindispla.docx
2222020 Report Pagehttpsww3.capsim.comcgi-bindispla.docx2222020 Report Pagehttpsww3.capsim.comcgi-bindispla.docx
2222020 Report Pagehttpsww3.capsim.comcgi-bindispla.docxRAJU852744
 
2222020 Report Pagehttpsww3.capsim.comcgi-bindispla.docx
2222020 Report Pagehttpsww3.capsim.comcgi-bindispla.docx2222020 Report Pagehttpsww3.capsim.comcgi-bindispla.docx
2222020 Report Pagehttpsww3.capsim.comcgi-bindispla.docxlorainedeserre
 
Chicagoland Quarterly Supply/Demand Report - 7/1/2011
Chicagoland Quarterly Supply/Demand Report - 7/1/2011Chicagoland Quarterly Supply/Demand Report - 7/1/2011
Chicagoland Quarterly Supply/Demand Report - 7/1/2011chipwags
 
Gta office market statistics q3 2011
Gta office market statistics q3 2011Gta office market statistics q3 2011
Gta office market statistics q3 2011Chris Fyvie
 
Chicago Real Estate Market Data - Broken Down by City
Chicago Real Estate Market Data - Broken Down by CityChicago Real Estate Market Data - Broken Down by City
Chicago Real Estate Market Data - Broken Down by Citybethrepta
 
H W 2010 Q1 De 12 Mo
H W 2010 Q1 De 12 MoH W 2010 Q1 De 12 Mo
H W 2010 Q1 De 12 Mochipwags
 
Banco ABC - 1st Quarter 2008 Results Presentation
Banco ABC - 1st Quarter 2008 Results PresentationBanco ABC - 1st Quarter 2008 Results Presentation
Banco ABC - 1st Quarter 2008 Results PresentationBanco ABC Brasil
 
Brunswick (BC) Pitch - Jonathan Chang - FINAL COPY
Brunswick (BC) Pitch - Jonathan Chang - FINAL COPYBrunswick (BC) Pitch - Jonathan Chang - FINAL COPY
Brunswick (BC) Pitch - Jonathan Chang - FINAL COPYJonathan Chang
 
Wag Report 2009 Q4 De 12 Mo
Wag Report 2009 Q4 De 12 MoWag Report 2009 Q4 De 12 Mo
Wag Report 2009 Q4 De 12 Mochipwags
 
Page 1 Front PagePage 2 Stocks & BondsPage 3 Financial Sum.docx
Page 1 Front PagePage 2 Stocks & BondsPage 3 Financial Sum.docxPage 1 Front PagePage 2 Stocks & BondsPage 3 Financial Sum.docx
Page 1 Front PagePage 2 Stocks & BondsPage 3 Financial Sum.docxgerardkortney
 
TAG infrastructure society logistics presentation by Page Siplon
TAG infrastructure society logistics presentation by Page SiplonTAG infrastructure society logistics presentation by Page Siplon
TAG infrastructure society logistics presentation by Page SiplonMelanie Brandt
 
Gta office market statistics 2011 q2
Gta office market statistics 2011 q2Gta office market statistics 2011 q2
Gta office market statistics 2011 q2Chris Fyvie
 
Key performance indicators 04 01 2013
Key performance indicators   04 01 2013Key performance indicators   04 01 2013
Key performance indicators 04 01 2013ridabsha
 
Page 1 Front PagePage 2 Stocks & BondsPage 3 Financial Sum.docx
Page 1 Front PagePage 2 Stocks & BondsPage 3 Financial Sum.docxPage 1 Front PagePage 2 Stocks & BondsPage 3 Financial Sum.docx
Page 1 Front PagePage 2 Stocks & BondsPage 3 Financial Sum.docxalfred4lewis58146
 
30-06-2012 - 2Q12 Results Presentation
30-06-2012 - 2Q12 Results Presentation30-06-2012 - 2Q12 Results Presentation
30-06-2012 - 2Q12 Results Presentationsonaeri
 
Dr. Steve Pollmann - Sow lifetime productivity: Importance of monitoring in c...
Dr. Steve Pollmann - Sow lifetime productivity: Importance of monitoring in c...Dr. Steve Pollmann - Sow lifetime productivity: Importance of monitoring in c...
Dr. Steve Pollmann - Sow lifetime productivity: Importance of monitoring in c...John Blue
 
Final Performance Statistics.PDF
Final Performance Statistics.PDFFinal Performance Statistics.PDF
Final Performance Statistics.PDFEunice Fei Jin Shi
 

Similar to Women Knit Department (20)

Page 1 Front Page Page 2 Stocks & Bonds Page 3 Financial.docx
Page 1 Front Page Page 2 Stocks & Bonds Page 3 Financial.docxPage 1 Front Page Page 2 Stocks & Bonds Page 3 Financial.docx
Page 1 Front Page Page 2 Stocks & Bonds Page 3 Financial.docx
 
2222020 Report Pagehttpsww3.capsim.comcgi-bindispla.docx
2222020 Report Pagehttpsww3.capsim.comcgi-bindispla.docx2222020 Report Pagehttpsww3.capsim.comcgi-bindispla.docx
2222020 Report Pagehttpsww3.capsim.comcgi-bindispla.docx
 
2222020 Report Pagehttpsww3.capsim.comcgi-bindispla.docx
2222020 Report Pagehttpsww3.capsim.comcgi-bindispla.docx2222020 Report Pagehttpsww3.capsim.comcgi-bindispla.docx
2222020 Report Pagehttpsww3.capsim.comcgi-bindispla.docx
 
Chicagoland Quarterly Supply/Demand Report - 7/1/2011
Chicagoland Quarterly Supply/Demand Report - 7/1/2011Chicagoland Quarterly Supply/Demand Report - 7/1/2011
Chicagoland Quarterly Supply/Demand Report - 7/1/2011
 
Gta office market statistics q3 2011
Gta office market statistics q3 2011Gta office market statistics q3 2011
Gta office market statistics q3 2011
 
Chicago Real Estate Market Data - Broken Down by City
Chicago Real Estate Market Data - Broken Down by CityChicago Real Estate Market Data - Broken Down by City
Chicago Real Estate Market Data - Broken Down by City
 
H W 2010 Q1 De 12 Mo
H W 2010 Q1 De 12 MoH W 2010 Q1 De 12 Mo
H W 2010 Q1 De 12 Mo
 
Banco ABC - 1st Quarter 2008 Results Presentation
Banco ABC - 1st Quarter 2008 Results PresentationBanco ABC - 1st Quarter 2008 Results Presentation
Banco ABC - 1st Quarter 2008 Results Presentation
 
Appendix
AppendixAppendix
Appendix
 
Brunswick (BC) Pitch - Jonathan Chang - FINAL COPY
Brunswick (BC) Pitch - Jonathan Chang - FINAL COPYBrunswick (BC) Pitch - Jonathan Chang - FINAL COPY
Brunswick (BC) Pitch - Jonathan Chang - FINAL COPY
 
Wag Report 2009 Q4 De 12 Mo
Wag Report 2009 Q4 De 12 MoWag Report 2009 Q4 De 12 Mo
Wag Report 2009 Q4 De 12 Mo
 
Page 1 Front PagePage 2 Stocks & BondsPage 3 Financial Sum.docx
Page 1 Front PagePage 2 Stocks & BondsPage 3 Financial Sum.docxPage 1 Front PagePage 2 Stocks & BondsPage 3 Financial Sum.docx
Page 1 Front PagePage 2 Stocks & BondsPage 3 Financial Sum.docx
 
TAG infrastructure society logistics presentation by Page Siplon
TAG infrastructure society logistics presentation by Page SiplonTAG infrastructure society logistics presentation by Page Siplon
TAG infrastructure society logistics presentation by Page Siplon
 
Gta office market statistics 2011 q2
Gta office market statistics 2011 q2Gta office market statistics 2011 q2
Gta office market statistics 2011 q2
 
Roy Fisher Outlook 2012
Roy Fisher Outlook 2012Roy Fisher Outlook 2012
Roy Fisher Outlook 2012
 
Key performance indicators 04 01 2013
Key performance indicators   04 01 2013Key performance indicators   04 01 2013
Key performance indicators 04 01 2013
 
Page 1 Front PagePage 2 Stocks & BondsPage 3 Financial Sum.docx
Page 1 Front PagePage 2 Stocks & BondsPage 3 Financial Sum.docxPage 1 Front PagePage 2 Stocks & BondsPage 3 Financial Sum.docx
Page 1 Front PagePage 2 Stocks & BondsPage 3 Financial Sum.docx
 
30-06-2012 - 2Q12 Results Presentation
30-06-2012 - 2Q12 Results Presentation30-06-2012 - 2Q12 Results Presentation
30-06-2012 - 2Q12 Results Presentation
 
Dr. Steve Pollmann - Sow lifetime productivity: Importance of monitoring in c...
Dr. Steve Pollmann - Sow lifetime productivity: Importance of monitoring in c...Dr. Steve Pollmann - Sow lifetime productivity: Importance of monitoring in c...
Dr. Steve Pollmann - Sow lifetime productivity: Importance of monitoring in c...
 
Final Performance Statistics.PDF
Final Performance Statistics.PDFFinal Performance Statistics.PDF
Final Performance Statistics.PDF
 

Women Knit Department

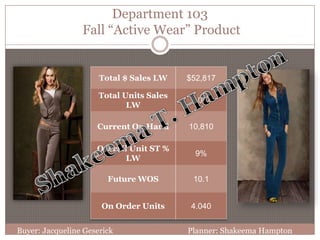
  • 1. Department 103 Fall “Active Wear” Product Total $ Sales LW $52,817 Total Units Sales 1,067 LW Current On Hand 10,810 Overall Unit ST % 9% LW Future WOS 10.1 On Order Units 4.040 Buyer: Jacqueline Geserick Planner: Shakeema Hampton
  • 2. Style Overview Sell- Sales OH On Sales $ Through WOS Units Units Order % Velour Basic $32,027 647 6,470 9.1% 10.0 1520 Hoodie Velour Mock Neck $14,801 299 3,692 7.5% 12.3 1800 Jacket Velour Graphic $5,990 121 648 15.7% 5.4 720 Hoodie $52,81 ALL 1,067 10,810 9.0% 10.1 4040 7
  • 3. Buyer Analysis on Styles  Best Performers $35,000  Volume Drivers: $30,000 Sales $  Velour Basic Hoodie Average $25,000  9.1% ST LW $20,000  Customer’s Top Pick: $15,000 $32,027  Velour Graphic Hoodie $14,801 o 15.7% ST LW $10,000 $5,000 $17,606 $17,606 $17,606 $5,990  Under Performing $0  Style: Mock Neck Jacket Velour Basic Velour Mock Velour Hoodie Neck Jacket Graphic  7.5%ST LW 
  • 4. Last Week Buyer Results Color Sell-Through by color 16.0% 14.0% •Top 3 Colors 12.0% -Truffle -Red 10.0% -Aquarium 8.0% 14.5% Bottom 3 Colors 6.0% 10.9% 12.3% - Navy 4.0% 7.8% 8.5% 7.6% 7.3% - Lingonberry 5.6% 2.0% - Grape Rizz 0.0%
  • 5. Planner Department Overview LAST WEEK RESULTS on “Velour Basic Hoodie” Total Units Sales 647 LW Current On Hand 6,470 Overall Unit ST % 24.2% LW Future WOS 10.0 On Order Units 1520
  • 6. Breakdown of LW Regions (WOS) Region 14.0 12.0 Lowest OH pen. 10.0 Region 5 7.9 .3% 8.0 Region 1 8.6 .2% 6.0 12.3 11.3 10.0 10.4 10.0 4.0 8.4 7.9 Highest OH pen. 2.0 Region 4 12.3 .2% Region 3 10.4 .1% 0.0 Region 6 11.3 .3%
  • 7. Breakdown of LW Regions Best Performing Regions Underperforming Regions Sales OH Store Name Region OH Units ST % WOS GRADE Store Name Region Sales Units ST % WOS GRADE Units Units Chicago (4) 3 19 254 7.0% 13.4 D Columbus 1 51 320 13.7% 6.3 A Chicago (23) 3 24 241 9.1% 10.0 D (1) Oakbrook (11) 3 28 241 10.4% 8.6 C Cleveland 1 15 120 11.1% 8.0 C 71 736 8.8% 10.4 (21) Houston (16) 4 23 306 7.0% 13.3 D Akron (19) 1 17 260 6.1% 15.3 E Dallas (25) 4 20 244 7.6% 12.2 D Ft Worth (5) 4 29 338 7.9% 11.7 D 83 700 10.6% 8.4 72 888 7.5% 12.3 Malibu (7) 5 41 304 11.9% 7.4 B Orlando (14) 6 21 291 6.7% 13.9 D Richmond (24) 6 20 258 7.2% 12.9 D Thousand Greenville (22) 6 21 255 7.6% 12.1 D 5 38 303 11.1% 8.0 C Oaks (12) Atlanta (10) 6 35 367 8.7% 10.5 D Daytona (8) 6 25 236 9.6% 9.4 C LA (3) 5 28 235 10.6% 8.4 C Atlanta (18) 6 13 119 9.8% 9.2 C 107 842 11.3% 7.9 135 1526 8.1% 11.3
  • 8. Regions By Location Best Performing Locations Underperforming Locations • Most Units Sales LW • Fewest Units Sales LW • Least OH Units • Most OH Units • Least WOS • Most WOS Store Sales Store Sales Region OH Units WOS GRADES Region OH Units WOS GRADES Name Units Name Units Newark Malibu (7) 5 41 304 7.4 B 2 7 135 19.3 F (6) Akron NYC (17) 2 49 338 6.9 B 1 17 260 15.3 E (19) Columbus Boston 1 51 320 6.3 A 2 17 239 14.1 E (1) (9)
  • 9. Buyer Memo to All FMM INC. Stores Issue:  Velour Basic Hoodie and Velour Graphic Hoodie are driving the business in active tops however the Velour Mock Neck Jacket need some help selling on the floor.  If the Velour Mock Neck Jacket keeps selling the way it is, then we will need to mark it down. Goal:  Corporate has decided that with a pricing strategy and remerchandising the floor in active tops it will improve our profits and eliminate markdowns Steps to Successful Execution  Determine traffic flow and #1 location  Merchandising the Floor: 2-Tier Table: 4-way rack Signage Customer Service Time Frame:  Floor change: November 11,2011- November 25, 2011
  • 10. Planner Memo to All FMM INC. Stores Issue:  Underperforming regions ( 3, 4, and 6) are not pushing products off the floor as fast as other regions. Also, region 2 and 7 can potentially become an underperforming region. Goal:  Corporate expects the following regions 3, 4, 6, 2 and 7 to increase its sell through percent to at least a 10% or above. Steps to Solution:  Department Meeting (Managers and Sales Associates)  Stress the SELL sequence  Pricing and remerchandising strategies must go into effect according to corporate standards. Rewards  Regions that reach a 10% or above sell through will receive a shirt voucher.

Editor's Notes

  1. Hello Ladies and Gentlemen, I will be discussing the results of both the regions and locations for the Velour basic Hoodie.We ended last week with total unit sales of 647, current on hand of 6,470 and an overall unit sell through % of 24.2%.All regions should now have a 10 week of supply and an On order unit of 1520.
  2. Lets take a look at the break down of each region. All regions should be at a future week supply of 10 or below.According the last week result, two regions are ahead of the pack while three regions are underperforming. Regions #5 and #1 are top performers, they both have a week of supply below 10.Region 5 is the best performing region this week, representing an 8 week supply with a decreasing OH penetration of .3% resulting to 13.0%Region 1 our second best performing region has an 9 week of supply with a decrease in .2% of its OH penetration resulting to 10.8%The following three regions are in a red zone Region 4 represents the #1 underperforming region with 12 weeks of supply increasing its OH unit penetration by .2% accumulating it to 13.7%Region 3 is close to 11 week of supply which has increased its OH unit penetration by .1% accumulating it to 11.4%Region 6 is at a 11 week of supply which has increased its OH unit penetration by .%3 raising it to 26.3%
  3. Top Performing Regions Region 5 (California stores) This region sell through% generated a 11.3% with only 7.9 WOS left. With a sales penetration of 16.5% and a decreasing OH penetration of 13% which is down .3 from BOW. The Grades are all in good standing; Malibu B, Thousand Oaks C, and LA C. Region 1 (Ohio States) The Ohio stores has a sell through% 10.6% and a 8.4 week of supply. This region has both an A grade store (Columbus) and a E grade store (Akron). Akron has caused this region to not perform to its greatest potential. Poor Performing Regions Region 4 (Texas stores)     This weeks #1 underperforming stores are located in Texas, the region only sold a 7.5% sell through last week which leaves its week of supply at a high of 12.3. This increased the OH penetration by .2 to 13.7%.Region 3 (  
  4. Top Performing LocationsColumbus, OH (#1)NYC (#17)Malibu(7)Poor Performing Locations     Newark, NJ (#6)Akron(#19)Boston(#9)