
Recommended
Recommended
More Related Content
Viewers also liked
Viewers also liked (10)
Similar to Nifty Sees Relentness Selling, Small Cap Closes Near Its Crucial Level
Similar to Nifty Sees Relentness Selling, Small Cap Closes Near Its Crucial Level (20)
More from Shailesh Saraf
More from Shailesh Saraf (20)
Recently uploaded
Recently uploaded (20)
Nifty Sees Relentness Selling, Small Cap Closes Near Its Crucial Level
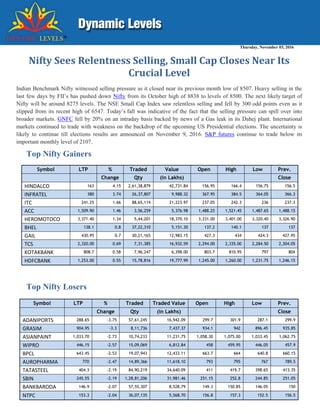
- 1. Thursday, November 03, 2016 Top Nifty Gainers Symbol LTP % Traded Value Open High Low Prev. Change Qty (in Lakhs) Close HINDALCO 163 4.15 2,61,38,879 42,731.84 156.95 166.4 156.75 156.5 INFRATEL 380 3.74 26,37,807 9,988.32 367.95 384.5 364.05 366.3 ITC 241.25 1.66 88,65,114 21,223.97 237.05 242.3 236 237.3 ACC 1,509.90 1.46 3,56,259 5,376.98 1,488.25 1,521.45 1,487.65 1,488.15 HEROMOTOCO 3,371.40 1.34 5,44,201 18,370.10 3,331.00 3,401.00 3,320.40 3,326.90 BHEL 138.1 0.8 37,22,310 5,151.30 137.2 140.1 137 137 GAIL 430.95 0.7 30,21,165 12,983.15 427.3 434 424.3 427.95 TCS 2,320.00 0.69 7,31,385 16,932.59 2,294.00 2,335.00 2,284.50 2,304.05 KOTAKBANK 808.7 0.58 7,96,247 6,398.00 803.7 810.95 797 804 HDFCBANK 1,253.00 0.55 15,78,816 19,777.99 1,245.00 1,260.00 1,231.75 1,246.15 Top Nifty Losers Nifty Sees Relentness Selling, Small Cap Closes Near Its Crucial Level Indian Benchmark Nifty witnessed selling pressure as it closed near its previous month low of 8507. Heavy selling in the last few days by FII’s has pushed down Nifty from its October high of 8838 to levels of 8500. The next likely target of Nifty will be around 8275 levels. The NSE Small Cap Index saw relentless selling and fell by 300 odd points even as it slipped from its recent high of 6547. Today’s fall was indicative of the fact that the selling pressure can spill over into broader markets. GNFC fell by 20% on an intraday basis backed by news of a Gas leak in its Dahej plant. International markets continued to trade with weakness on the backdrop of the upcoming US Presidential elections. The uncertainty is likely to continue till elections results are announced on November 9, 2016. S&P futures continue to trade below its important monthly level of 2107. Symbol LTP % Traded Traded Value Open High Low Prev. Change Qty (in Lakhs) Close ADANIPORTS 288.65 -3.75 57,61,245 16,942.09 299.7 301.9 287.1 299.9 GRASIM 904.95 -3.3 8,11,736 7,437.37 934.1 942 896.45 935.85 ASIANPAINT 1,033.70 -2.73 10,74,233 11,231.75 1,058.30 1,075.00 1,033.45 1,062.75 WIPRO 446.15 -2.57 15,09,069 6,812.84 458 459.95 446.05 457.9 BPCL 643.45 -2.53 19,07,943 12,433.11 663.7 664 640.8 660.15 AUROPHARMA 770 -2.47 14,89,366 11,618.10 793 795 767 789.5 TATASTEEL 404.3 -2.19 84,90,219 34,640.09 411 419.7 398.65 413.35 SBIN 245.55 -2.19 1,28,81,206 31,981.46 251.15 252.8 244.85 251.05 BANKBARODA 146.9 -2.07 57,55,307 8,528.79 149.3 150.85 146.05 150 NTPC 153.3 -2.04 36,07,135 5,568.70 156.8 157.3 152.5 156.5
- 2. Dynamic Sector Performance Only Auto- Tyres and Tubes sector closed in the green zone, up by 0.72 per cent. A quick View of the Sectors SECTOR % CHANGE TODAY AUTO- TYRES AND TUBES 0.72% DEFENCE -0.01% JEWELLERY -0.03% TRANSPORTATION LOGISTICS -0.30% FMCG- SUGAR -0.34% INFRA- POWER -0.38% MEDIA- ENTERTAINMENT -0.39% BANKS-PRIVATE -0.50% FMCG -0.54% REALTY- HOUSEHOLD -0.63% INFRA- TELECOM -0.67% FINANCIAL SERVICES -0.71% AIRLINES -0.72% INFRA- MACHINERY EQUIPMENT -0.72% FMCG- BREVERAGES -0.76% CEMENT -0.78% REALTY -0.98% PHARMA -1.05% AUTO- AUTOMOBILES AND AUTO PARTS -1.07% TEXTILES AND APPAREL -1.14% IT -1.24% FMCG- FOOD -1.31% FINANCIAL SERVICES- NBFC -1.41% AUTO-AUTO ANCL AND COMPONENTS -1.46% FMCG- PACKAGING -1.49% INFRA- CONSTRUCTION ENGINEERING AND MATERIALS -1.64% BANKS-PSU -1.65% ENERGY-OIL & GAS -1.74% ENTERTAINMENT-HOTELS AND LEISURE -1.76% CHEMICALS -1.96% DIVERSIFIED -1.99% METALS AND MINING -2.10% PAPER -2.22% FOOTWEAR -2.24% MEDIA -2.49% FERTILISERS -3.92%
- 3. NSE High Volumes Stock Performer List TOP GAINER TOP LOSER SYMBOL LTP %CHANGE SECTOR SYMBOL LTP %CHANGE SECTOR HIKAL 228.45 3.84 PHARMA GNFC 220.90 -17.79 FERTILISERS TRIDENT 59.85 3.19 TEXTILES AND APPAREL CENTENKA 318.35 -10.34 TEXTILES AND APPAREL NAVINFLUOR 2522.10 2.80 CHEMICALS IGPL 292.15 -10.00 CHEMICALS NEULANDLAB 992.70 1.94 PHARMA RBL 1022.25 -5.67 AUTO- AUTOMOBILES AND AUTO PARTS DCBBANK 129.20 1.77 BANKS-PRIVATE CHEMFALKAL 325.40 -5.19 CHEMICALS ADANITRANS 46.05 1.66 INFRA- POWER CHENNPETRO 260.60 -5.18 ENERGY-OIL & GAS DALMIASUG 119.00 1.58 FMCG- SUGAR MOIL 359.00 -5.05 METALS AND MINING NILKAMAL 1730.15 1.54 REALTY- HOUSEHOLD ADFFOODS 166.55 -4.88 FMCG- FOOD MINDAIND 390.00 1.44 AUTO- AUTOMOBILES AND AUTO PARTS HEIDELBERG 138.30 -4.52 CEMENT DHAMPURSUG 123.00 1.32 FMCG- SUGAR PRAKASH 58.90 -4.15 METALS AND MINING OBEROIRLTY 363.00 1.11 REALTY COSMOFILMS 396.00 -3.99 FMCG- PACKAGING RICOAUTO 72.50 1.05 AUTO- AUTOMOBILES AND AUTO PARTS MOTILALOFS 532.95 -3.78 FINANCIAL SERVICES MANAPPURAM 100.70 1.05 FINANCIAL SERVICES- NBFC BHAGERIA 383.50 -3.65 CHEMICALS HERITGFOOD 842.70 0.98 FMCG- FOOD MANGLMCEM 332.95 -3.44 CEMENT HIMATSEIDE 298.00 0.97 TEXTILES AND APPAREL UCALFUEL 215.00 -3.41 AUTO-AUTO ANCL AND COMPONENTS VISAKAIND 221.55 0.96 CEMENT CENTURYPLY 232.90 -3.32 REALTY- HOUSEHOLD ESCORTS 373.90 0.47 AUTO- AUTOMOBILES AND AUTO PARTS JKCEMENT 877.30 -3.06 CEMENT RAIN 53.05 0.38 CEMENT SUDARSCHEM 379.95 -2.97 CHEMICALS CCL 250.85 0.30 FMCG- BREVERAGES DCMSHRIRAM 239.55 -2.96 DIVERSIFIED SIMPLEXINF 324.00 0.28 INFRA- CONSTRUCTION ENGINEERING AND MATERIALS STCINDIA 133.85 -2.80 DIVERSIFIED GEOMETRIC 230.80 0.28 IT INDIANB 213.80 -2.70 BANKS-PSU AARTIIND 736.75 0.20 CHEMICALS SHARDACROP 411.00 -2.66 CHEMICALS IIFL 318.35 0.17 FINANCIAL SERVICES SARDAEN 263.80 -2.64 METALS AND MINING JMFINANCIL 80.80 0.12 FINANCIAL SERVICES SUPPETRO 217.25 -2.58 CHEMICALS TRIVENI 58.60 0.09 FMCG- SUGAR GSFC 94.70 -2.57 FERTILISERS HGS 557.00 0.07 IT GAEL 93.75 -2.50 FMCG- FOOD FIEMIND 1343.05 -0.09 AUTO-AUTO ANCL AND COMPONENTS PRICOL 112.50 -2.43 AUTO-AUTO ANCL AND COMPONENTS FINCABLES 438.40 -0.11 INFRA- TELECOM DEEPIND 250.10 -2.32 ENERGY-OIL & GAS INDIANHUME 808.00 -0.15 INFRA- CONSTRUCTION ENGINEERING AND MATERIALS WSTCSTPAPR 134.95 -2.32 PAPER
- 4. Hot Picks of the Day Sugar Sector- As a result of robust earnings for the quarter ended 30th September 2016 as reported by the leading sugar producers of the country most of the sugar giants saw a huge surge (about 15 per cent) in the share price in the last few trading sessions. Tata & Mistry- Tata Empire splits into two as Cyrus Mistry stays Chairman of Group units. A new angle to the Mistry-Tata spat is that Tata Sons board’s remuneration panel had lauded ex-chairman’s performance in June. Gujarat Narmada Valley Fertilizers & Chemicals (GNFC share price) has tanked 20 per cent to Rs 216 on the Bombay Stock Exchange in intra-day trade on the back of heavy volumes. At 11:42 am, the stock was down 14 per cent at Rs 231, after hitting a day high of Rs 270 in early morning deal. The trading volumes on the exchanges went to double with a combined 16.28 million shares representing 10.5 per cent of total shares of GNFC have changed hands on BSE as well as NSE. The Exchange has sought clarification from GNFC, with reference. The reply is awaited. GNFC on October 28th , 2016 informed the Bombay Stock Exchange that N V Ratnani, one of the employees of the company, who is a ‘Designated Person’ within the meaning of SEBI Regulations, has violated the code of conduct SEBI Insider Trading Regulations, 2015, by acquiring 7,500 shares, at a total value of around Rs 16 lacs, during the period from October 15, 2016 to October 21, 2016, which is in excess of the threshold limit of Rs 10 lacs, without undergoing the procedure of pre-clearance from the compliance officer of the company. During the period, the stock had rallied 25 per cent from Rs 194 to Rs 242, as compared to 1.5 per cent rise in the S&P BSE Sensex. The stock closed a record high of Rs 282 on October 25, appreciated 105 per cent from its recent low of Rs 138 touched on August 10. The benchmark index gained 1.1 per cent during the same period. GNFC Share s Dipped 20%, Exchange Sought Clarification GNFC board will meet on 10th November, 2016, to approve the unaudited financial results for the second quarter / half year ended September 30th , 2016. For the first quarter ended June 30th , 2016, the company had posted a standalone net profit of Rs 51 crores against a net loss of Rs 9 crores in Q1FY16. GNFC share price trading at Rs 241.05 apiece on NSE at present (12:42 PM).
- 5. Ambuja Cements' third quarter standalone profit is anticipated to rise 41.6 per cent Y- o-Y to Rs 220 crore on the back of strong operational performance. Revenue during the quarter can decline 0.5 per cent to Rs 2,100 crore on lower volume Y-o-Y. Sales volume is anticipated to be marginally negative, down 1 per cent Y-o-Y(down 17 per cent Q-o-Q) to 4.76 million tonnes in Q3. Analysts are of the view that blended realizations are expected to be higher by 2/3 per cent Y-o-Y. During this quarter, central & north prices grew 7-10 per cent Y-o-Y, which may be offset by weakness in East and West India. It has no exposure to South India where prices are lower Y-o-Y but spiked Q-o-Q. It follows the January-December as its financial year. Operating profit (EBITDA - earnings before interest, tax, depreciation and amortization) will hopefully jump 20.9 per cent Y-o-Y to Rs 375 crore and margin may expand 320 basis points to 17.9 per cent in the quarter ended September 2016. Margin expansion may be led by lower energy cost and higher realization. EBITDA per tonne is seen to rise 30 per cent Y-o-Y but may fall 21 per cent Q-o-Q. As the trading session commenced on 3rd Nov, Ambuja Cements share price opened at Rs. 240 against its previous closing at Rs. 240.60. The stock is trading at Rs. 240.60. Ambuja Cements share price touched its 52 week high value at Rs. 281.70 on 31st August ’16 whereas the 52 week low value is seen at Rs. 185.00on 29th Feb ‘16. The company has a market cap amounting to Rs. 47774.62 (Cr) and has a book value of Rs. 52.17. Torrent Power reported a 43 per cent drop in its consolidated net profit for the quarter ended 30th September 2016 at Rs 141 crores, majorly due to partial recovery of fixed costs at its generation plants. The company had posted a net profit after tax (Net PAT), non-controlling interest and share of profit/ (loss) of an associate at Rs 247.01 crores for the second quarter last year, Torrent Power said in a regulatory filing to the exchanges. According to the filed statement, total income decreased from Rs 3,228.79 crores for the quarter to Rs 2,726.80 crores for the corresponding period a year ago. Net income of the firm from operations decreased to Rs 2,627.93 crores in the second quarter of 2016 from Rs 3,056.95 crores a year ago. Listing major reasons for variation in results, the company commented, "Recovery of partial fixed cost of DGEN (Dahej power plant) and UNOSUGEN (Surat power plant) power plants in Q2 FY2015- 16 due to allocation of gas under the 'Scheme for Utilisation of Gas Based Power Generation Capacity' issued by Ministry of Power." Ambuja Cements Q3 Profit May Rise 42% Torrent Power Q2 Net Dips 43% at Rs 141 Cr
- 6. Premier Explosives Ltd reported its standalone numbers for the quarter ended 30th September 2016 post market hours of 2nd November 2016. Revenue for the quarter increased 35.8 per cent year on year to Rs 55 crores. Reported EBITDA surged by 82.8 per cent year on year to Rs 5 crores while EBITDA margins improved by 243 bps year on year to 9.45 per cent led by operating efficiency. Net profit increased by 27 per cent year on year to Rs 2.4 crores primarily due to 20 per cent year on year rise in finance cost and 13 per cent year on year decline in other income. Earlier in the month of October this year Premier Explosives bagged an order worth Rs 27.79 crores from Bharat Dynamics for supply of booster grains. The order is to be executed before 30th June of 2017. Premier Explosives Limited (PEL) is considered to be one of the major companies in India manufacturing the entire range of commercial explosives as well as accessories for the civil requirement. Currently the company is only Indian private entity designs, develops and manufactures solid propellants for Indian missiles viz. Akash, Astra, etc. Amongst many firsts, the company is the first company in the world to produce safer and greener NHN (Nickel Hydrazine Nitrate) detonators on commercial scale replacing ASA (Lead Azide, Lead Styphnate and Aluminum Powder) detonators. PEL is operating and also maintaining a State-of-Art Chemical manufacturing facility of Indian Space Research Organisation or ISRO at Sriharikota and Solid Fuel Complex of Advanced Systems Laboratory at Jagdalpur. Premier Explosives share price is currently trading at Rs 387.65, up by 3.80 per cent. The share price made a lifetime high of Rs 402.05 in today’s trading session. Premier Explosives Ltd Standalone Results Q2FY17: (Rs. in crore) Q2FY17 YoY (%) Revenue 54.92 35.8 EDITDA 5.19 82.8 EBITDA Margin (%) 9.5 243 Net Profit (adjusted) 2.4 27 ***EBITDA margin change is bps Premier Explosives Makes Lifetime High Post Q2 Results
- 7. Conclusion: The trader will be eager to watch whether Nifty will recover tomorrow or the selling spree will continue. Disclaimer The investment advice or guidance provided by way of recommendations, reports or other ways are solely the personal views of the research team. Users are advised to use the data for the purpose of information and rely on their own judgment while making investment decision. Dynamic Equities Pvt. Ltd - SEBI Investment Advisory Reg. No.: INA300002022 Disclosure Dynamic Equities Pvt. Ltd. is a member of NSE, BSE, MCX SX and a DP with NSDL & CDSL. It is also engaged in Investment Advisory Services and Portfolio Management Services. Dynamic Commodities Pvt. Ltd., associate company, is a member of MCX & NCDEX. We declare that our activities were neither suspended nor we have defaulted with any stock exchange authority with whom we are registered. SEBI, Exchanges and Depositories have conducted the routine inspection and based on their observations have issued advise letters or levied minor penalty on for certain operational deviations. Answers to the Best of our knowledge and belief of Dynamic/ its Associates/ Research Analyst: DYNAMIC/its Associates/ Research Analyst/ his Relative: Do not have any financial interest / any actual/beneficial ownership in the subject company. Do not have any other material conflict of interest at the time of publication of the research report Have not received any compensation from the subject company in the past twelve months Have not managed or co-managed public offering of securities for the subject company. Have not received any compensation for brokerage services or any products / services or any compensation or other benefits from the subject company, nor engaged in market making activity for the subject company Have not served as an officer, director or employee of the subject company Report Prepared By: Mayank Jain - NISM-201500086427 Vikash Kandoi - NISM-201500086430