Secretarybirds and Citizen Science in South Africa
•Download as PPTX, PDF•
1 like•1,318 views

A short slideshow describing how we used citizen science data to assess the status and ecology of Secretarybirds (Sagittarius serpentarius) in South Africa.

Recommended
Recommended
More Related Content
Similar to Secretarybirds and Citizen Science in South Africa
Similar to Secretarybirds and Citizen Science in South Africa (20)
Recently uploaded
Recently uploaded (20)
Secretarybirds and Citizen Science in South Africa
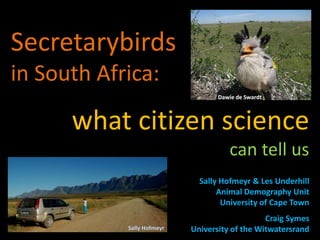
- 1. Secretarybirds in South Africa: what citizen science can tell us Sally Hofmeyr & Les Underhill Animal Demography Unit University of Cape Town Craig Symes University of the Witwatersrand Dawie de Swardt Sally Hofmeyr
- 2. Secretarybird (Sagittarius serpentarius) • Eats insects, reptiles, mammals, birds, eggs • Disturbs prey by stamping on ground; kills prey with bill or by stamping on it • Large territories: 50–60 km2 around nest • Breeds in pairs in trees; usually seen in pairs, walking around, hunting • Mainly grassland and open savanna habitats Beverly Joubert • Vulnerable (2011 IUCN Red List), declining throughout rest of Africa – but how is it doing here in SA?
- 3. We used data from: CAR project (Coordinated Avifaunal Roadcounts) SABAP1 & SABAP2 (Southern African Bird Atlas Projects 1 and 2)
- 4. Bird lists collected throughout southern Africa, which is divided up into grid cells based on latitude and longitude. Comparing the two projects: Southern African Bird Atlas Projects (SABAP) SABAP2: • 2007 – ongoing • Pentads (5 × 5) • 5-day recording period SABAP1: • 1987 – 1992 • Quarter degree grid cells (15 × 15) • 30-day recording period
- 5. SABAP data analysis • Compared reporting rates between SABAP1 and SABAP2. (Reporting rate = % of checklists for each grid cell that report the species you’re looking at) • Used a statistical method to test how likely the differences are to be real • Made a map with grid cells colour-coded according to how sure we are that the difference is real
- 6. SABAP data – changes in Secretarybird reporting rates from SABAP1 to SABAP2 22 May 2014 Johann du Preez Red, orange, yellow = DECLINES Blue, green, green = INCREASES The darker the colour, the more sure we are that the change is real, and reflects a change in abundance.
- 7. SABAP data – changes in Secretarybird reporting rates from SABAP1 to SABAP2 22 May 2014 Johann du Preez Red, orange, yellow = DECLINES Blue, green, green = INCREASES The darker the colour, the more sure we are that the change is real, and reflects a change in abundance. Note that we needed ALL the checklists for each grid cell to be able to use this method. Thus every checklist submitted was used – not just those that reported Secretarybirds!
- 8. 0% 10% 20% 30% 40% 50% 60% 70% 80% 90% 100% Kruger National Park Northern Cape Eastern Cape Free State Western Cape North West Gauteng Mpumalanga KwaZulu-Natal Limpopo SABAP data – counts of each type of grid cell in each province and in Kruger National Park
- 9. The CAR project • Counts of large terrestrial birds in agricultural habitats • Fixed routes, mostly about 60 km long; strict protocol • Two counts per year – summer and winter – same day countrywide • Project started in 1993, spread across south-eastern half of SA • We used the habitat data to look at Secretarybirds’ habitat selection and habitat use
- 10. 340 routes; ~ 19 000 km CAR route map – a huge chunk of the country is sampled!
- 11. -0.6 -0.4 -0.2 0.0 0.2 0.4 0.6 0.8 S W S W S W S W S W S W S W Eastern Cape Free State Gauteng KwaZulu- Natal Mpumalanga Northern Cape Western Cape Transformed|Natural CAR data – habitat selection Dawie de Swardt S = summer, W = winter E Cape F State Gauteng KZN Mpum. N Cape W Cape This shows that except in Northern Cape in winter, Secretarybirds prefer natural habitats to transformed. “Transformed” includes everything from cultivated land to cities and mines. “Natural” includes natural veld that is used as grazing land, however, so it does not necessarily mean “pristine”.
- 12. CAR data – habitat use The majority of Secretarybirds were seen in natural habitats, except in W Cape, where more than half were in transformed areas. In W Cape, cultivation has converted fynbos shrublands into open habitats, more suitable for Secretarybirds. Despite this, these long-legged marching birds still actually prefer natural W Cape habitats – it’s just that there’s so little of those left now. Helen and Dicky Badenhorst
- 13. • SA population seems to be declining overall • Main causes in SA are probably habitat loss and bush encroachment Most importantly, we could not have known this without the hugely valuable contributions of thousands of citizen scientists! Read the full paper: Hofmeyr SD, Symes CT, Underhill LG (2014) Secretarybird Sagittarius serpentarius Population Trends and Ecology: Insights from South African Citizen Science Data. PLoS ONE 9(5): e96772. doi:10.1371/journal.pone.0096772 http://www.plosone.org/article/info%3Adoi%2F10.1371%2Fjournal.pone.0096772 To conclude Nico Myburg Dawie de Swardt