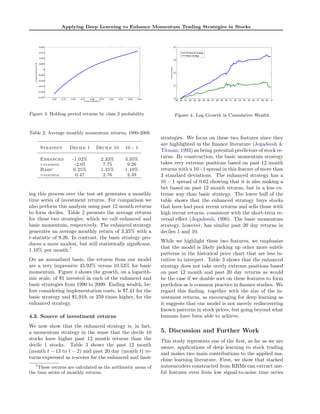
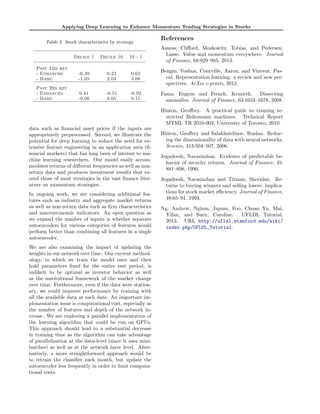
SlideShare a Scribd company logo
1 of 5
Download to read offline
This version: December 12, 2013
Applying Deep Learning to Enhance
Momentum Trading Strategies in Stocks
Lawrence Takeuchi * ltakeuch@stanford.edu
Yu-Ying (Albert) Lee yy.albert.lee@gmail.com
Abstract
We use an autoencoder composed of stacked
restricted Boltzmann machines to extract
features from the history of individual stock
prices. Our model is able to discover an en-
hanced version of the momentum e↵ect in
stocks without extensive hand-engineering of
input features and deliver an annualized re-
turn of 45.93% over the 1990-2009 test period
versus 10.53% for basic momentum.
1. Introduction
Price momentum is the empirical finding (Jegadeesh &
Titman, 1993) that stocks with high past returns over
3-to-12 months (winners) continue to perform well over
the next few months relative to stocks with low past
returns (losers). Subsequent studies find that this mo-
mentum e↵ect continues to remain robust in the US
after becoming widely known and applies to interna-
tional stocks as well as other asset classes including for-
eign exchange, commodities, and bonds (Asness et al.,
2013). For finance academics the fact that a simple
strategy of buying winners and selling losers can ap-
parently be profitable challenges the notion that mar-
kets quickly incorporate available information into as-
set prices. Indeed, Fama and French (2008) describe
momentum as the “premier anomaly” in stock returns.
The momentum trading strategy, along with its many
refinements, is largely the product of a vast, ongoing
e↵ort by finance academics and practitioners to hand-
engineer features from historical stock prices. Recent
advances in deep learning hold the promise of allowing
machine learning algorithms to extract discriminative
information from data without such labor-intensive
feature engineering and have been successfully applied
to fields such as speech recognition, image recognition,
*Corresponding author.
and natural language processing (Bengio et al., 2012).
In this paper we examine whether deep learning tech-
niques can discover features in the time series of stock
prices that can successfully predict future returns. The
objective is a challenging one. While most research in
deep learning considers tasks that are easy for humans
to accomplish, predicting stock returns using publicly
available information is notoriously di cult even for
professional investors given the high level of noise in
stock price movements. Furthermore, any patterns
that exist are subject to change as investors themselves
learn over time and compete for trading profits.
Considering the pervasive use of historical price charts
by investors and noting that the primary mode of anal-
ysis is visual, we take an approach similar to that used
by Hinton and Salakhutdinov (2006) to classify hand-
written digits. In particular, we use an autoencoder
composed of stacked restricted Boltzmann machines
(RBMs) to extract features from stock prices, which
we then pass to a feedforward neural network (FFNN)
classifier.
2. Data
We obtain data on individual US stocks from the Cen-
ter for Research in Security Prices.
2.1. Sample selection
We restrict our analysis to ordinary shares trading on
NYSE, AMEX, or Nasdaq. To mitigate the impact of
any market microstructure-related noise, we exclude
stocks with monthly closing prices below $5 per share
at the time of portfolio formation. This step also re-
duces the number of examples with extreme returns.
The training set covers the period from January 1965
to December 1989, which coincides with the period ex-
amined by Jegadeesh and Titman (1993), and contains
848,000 stock/month examples. The test set covers
the period from January 1990 to December 2009 and
contains 924,300 stock/month examples. On average
Applying Deep Learning to Enhance Momentum Trading Strategies in Stocks
there are 3,282 stocks in the sample each month.
2.2. Input variables and preprocessing
We want to provide our model with information that
would be available from the historical price chart for
each stock and let it extract useful features without
the need for extensive feature engineering. For every
month t, we use the 12 monthly returns for month t 2
through t 13 and the 20 daily returns approximately
corresponding to month t.1
We also use an indicator
variable if the holding period, month t + 1, falls in
January.2
Thus we have a total of 33 input variables
for each stock/month example.
Next we compute a series of 12 cumulative returns
using the monthly returns and 20 cumulative returns
using the the daily returns. We note that price mo-
mentum is a cross-sectional phenomenon with winners
having high past returns and losers having low past re-
turns relative to other stocks. Thus we normalize each
of the cumulative returns by calculating the z-score rel-
ative to the cross-section of all stocks for each month
or day. Figure 1 illustrates preprocessing pipeline us-
ing the 12 monthly returns for one example in the test
set.
Finally we use returns over the subsequent month, t +
1, to label the examples with returns below the median
as belonging to class 1 and those with returns above
the median to class 2.
Figure 1. Preprocessing of inputs
1
We choose these inputs given the casual observation
that investors tend to use higher frequency prices when
viewing charts covering shorter windows of time.
2
Turn-of-the-year patterns in stock returns were well-
known prior to Jegadeesh and Titman (1993). In any case,
using dummy variables for each calendar month gives sim-
ilar results.
3. Deep Learning Model
3.1. Model and learning algorithm
We follow an approach similar to that introduced by
Hinton and Salakhutdinov (2006) to train networks
with multiple hidden layers. Our model consists of a
stack of RBMs, which unlike full Boltzmann machines
have no intra-layer connections. Each RBM consists
of one layer of visible units (the inputs) and one layer
of hidden units connected by symmetric links. The
output of each RBM serves as the input to the next
RBM in the stack.
We train the encoder network (see Figure 2) layer by
layer in a pretraining step. Following Hinton (2010),
we split the dataset into smaller, non-overlapping
mini-batches. The RBMs in the encoder are then un-
rolled to form an encoder-decoder, which is fine tuned
using backpropagation. In our implementation, the
number of hidden units in the final layer of the encoder
is sharply reduced, which forces a reduction in dimen-
sionality. As described below, however, the size of this
bottleneck layer is an outcome of the optimization pro-
cedure we use to specify the network dimensions rather
than an explicit design choice.3
At this stage, the encoder outputs a low dimensional
representation of the inputs. The intention is that it
retains interesting features from the historical stock
chart that are useful for forecasting returns, but elim-
inates irrelevant noise. We use the weights estimated
thus far to initialize the corresponding weights in the
full network, which is composed of the encoder and a
FFNN classifier. The final step is to train the entire
network using the labeled examples via backpropaga-
tion.4
3.2. Network specification
We use hold-out cross validation to determine the
number of layers and number of units per layer in our
network. In particular, we further divide the train-
ing set into two subsets covering 1965-1982 and 1983-
1989, respectively. Each model specification is trained
on the first subset and then tested on the second. We
choose this approach over k-fold cross validation since
we have a su ciently large dataset and more impor-
tantly want to avoid the look-ahead bias that could
arise from training the model with data not available
at a given historical date.
3
Hinton and Salakhutdinov (2006), by contrast, omit an
explicit bottleneck layer in their digit classification example
and use a 784-500-500-2000-10 network.
4
See Ng et al. (2013) for a tutorial on training deep
networks.
Applying Deep Learning to Enhance Momentum Trading Strategies in Stocks
Figure 2. Network Architecture
To keep the task manageable, we fix the number of
units in the penultimate hidden layer at 50.5
Thus,
our first set of candidate specifications is 33 s2 50 2
and the second is 33 s2 s3 50 2 where sl de-
notes the number of units in layer l. A grid search
over the number of units using our hold-out cross val-
idation scheme finds that s2 = 40 and s3 = 4 give
the lowest classification error. The next set of candi-
date specifications is 33 s2 s3 s4 50 2. Given
the large number of dimensions, we use s2 = 40 and
s4 = 4 and only search over s3. We find that adding
another layer does not reduce the classification error.6
Thus our final specification is the five-layer network
33 40 4 50 2 consisting of an encoder that takes
33 inputs and reduces them to a 4 dimensional code
and a classifier that takes these 4 inputs and outputs
the probabilities for the two classes. While the ap-
proach taken is admittedly heuristic, we believe that
it provides a disciplined method to specify a base case
model.
4. Results
We train our model using the examples from 1965-1989
and test it using those from 1990-2009. In this section
we keep both the network configuration and weights
fixed, but discuss later how these could be updated
over time.
5
However, once we determine the specification of the
stacked autoencoders we verify that this is a reasonable
choice.
6
Our ongoing work suggests that additional layers may
be useful when the number of features are increased.
Table 1. Confusion Matrix
Predicted
1 2
Actual 1 22.38% 27.45%
2 19.19% 30.97%
4.1. Classification performance
Table 1 summarizes the results in a confusion matrix
with the entries scaled by the total number of test
examples. The model achieves an overall accuracy rate
of 53.36%. The model is correct 53.84% of the time
when it predicts class 1 and a somewhat lower 53.01%
of the time when it predicts class 2.
These probabilities alone, however, do not provide a
complete picture of the model’s performance since in-
vestors actually care more about returns in their objec-
tive function. In particular, we would like to compare
the realized returns for the stocks predicted to be in
class 1 against those for stocks predicted to be in class
2. Pooling all months in the test set, the average one-
month holding period return is 0.11% for stocks pre-
dicted to be in class 1 and 1.50% for those predicted to
be in class 2, or a di↵erence of 1.39%. Alternatively,
we can use past 12 month returns (from month t 13
to t 2) and predict that examples with past returns
below the median will be in class 1 and those above
the median in class 2. This basic momentum strategy
produces an average holding period return of 0.64%
for stocks in class 1 and 1.20% for those in class 2, or
a di↵erence of 0.55%.
4.2. Information content of class probabilities
While these results appear promising, we have used
only a portion of the information produced by the
model. Figure 3 shows the relation between the es-
timated probability of being in class 2 according to
the model versus the holding period return that is ac-
tually realized for the test set, where we use a Gaus-
sian kernel regression to smooth the curve. We see
an increasing relation indicating that a higher class 2
probability leads to higher realized returns on average.
Since there is no requirement to hold every stock, an
investor could clearly do better if he bought and sold
stocks in the tails of the distribution rather than using
the 50% threshold to form long and short portfolios.
We rank all stocks each month by their class 2 proba-
bilities and buy those in the top decile and sell those in
the bottom decile. Next month we close out these posi-
tions and form new long and short portfolios. Repeat-
Applying Deep Learning to Enhance Momentum Trading Strategies in Stocks
0.20 0.25 0.30 0.35 0.40 0.45 0.50 0.55 0.60 0.65
−0.025
−0.020
−0.015
−0.010
−0.005
0
0.005
0.010
0.015
0.020
CLASS 2 PROBABILITY
HOLDINGPERIODRETURN
Figure 3. Holding period returns by class 2 probability
Table 2. Average monthly momentum returns, 1990-2009.
Strategy Decile 1 Decile 10 10 - 1
Enhanced -1.02% 2.33% 3.35%
t-statistic -2.05 7.75 9.26
Basic 0.25% 1.35% 1.10%
t-statistic 0.47 2.76 2.39
ing this process over the test set generates a monthly
time series of investment returns. For comparison we
also perform this analysis using past 12 month returns
to form deciles. Table 2 presents the average returns
for these two strategies, which we call enhanced and
basic momentum, respectively. The enhanced strategy
generates an average monthly return of 3.35% with a
t-statistic of 9.26. In contrast, the basic strategy pro-
duces a more modest, but still statistically significant,
1.10% per month.7
On an annualized basis, the returns from our model
are a very impressive 45.93% versus 10.53% for basic
momentum. Figure 4 shows the growth, on a logarith-
mic scale, of $1 invested in each of the enhanced and
basic strategies from 1990 to 2009. Ending wealth, be-
fore considering implementation costs, is $7.41 for the
basic strategy and $1,919, or 259 times higher, for the
enhanced strategy.
4.3. Source of investment returns
We now show that the enhanced strategy is, in fact,
a momentum strategy in the sense that the decile 10
stocks have higher past 12 month returns than the
decile 1 stocks. Table 3 shows the past 12 month
(month t 13 to t 2) and past 20 day (month t) re-
turns expressed as z-scores for the enhanced and basic
7
These returns are calculated as the arithmetic mean of
the time series of monthly returns.
89 90 91 92 93 94 95 96 97 98 99 00 01 02 03 04 05 06 07 08 09 10
10
0
10
1
10
2
10
3
10
4
CumulativeWealth
Enhanced strategy
Basic strategy
Figure 4. Log Growth in Cumulative Wealth
strategies. We focus on these two features since they
are highlighted in the finance literature (Jegadeesh &
Titman, 1993) as being potential predictors of stock re-
turns. By construction, the basic momentum strategy
takes very extreme positions based on past 12 month
returns with a 10 1 spread in this feature of more than
3 standard deviations. The enhanced strategy has a
10 1 spread of 0.62 showing that it is also making a
bet based on past 12 month returns, but in a less ex-
treme way than basic strategy. The lower half of the
table shows that the enhanced strategy buys stocks
that have had poor recent returns and sells those with
high recent returns, consistent with the short-term re-
versal e↵ect (Jegadeesh, 1990). The basic momentum
strategy, however, has similar past 20 day returns in
deciles 1 and 10.
While we highlight these two features, we emphasize
that the model is likely picking up other more subtle
patterns in the historical price chart that are less in-
tuitive to interpret. Table 3 shows that the enhanced
strategy does not take overly extreme positions based
on past 12 month and past 20 day returns as would
be the case if we double sort on these features to form
portfolios as is common practice in finance studies. We
regard this finding, together with the size of the in-
vestment returns, as encouraging for deep learning as
it suggests that our model is not merely rediscovering
known patterns in stock prices, but going beyond what
humans have been able to achieve.
5. Discussion and Further Work
This study represents one of the first, as far as we are
aware, applications of deep learning to stock trading
and makes two main contributions to the applied ma-
chine learning literature. First, we show that stacked
autoencoders constructed from RBMs can extract use-
ful features even from low signal-to-noise time series
Applying Deep Learning to Enhance Momentum Trading Strategies in Stocks
Table 3. Stock characteristics by strategy.
Decile 1 Decile 10 10 - 1
Past 12m ret
- Enhanced -0.39 0.23 0.62
- Basic -1.05 2.03 3.08
Past 20d ret
- Enhanced 0.41 -0.51 -0.92
- Basic -0.06 0.05 0.11
data such as financial asset prices if the inputs are
appropriately preprocessed. Second, we illustrate the
potential for deep learning to reduce the need for ex-
tensive feature engineering in an application area (fi-
nancial markets) that has long been of interest to ma-
chine learning researchers. Our model easily accom-
modates returns of di↵erent frequencies as well as non-
return data and produces investment results that ex-
ceed those of most strategies in the vast finance liter-
ature on momentum strategies.
In ongoing work, we are considering additional fea-
tures such as industry and aggregate market returns
as well as non-return data such as firm characteristics
and macroeconomic indicators. An open question as
we expand the number of inputs is whether separate
autoencoders for various categories of features would
perform better than combining all features in a single
autoencoder.
We are also examining the impact of updating the
weights in our network over time. Our current method-
ology, in which we train the model once and then
hold parameters fixed for the entire test period, is
unlikely to be optimal as investor behavior as well
as the institutional framework of the market change
over time. Furthermore, even if the data were station-
ary, we could improve performance by training with
all the available data at each date. An important im-
plementation issue is computational cost, especially as
the number of features and depth of the network in-
crease. We are exploring a parallel implementation of
the learning algorithm that could be run on GPUs.
This approach should lead to a substantial decrease
in training time as the algorithm can take advantage
of parallelization at the data-level (since it uses mini-
batches) as well as at the network layer level. Alter-
natively, a more straightforward approach would be
to retrain the classifier each month, but update the
autoencoder less frequently in order to limit computa-
tional costs.
References
Asness, Cli↵ord, Moskowitz, Tobias, and Pedersen,
Lasse. Value and momentum everywhere. Journal
of Finance, 68:929–985, 2013.
Bengio, Yoshua, Courville, Aaron, and Vincent, Pas-
cal. Representation learning: a review and new per-
spectives. ArXiv e-prints, 2012.
Fama, Eugene and French, Kenneth. Dissecting
anomalies. Journal of Finance, 63:1653–1678, 2008.
Hinton, Geo↵rey. A practical guide to training re-
stricted Boltzmann machines. Technical Report
MTML TR 2010-003, University of Toronto, 2010.
Hinton, Geo↵rey and Salakhutdinov, Ruslan. Reduc-
ing the dimensionality of data with neural networks.
Science, 313:504–507, 2006.
Jegadeesh, Narasimhan. Evidence of predictable be-
havior of security returns. Journal of Finance, 45:
881–898, 1990.
Jegadeesh, Narasimhan and Titman, Sheridan. Re-
turns to buying winners and selling losers: implica-
tions for stock market e ciency. Journal of Finance,
48:65–91, 1993.
Ng, Andrew, Ngiam, Jiquan, Foo, Chuan Yu, Mai,
Yifan, and Suen, Caroline. UFLDL Tutorial,
2013. URL http://ufldl.stanford.edu/wiki/
index.php/UFLDL_Tutorial.

More Related Content

What's hot

Machine learning Algorithms with a Sagemaker demo
Machine learning Algorithms with a Sagemaker demoMachine learning Algorithms with a Sagemaker demo
Machine learning Algorithms with a Sagemaker demoHridyesh Bisht
 
Evolving Reinforcement Learning Algorithms, JD. Co-Reyes et al, 2021
Evolving Reinforcement Learning Algorithms, JD. Co-Reyes et al, 2021Evolving Reinforcement Learning Algorithms, JD. Co-Reyes et al, 2021
Evolving Reinforcement Learning Algorithms, JD. Co-Reyes et al, 2021Chris Ohk
 
Session-Based Recommendations with Recurrent Neural Networks (Balazs Hidasi, ...
Session-Based Recommendations with Recurrent Neural Networks(Balazs Hidasi, ...Session-Based Recommendations with Recurrent Neural Networks(Balazs Hidasi, ...
Session-Based Recommendations with Recurrent Neural Networks (Balazs Hidasi, ...hyunsung lee
 
Algorithms Design Patterns
Algorithms Design PatternsAlgorithms Design Patterns
Algorithms Design PatternsAshwin Shiv
 
PPT - AutoML-Zero: Evolving Machine Learning Algorithms From Scratch
PPT - AutoML-Zero: Evolving Machine Learning Algorithms From ScratchPPT - AutoML-Zero: Evolving Machine Learning Algorithms From Scratch
PPT - AutoML-Zero: Evolving Machine Learning Algorithms From ScratchJisang Yoon
 
Deep Learning in Recommender Systems - RecSys Summer School 2017
Deep Learning in Recommender Systems - RecSys Summer School 2017Deep Learning in Recommender Systems - RecSys Summer School 2017
Deep Learning in Recommender Systems - RecSys Summer School 2017Balázs Hidasi
 
CSA 3702 machine learning module 3
CSA 3702 machine learning module 3CSA 3702 machine learning module 3
CSA 3702 machine learning module 3Nandhini S
 
Neural Learning to Rank
Neural Learning to RankNeural Learning to Rank
Neural Learning to RankBhaskar Mitra
 
Adversarial Reinforced Learning for Unsupervised Domain Adaptation
Adversarial Reinforced Learning for Unsupervised Domain AdaptationAdversarial Reinforced Learning for Unsupervised Domain Adaptation
Adversarial Reinforced Learning for Unsupervised Domain Adaptationtaeseon ryu
 
Dueling Network Architectures for Deep Reinforcement Learning
Dueling Network Architectures for Deep Reinforcement LearningDueling Network Architectures for Deep Reinforcement Learning
Dueling Network Architectures for Deep Reinforcement LearningYoonho Lee
 
Generative Adversarial Networks : Basic architecture and variants
Generative Adversarial Networks : Basic architecture and variantsGenerative Adversarial Networks : Basic architecture and variants
Generative Adversarial Networks : Basic architecture and variantsananth
 
Lecture 6: Convolutional Neural Networks
Lecture 6: Convolutional Neural NetworksLecture 6: Convolutional Neural Networks
Lecture 6: Convolutional Neural NetworksSang Jun Lee
 
Corinna Cortes, Head of Research, Google, at MLconf NYC 2017
Corinna Cortes, Head of Research, Google, at MLconf NYC 2017Corinna Cortes, Head of Research, Google, at MLconf NYC 2017
Corinna Cortes, Head of Research, Google, at MLconf NYC 2017MLconf
 
Deep Learning for Recommender Systems RecSys2017 Tutorial
Deep Learning for Recommender Systems RecSys2017 Tutorial Deep Learning for Recommender Systems RecSys2017 Tutorial
Deep Learning for Recommender Systems RecSys2017 Tutorial Alexandros Karatzoglou
 
Reinforcement Learning and Artificial Neural Nets
Reinforcement Learning and Artificial Neural NetsReinforcement Learning and Artificial Neural Nets
Reinforcement Learning and Artificial Neural NetsPierre de Lacaze
 
08 neural networks
08 neural networks08 neural networks
08 neural networksankit_ppt
 
Grid based method & model based clustering method
Grid based method & model based clustering methodGrid based method & model based clustering method
Grid based method & model based clustering methodrajshreemuthiah
 

What's hot (20)

Itc stock slide
Itc stock slideItc stock slide
Itc stock slide
 
Machine learning Algorithms with a Sagemaker demo
Machine learning Algorithms with a Sagemaker demoMachine learning Algorithms with a Sagemaker demo
Machine learning Algorithms with a Sagemaker demo
 
Evolving Reinforcement Learning Algorithms, JD. Co-Reyes et al, 2021
Evolving Reinforcement Learning Algorithms, JD. Co-Reyes et al, 2021Evolving Reinforcement Learning Algorithms, JD. Co-Reyes et al, 2021
Evolving Reinforcement Learning Algorithms, JD. Co-Reyes et al, 2021
 
Session-Based Recommendations with Recurrent Neural Networks (Balazs Hidasi, ...
Session-Based Recommendations with Recurrent Neural Networks(Balazs Hidasi, ...Session-Based Recommendations with Recurrent Neural Networks(Balazs Hidasi, ...
Session-Based Recommendations with Recurrent Neural Networks (Balazs Hidasi, ...
 
Algorithms Design Patterns
Algorithms Design PatternsAlgorithms Design Patterns
Algorithms Design Patterns
 
PPT - AutoML-Zero: Evolving Machine Learning Algorithms From Scratch
PPT - AutoML-Zero: Evolving Machine Learning Algorithms From ScratchPPT - AutoML-Zero: Evolving Machine Learning Algorithms From Scratch
PPT - AutoML-Zero: Evolving Machine Learning Algorithms From Scratch
 
Deep Learning in Recommender Systems - RecSys Summer School 2017
Deep Learning in Recommender Systems - RecSys Summer School 2017Deep Learning in Recommender Systems - RecSys Summer School 2017
Deep Learning in Recommender Systems - RecSys Summer School 2017
 
CSA 3702 machine learning module 3
CSA 3702 machine learning module 3CSA 3702 machine learning module 3
CSA 3702 machine learning module 3
 
Neural Learning to Rank
Neural Learning to RankNeural Learning to Rank
Neural Learning to Rank
 
Adversarial Reinforced Learning for Unsupervised Domain Adaptation
Adversarial Reinforced Learning for Unsupervised Domain AdaptationAdversarial Reinforced Learning for Unsupervised Domain Adaptation
Adversarial Reinforced Learning for Unsupervised Domain Adaptation
 
Test for AI model
Test for AI modelTest for AI model
Test for AI model
 
Dueling Network Architectures for Deep Reinforcement Learning
Dueling Network Architectures for Deep Reinforcement LearningDueling Network Architectures for Deep Reinforcement Learning
Dueling Network Architectures for Deep Reinforcement Learning
 
Generative Adversarial Networks : Basic architecture and variants
Generative Adversarial Networks : Basic architecture and variantsGenerative Adversarial Networks : Basic architecture and variants
Generative Adversarial Networks : Basic architecture and variants
 
Lecture 6: Convolutional Neural Networks
Lecture 6: Convolutional Neural NetworksLecture 6: Convolutional Neural Networks
Lecture 6: Convolutional Neural Networks
 
Corinna Cortes, Head of Research, Google, at MLconf NYC 2017
Corinna Cortes, Head of Research, Google, at MLconf NYC 2017Corinna Cortes, Head of Research, Google, at MLconf NYC 2017
Corinna Cortes, Head of Research, Google, at MLconf NYC 2017
 
TensorFlow in 3 sentences
TensorFlow in 3 sentencesTensorFlow in 3 sentences
TensorFlow in 3 sentences
 
Deep Learning for Recommender Systems RecSys2017 Tutorial
Deep Learning for Recommender Systems RecSys2017 Tutorial Deep Learning for Recommender Systems RecSys2017 Tutorial
Deep Learning for Recommender Systems RecSys2017 Tutorial
 
Reinforcement Learning and Artificial Neural Nets
Reinforcement Learning and Artificial Neural NetsReinforcement Learning and Artificial Neural Nets
Reinforcement Learning and Artificial Neural Nets
 
08 neural networks
08 neural networks08 neural networks
08 neural networks
 
Grid based method & model based clustering method
Grid based method & model based clustering methodGrid based method & model based clustering method
Grid based method & model based clustering method
 

Similar to Applying Deep Learning to Enhance Momentum Trading

Stock Market Prediction Using Deep Learning
Stock Market Prediction Using Deep LearningStock Market Prediction Using Deep Learning
Stock Market Prediction Using Deep LearningIRJET Journal
 
ITB Term Paper - 10BM60066
ITB Term Paper - 10BM60066ITB Term Paper - 10BM60066
ITB Term Paper - 10BM60066rahulsm27
 
Bitcoin Price Prediction Using LSTM
Bitcoin Price Prediction Using LSTMBitcoin Price Prediction Using LSTM
Bitcoin Price Prediction Using LSTMIRJET Journal
 
ALGEBRAIC DEGREE ESTIMATION OF BLOCK CIPHERS USING RANDOMIZED ALGORITHM; UPPE...
ALGEBRAIC DEGREE ESTIMATION OF BLOCK CIPHERS USING RANDOMIZED ALGORITHM; UPPE...ALGEBRAIC DEGREE ESTIMATION OF BLOCK CIPHERS USING RANDOMIZED ALGORITHM; UPPE...
ALGEBRAIC DEGREE ESTIMATION OF BLOCK CIPHERS USING RANDOMIZED ALGORITHM; UPPE...ijcisjournal
 
Stock market analysis
Stock market analysisStock market analysis
Stock market analysisSruti Jain
 
IRJET- Text based Deep Learning for Stock Prediction
IRJET- Text based Deep Learning for Stock PredictionIRJET- Text based Deep Learning for Stock Prediction
IRJET- Text based Deep Learning for Stock PredictionIRJET Journal
 
Rachit Mishra_stock prediction_report
Rachit Mishra_stock prediction_reportRachit Mishra_stock prediction_report
Rachit Mishra_stock prediction_reportRachit Mishra
 
Integration of a Predictive, Continuous Time Neural Network into Securities M...
Integration of a Predictive, Continuous Time Neural Network into Securities M...Integration of a Predictive, Continuous Time Neural Network into Securities M...
Integration of a Predictive, Continuous Time Neural Network into Securities M...Chris Kirk, PhD, FIAP
 
Application_of_Deep_Learning_Techniques.pptx
Application_of_Deep_Learning_Techniques.pptxApplication_of_Deep_Learning_Techniques.pptx
Application_of_Deep_Learning_Techniques.pptxKiranKumar918931
 
AMAZON STOCK PRICE PREDICTION BY USING SMLT
AMAZON STOCK PRICE PREDICTION BY USING SMLTAMAZON STOCK PRICE PREDICTION BY USING SMLT
AMAZON STOCK PRICE PREDICTION BY USING SMLTIRJET Journal
 
Exploring the Impact of Magnitude- and Direction-based Loss Function on the P...
Exploring the Impact of Magnitude- and Direction-based Loss Function on the P...Exploring the Impact of Magnitude- and Direction-based Loss Function on the P...
Exploring the Impact of Magnitude- and Direction-based Loss Function on the P...Dr. Amarjeet Singh
 
IRJET- Stock Price Prediction using Long Short Term Memory
IRJET-  	  Stock Price Prediction using Long Short Term MemoryIRJET-  	  Stock Price Prediction using Long Short Term Memory
IRJET- Stock Price Prediction using Long Short Term MemoryIRJET Journal
 
Vol 16 No 2 - July-December 2016
Vol 16 No 2 - July-December 2016Vol 16 No 2 - July-December 2016
Vol 16 No 2 - July-December 2016ijcsbi
 
Stock Market Prediction using Long Short-Term Memory
Stock Market Prediction using Long Short-Term MemoryStock Market Prediction using Long Short-Term Memory
Stock Market Prediction using Long Short-Term MemoryIRJET Journal
 
House price prediction
House price predictionHouse price prediction
House price predictionSabahBegum
 
Investment Portfolio Risk Manager using Machine Learning and Deep-Learning.
Investment Portfolio Risk Manager using Machine Learning and Deep-Learning.Investment Portfolio Risk Manager using Machine Learning and Deep-Learning.
Investment Portfolio Risk Manager using Machine Learning and Deep-Learning.IRJET Journal
 
IRJET- Stock Market Prediction using Machine Learning
IRJET- Stock Market Prediction using Machine LearningIRJET- Stock Market Prediction using Machine Learning
IRJET- Stock Market Prediction using Machine LearningIRJET Journal
 
A tutorial on applying artificial neural networks and geometric brownian moti...
A tutorial on applying artificial neural networks and geometric brownian moti...A tutorial on applying artificial neural networks and geometric brownian moti...
A tutorial on applying artificial neural networks and geometric brownian moti...eSAT Journals
 
Stock Price Prediction using Machine Learning Algorithms: ARIMA, LSTM & Linea...
Stock Price Prediction using Machine Learning Algorithms: ARIMA, LSTM & Linea...Stock Price Prediction using Machine Learning Algorithms: ARIMA, LSTM & Linea...
Stock Price Prediction using Machine Learning Algorithms: ARIMA, LSTM & Linea...IRJET Journal
 

Similar to Applying Deep Learning to Enhance Momentum Trading (20)

Stock Market Prediction Using Deep Learning
Stock Market Prediction Using Deep LearningStock Market Prediction Using Deep Learning
Stock Market Prediction Using Deep Learning
 
ITB Term Paper - 10BM60066
ITB Term Paper - 10BM60066ITB Term Paper - 10BM60066
ITB Term Paper - 10BM60066
 
Bitcoin Price Prediction Using LSTM
Bitcoin Price Prediction Using LSTMBitcoin Price Prediction Using LSTM
Bitcoin Price Prediction Using LSTM
 
ALGEBRAIC DEGREE ESTIMATION OF BLOCK CIPHERS USING RANDOMIZED ALGORITHM; UPPE...
ALGEBRAIC DEGREE ESTIMATION OF BLOCK CIPHERS USING RANDOMIZED ALGORITHM; UPPE...ALGEBRAIC DEGREE ESTIMATION OF BLOCK CIPHERS USING RANDOMIZED ALGORITHM; UPPE...
ALGEBRAIC DEGREE ESTIMATION OF BLOCK CIPHERS USING RANDOMIZED ALGORITHM; UPPE...
 
Icbai 2018 ver_1
Icbai 2018 ver_1Icbai 2018 ver_1
Icbai 2018 ver_1
 
Stock market analysis
Stock market analysisStock market analysis
Stock market analysis
 
IRJET- Text based Deep Learning for Stock Prediction
IRJET- Text based Deep Learning for Stock PredictionIRJET- Text based Deep Learning for Stock Prediction
IRJET- Text based Deep Learning for Stock Prediction
 
Rachit Mishra_stock prediction_report
Rachit Mishra_stock prediction_reportRachit Mishra_stock prediction_report
Rachit Mishra_stock prediction_report
 
Integration of a Predictive, Continuous Time Neural Network into Securities M...
Integration of a Predictive, Continuous Time Neural Network into Securities M...Integration of a Predictive, Continuous Time Neural Network into Securities M...
Integration of a Predictive, Continuous Time Neural Network into Securities M...
 
Application_of_Deep_Learning_Techniques.pptx
Application_of_Deep_Learning_Techniques.pptxApplication_of_Deep_Learning_Techniques.pptx
Application_of_Deep_Learning_Techniques.pptx
 
AMAZON STOCK PRICE PREDICTION BY USING SMLT
AMAZON STOCK PRICE PREDICTION BY USING SMLTAMAZON STOCK PRICE PREDICTION BY USING SMLT
AMAZON STOCK PRICE PREDICTION BY USING SMLT
 
Exploring the Impact of Magnitude- and Direction-based Loss Function on the P...
Exploring the Impact of Magnitude- and Direction-based Loss Function on the P...Exploring the Impact of Magnitude- and Direction-based Loss Function on the P...
Exploring the Impact of Magnitude- and Direction-based Loss Function on the P...
 
IRJET- Stock Price Prediction using Long Short Term Memory
IRJET-  	  Stock Price Prediction using Long Short Term MemoryIRJET-  	  Stock Price Prediction using Long Short Term Memory
IRJET- Stock Price Prediction using Long Short Term Memory
 
Vol 16 No 2 - July-December 2016
Vol 16 No 2 - July-December 2016Vol 16 No 2 - July-December 2016
Vol 16 No 2 - July-December 2016
 
Stock Market Prediction using Long Short-Term Memory
Stock Market Prediction using Long Short-Term MemoryStock Market Prediction using Long Short-Term Memory
Stock Market Prediction using Long Short-Term Memory
 
House price prediction
House price predictionHouse price prediction
House price prediction
 
Investment Portfolio Risk Manager using Machine Learning and Deep-Learning.
Investment Portfolio Risk Manager using Machine Learning and Deep-Learning.Investment Portfolio Risk Manager using Machine Learning and Deep-Learning.
Investment Portfolio Risk Manager using Machine Learning and Deep-Learning.
 
IRJET- Stock Market Prediction using Machine Learning
IRJET- Stock Market Prediction using Machine LearningIRJET- Stock Market Prediction using Machine Learning
IRJET- Stock Market Prediction using Machine Learning
 
A tutorial on applying artificial neural networks and geometric brownian moti...
A tutorial on applying artificial neural networks and geometric brownian moti...A tutorial on applying artificial neural networks and geometric brownian moti...
A tutorial on applying artificial neural networks and geometric brownian moti...
 
Stock Price Prediction using Machine Learning Algorithms: ARIMA, LSTM & Linea...
Stock Price Prediction using Machine Learning Algorithms: ARIMA, LSTM & Linea...Stock Price Prediction using Machine Learning Algorithms: ARIMA, LSTM & Linea...
Stock Price Prediction using Machine Learning Algorithms: ARIMA, LSTM & Linea...
 

Recently uploaded

20240417-Calibre-April-2024-Investor-Presentation.pdf
20240417-Calibre-April-2024-Investor-Presentation.pdf20240417-Calibre-April-2024-Investor-Presentation.pdf
20240417-Calibre-April-2024-Investor-Presentation.pdfAdnet Communications
 
Log your LOA pain with Pension Lab's brilliant campaign
Log your LOA pain with Pension Lab's brilliant campaignLog your LOA pain with Pension Lab's brilliant campaign
Log your LOA pain with Pension Lab's brilliant campaignHenry Tapper
 
Quantitative Analysis of Retail Sector Companies
Quantitative Analysis of Retail Sector CompaniesQuantitative Analysis of Retail Sector Companies
Quantitative Analysis of Retail Sector Companiesprashantbhati354
 
New dynamic economic model with a digital footprint | European Business Review
New dynamic economic model with a digital footprint | European Business ReviewNew dynamic economic model with a digital footprint | European Business Review
New dynamic economic model with a digital footprint | European Business ReviewAntonis Zairis
 
(TANVI) Call Girls Nanded City ( 7001035870 ) HI-Fi Pune Escorts Service
(TANVI) Call Girls Nanded City ( 7001035870 ) HI-Fi Pune Escorts Service(TANVI) Call Girls Nanded City ( 7001035870 ) HI-Fi Pune Escorts Service
(TANVI) Call Girls Nanded City ( 7001035870 ) HI-Fi Pune Escorts Serviceranjana rawat
 
VIP Call Girls LB Nagar ( Hyderabad ) Phone 8250192130 | ₹5k To 25k With Room...
VIP Call Girls LB Nagar ( Hyderabad ) Phone 8250192130 | ₹5k To 25k With Room...VIP Call Girls LB Nagar ( Hyderabad ) Phone 8250192130 | ₹5k To 25k With Room...
VIP Call Girls LB Nagar ( Hyderabad ) Phone 8250192130 | ₹5k To 25k With Room...Suhani Kapoor
 
Bladex Earnings Call Presentation 1Q2024
Bladex Earnings Call Presentation 1Q2024Bladex Earnings Call Presentation 1Q2024
Bladex Earnings Call Presentation 1Q2024Bladex
 
Dharavi Russian callg Girls, { 09892124323 } || Call Girl In Mumbai ...
Dharavi Russian callg Girls, { 09892124323 } || Call Girl In Mumbai ...Dharavi Russian callg Girls, { 09892124323 } || Call Girl In Mumbai ...
Dharavi Russian callg Girls, { 09892124323 } || Call Girl In Mumbai ...Pooja Nehwal
 
Call Girls In Yusuf Sarai Women Seeking Men 9654467111
Call Girls In Yusuf Sarai Women Seeking Men 9654467111Call Girls In Yusuf Sarai Women Seeking Men 9654467111
Call Girls In Yusuf Sarai Women Seeking Men 9654467111Sapana Sha
 
Call Girls Service Nagpur Maya Call 7001035870 Meet With Nagpur Escorts
Call Girls Service Nagpur Maya Call 7001035870 Meet With Nagpur EscortsCall Girls Service Nagpur Maya Call 7001035870 Meet With Nagpur Escorts
Call Girls Service Nagpur Maya Call 7001035870 Meet With Nagpur Escortsranjana rawat
 
High Class Call Girls Nashik Maya 7001305949 Independent Escort Service Nashik
High Class Call Girls Nashik Maya 7001305949 Independent Escort Service NashikHigh Class Call Girls Nashik Maya 7001305949 Independent Escort Service Nashik
High Class Call Girls Nashik Maya 7001305949 Independent Escort Service NashikCall Girls in Nagpur High Profile
 
High Class Call Girls Nagpur Grishma Call 7001035870 Meet With Nagpur Escorts
High Class Call Girls Nagpur Grishma Call 7001035870 Meet With Nagpur EscortsHigh Class Call Girls Nagpur Grishma Call 7001035870 Meet With Nagpur Escorts
High Class Call Girls Nagpur Grishma Call 7001035870 Meet With Nagpur Escortsranjana rawat
 
VVIP Pune Call Girls Katraj (7001035870) Pune Escorts Nearby with Complete Sa...
VVIP Pune Call Girls Katraj (7001035870) Pune Escorts Nearby with Complete Sa...VVIP Pune Call Girls Katraj (7001035870) Pune Escorts Nearby with Complete Sa...
VVIP Pune Call Girls Katraj (7001035870) Pune Escorts Nearby with Complete Sa...Call Girls in Nagpur High Profile
 
Vip B Aizawl Call Girls #9907093804 Contact Number Escorts Service Aizawl
Vip B Aizawl Call Girls #9907093804 Contact Number Escorts Service AizawlVip B Aizawl Call Girls #9907093804 Contact Number Escorts Service Aizawl
Vip B Aizawl Call Girls #9907093804 Contact Number Escorts Service Aizawlmakika9823
 
Monthly Market Risk Update: April 2024 [SlideShare]
Monthly Market Risk Update: April 2024 [SlideShare]Monthly Market Risk Update: April 2024 [SlideShare]
Monthly Market Risk Update: April 2024 [SlideShare]Commonwealth
 
VIP Kolkata Call Girl Jodhpur Park 👉 8250192130 Available With Room
VIP Kolkata Call Girl Jodhpur Park 👉 8250192130  Available With RoomVIP Kolkata Call Girl Jodhpur Park 👉 8250192130  Available With Room
VIP Kolkata Call Girl Jodhpur Park 👉 8250192130 Available With Roomdivyansh0kumar0
 
Independent Call Girl Number in Kurla Mumbai📲 Pooja Nehwal 9892124323 💞 Full ...
Independent Call Girl Number in Kurla Mumbai📲 Pooja Nehwal 9892124323 💞 Full ...Independent Call Girl Number in Kurla Mumbai📲 Pooja Nehwal 9892124323 💞 Full ...
Independent Call Girl Number in Kurla Mumbai📲 Pooja Nehwal 9892124323 💞 Full ...Pooja Nehwal
 
How Automation is Driving Efficiency Through the Last Mile of Reporting
How Automation is Driving Efficiency Through the Last Mile of ReportingHow Automation is Driving Efficiency Through the Last Mile of Reporting
How Automation is Driving Efficiency Through the Last Mile of ReportingAggregage
 

Recently uploaded (20)

20240417-Calibre-April-2024-Investor-Presentation.pdf
20240417-Calibre-April-2024-Investor-Presentation.pdf20240417-Calibre-April-2024-Investor-Presentation.pdf
20240417-Calibre-April-2024-Investor-Presentation.pdf
 
Log your LOA pain with Pension Lab's brilliant campaign
Log your LOA pain with Pension Lab's brilliant campaignLog your LOA pain with Pension Lab's brilliant campaign
Log your LOA pain with Pension Lab's brilliant campaign
 
Quantitative Analysis of Retail Sector Companies
Quantitative Analysis of Retail Sector CompaniesQuantitative Analysis of Retail Sector Companies
Quantitative Analysis of Retail Sector Companies
 
New dynamic economic model with a digital footprint | European Business Review
New dynamic economic model with a digital footprint | European Business ReviewNew dynamic economic model with a digital footprint | European Business Review
New dynamic economic model with a digital footprint | European Business Review
 
(TANVI) Call Girls Nanded City ( 7001035870 ) HI-Fi Pune Escorts Service
(TANVI) Call Girls Nanded City ( 7001035870 ) HI-Fi Pune Escorts Service(TANVI) Call Girls Nanded City ( 7001035870 ) HI-Fi Pune Escorts Service
(TANVI) Call Girls Nanded City ( 7001035870 ) HI-Fi Pune Escorts Service
 
VIP Call Girls LB Nagar ( Hyderabad ) Phone 8250192130 | ₹5k To 25k With Room...
VIP Call Girls LB Nagar ( Hyderabad ) Phone 8250192130 | ₹5k To 25k With Room...VIP Call Girls LB Nagar ( Hyderabad ) Phone 8250192130 | ₹5k To 25k With Room...
VIP Call Girls LB Nagar ( Hyderabad ) Phone 8250192130 | ₹5k To 25k With Room...
 
Bladex Earnings Call Presentation 1Q2024
Bladex Earnings Call Presentation 1Q2024Bladex Earnings Call Presentation 1Q2024
Bladex Earnings Call Presentation 1Q2024
 
Dharavi Russian callg Girls, { 09892124323 } || Call Girl In Mumbai ...
Dharavi Russian callg Girls, { 09892124323 } || Call Girl In Mumbai ...Dharavi Russian callg Girls, { 09892124323 } || Call Girl In Mumbai ...
Dharavi Russian callg Girls, { 09892124323 } || Call Girl In Mumbai ...
 
Call Girls In Yusuf Sarai Women Seeking Men 9654467111
Call Girls In Yusuf Sarai Women Seeking Men 9654467111Call Girls In Yusuf Sarai Women Seeking Men 9654467111
Call Girls In Yusuf Sarai Women Seeking Men 9654467111
 
Call Girls Service Nagpur Maya Call 7001035870 Meet With Nagpur Escorts
Call Girls Service Nagpur Maya Call 7001035870 Meet With Nagpur EscortsCall Girls Service Nagpur Maya Call 7001035870 Meet With Nagpur Escorts
Call Girls Service Nagpur Maya Call 7001035870 Meet With Nagpur Escorts
 
High Class Call Girls Nashik Maya 7001305949 Independent Escort Service Nashik
High Class Call Girls Nashik Maya 7001305949 Independent Escort Service NashikHigh Class Call Girls Nashik Maya 7001305949 Independent Escort Service Nashik
High Class Call Girls Nashik Maya 7001305949 Independent Escort Service Nashik
 
Commercial Bank Economic Capsule - April 2024
Commercial Bank Economic Capsule - April 2024Commercial Bank Economic Capsule - April 2024
Commercial Bank Economic Capsule - April 2024
 
🔝+919953056974 🔝young Delhi Escort service Pusa Road
🔝+919953056974 🔝young Delhi Escort service Pusa Road🔝+919953056974 🔝young Delhi Escort service Pusa Road
🔝+919953056974 🔝young Delhi Escort service Pusa Road
 
High Class Call Girls Nagpur Grishma Call 7001035870 Meet With Nagpur Escorts
High Class Call Girls Nagpur Grishma Call 7001035870 Meet With Nagpur EscortsHigh Class Call Girls Nagpur Grishma Call 7001035870 Meet With Nagpur Escorts
High Class Call Girls Nagpur Grishma Call 7001035870 Meet With Nagpur Escorts
 
VVIP Pune Call Girls Katraj (7001035870) Pune Escorts Nearby with Complete Sa...
VVIP Pune Call Girls Katraj (7001035870) Pune Escorts Nearby with Complete Sa...VVIP Pune Call Girls Katraj (7001035870) Pune Escorts Nearby with Complete Sa...
VVIP Pune Call Girls Katraj (7001035870) Pune Escorts Nearby with Complete Sa...
 
Vip B Aizawl Call Girls #9907093804 Contact Number Escorts Service Aizawl
Vip B Aizawl Call Girls #9907093804 Contact Number Escorts Service AizawlVip B Aizawl Call Girls #9907093804 Contact Number Escorts Service Aizawl
Vip B Aizawl Call Girls #9907093804 Contact Number Escorts Service Aizawl
 
Monthly Market Risk Update: April 2024 [SlideShare]
Monthly Market Risk Update: April 2024 [SlideShare]Monthly Market Risk Update: April 2024 [SlideShare]
Monthly Market Risk Update: April 2024 [SlideShare]
 
VIP Kolkata Call Girl Jodhpur Park 👉 8250192130 Available With Room
VIP Kolkata Call Girl Jodhpur Park 👉 8250192130  Available With RoomVIP Kolkata Call Girl Jodhpur Park 👉 8250192130  Available With Room
VIP Kolkata Call Girl Jodhpur Park 👉 8250192130 Available With Room
 
Independent Call Girl Number in Kurla Mumbai📲 Pooja Nehwal 9892124323 💞 Full ...
Independent Call Girl Number in Kurla Mumbai📲 Pooja Nehwal 9892124323 💞 Full ...Independent Call Girl Number in Kurla Mumbai📲 Pooja Nehwal 9892124323 💞 Full ...
Independent Call Girl Number in Kurla Mumbai📲 Pooja Nehwal 9892124323 💞 Full ...
 
How Automation is Driving Efficiency Through the Last Mile of Reporting
How Automation is Driving Efficiency Through the Last Mile of ReportingHow Automation is Driving Efficiency Through the Last Mile of Reporting
How Automation is Driving Efficiency Through the Last Mile of Reporting
 

Applying Deep Learning to Enhance Momentum Trading

  • 1. This version: December 12, 2013 Applying Deep Learning to Enhance Momentum Trading Strategies in Stocks Lawrence Takeuchi * ltakeuch@stanford.edu Yu-Ying (Albert) Lee yy.albert.lee@gmail.com Abstract We use an autoencoder composed of stacked restricted Boltzmann machines to extract features from the history of individual stock prices. Our model is able to discover an en- hanced version of the momentum e↵ect in stocks without extensive hand-engineering of input features and deliver an annualized re- turn of 45.93% over the 1990-2009 test period versus 10.53% for basic momentum. 1. Introduction Price momentum is the empirical finding (Jegadeesh & Titman, 1993) that stocks with high past returns over 3-to-12 months (winners) continue to perform well over the next few months relative to stocks with low past returns (losers). Subsequent studies find that this mo- mentum e↵ect continues to remain robust in the US after becoming widely known and applies to interna- tional stocks as well as other asset classes including for- eign exchange, commodities, and bonds (Asness et al., 2013). For finance academics the fact that a simple strategy of buying winners and selling losers can ap- parently be profitable challenges the notion that mar- kets quickly incorporate available information into as- set prices. Indeed, Fama and French (2008) describe momentum as the “premier anomaly” in stock returns. The momentum trading strategy, along with its many refinements, is largely the product of a vast, ongoing e↵ort by finance academics and practitioners to hand- engineer features from historical stock prices. Recent advances in deep learning hold the promise of allowing machine learning algorithms to extract discriminative information from data without such labor-intensive feature engineering and have been successfully applied to fields such as speech recognition, image recognition, *Corresponding author. and natural language processing (Bengio et al., 2012). In this paper we examine whether deep learning tech- niques can discover features in the time series of stock prices that can successfully predict future returns. The objective is a challenging one. While most research in deep learning considers tasks that are easy for humans to accomplish, predicting stock returns using publicly available information is notoriously di cult even for professional investors given the high level of noise in stock price movements. Furthermore, any patterns that exist are subject to change as investors themselves learn over time and compete for trading profits. Considering the pervasive use of historical price charts by investors and noting that the primary mode of anal- ysis is visual, we take an approach similar to that used by Hinton and Salakhutdinov (2006) to classify hand- written digits. In particular, we use an autoencoder composed of stacked restricted Boltzmann machines (RBMs) to extract features from stock prices, which we then pass to a feedforward neural network (FFNN) classifier. 2. Data We obtain data on individual US stocks from the Cen- ter for Research in Security Prices. 2.1. Sample selection We restrict our analysis to ordinary shares trading on NYSE, AMEX, or Nasdaq. To mitigate the impact of any market microstructure-related noise, we exclude stocks with monthly closing prices below $5 per share at the time of portfolio formation. This step also re- duces the number of examples with extreme returns. The training set covers the period from January 1965 to December 1989, which coincides with the period ex- amined by Jegadeesh and Titman (1993), and contains 848,000 stock/month examples. The test set covers the period from January 1990 to December 2009 and contains 924,300 stock/month examples. On average
  • 2. Applying Deep Learning to Enhance Momentum Trading Strategies in Stocks there are 3,282 stocks in the sample each month. 2.2. Input variables and preprocessing We want to provide our model with information that would be available from the historical price chart for each stock and let it extract useful features without the need for extensive feature engineering. For every month t, we use the 12 monthly returns for month t 2 through t 13 and the 20 daily returns approximately corresponding to month t.1 We also use an indicator variable if the holding period, month t + 1, falls in January.2 Thus we have a total of 33 input variables for each stock/month example. Next we compute a series of 12 cumulative returns using the monthly returns and 20 cumulative returns using the the daily returns. We note that price mo- mentum is a cross-sectional phenomenon with winners having high past returns and losers having low past re- turns relative to other stocks. Thus we normalize each of the cumulative returns by calculating the z-score rel- ative to the cross-section of all stocks for each month or day. Figure 1 illustrates preprocessing pipeline us- ing the 12 monthly returns for one example in the test set. Finally we use returns over the subsequent month, t + 1, to label the examples with returns below the median as belonging to class 1 and those with returns above the median to class 2. Figure 1. Preprocessing of inputs 1 We choose these inputs given the casual observation that investors tend to use higher frequency prices when viewing charts covering shorter windows of time. 2 Turn-of-the-year patterns in stock returns were well- known prior to Jegadeesh and Titman (1993). In any case, using dummy variables for each calendar month gives sim- ilar results. 3. Deep Learning Model 3.1. Model and learning algorithm We follow an approach similar to that introduced by Hinton and Salakhutdinov (2006) to train networks with multiple hidden layers. Our model consists of a stack of RBMs, which unlike full Boltzmann machines have no intra-layer connections. Each RBM consists of one layer of visible units (the inputs) and one layer of hidden units connected by symmetric links. The output of each RBM serves as the input to the next RBM in the stack. We train the encoder network (see Figure 2) layer by layer in a pretraining step. Following Hinton (2010), we split the dataset into smaller, non-overlapping mini-batches. The RBMs in the encoder are then un- rolled to form an encoder-decoder, which is fine tuned using backpropagation. In our implementation, the number of hidden units in the final layer of the encoder is sharply reduced, which forces a reduction in dimen- sionality. As described below, however, the size of this bottleneck layer is an outcome of the optimization pro- cedure we use to specify the network dimensions rather than an explicit design choice.3 At this stage, the encoder outputs a low dimensional representation of the inputs. The intention is that it retains interesting features from the historical stock chart that are useful for forecasting returns, but elim- inates irrelevant noise. We use the weights estimated thus far to initialize the corresponding weights in the full network, which is composed of the encoder and a FFNN classifier. The final step is to train the entire network using the labeled examples via backpropaga- tion.4 3.2. Network specification We use hold-out cross validation to determine the number of layers and number of units per layer in our network. In particular, we further divide the train- ing set into two subsets covering 1965-1982 and 1983- 1989, respectively. Each model specification is trained on the first subset and then tested on the second. We choose this approach over k-fold cross validation since we have a su ciently large dataset and more impor- tantly want to avoid the look-ahead bias that could arise from training the model with data not available at a given historical date. 3 Hinton and Salakhutdinov (2006), by contrast, omit an explicit bottleneck layer in their digit classification example and use a 784-500-500-2000-10 network. 4 See Ng et al. (2013) for a tutorial on training deep networks.
  • 3. Applying Deep Learning to Enhance Momentum Trading Strategies in Stocks Figure 2. Network Architecture To keep the task manageable, we fix the number of units in the penultimate hidden layer at 50.5 Thus, our first set of candidate specifications is 33 s2 50 2 and the second is 33 s2 s3 50 2 where sl de- notes the number of units in layer l. A grid search over the number of units using our hold-out cross val- idation scheme finds that s2 = 40 and s3 = 4 give the lowest classification error. The next set of candi- date specifications is 33 s2 s3 s4 50 2. Given the large number of dimensions, we use s2 = 40 and s4 = 4 and only search over s3. We find that adding another layer does not reduce the classification error.6 Thus our final specification is the five-layer network 33 40 4 50 2 consisting of an encoder that takes 33 inputs and reduces them to a 4 dimensional code and a classifier that takes these 4 inputs and outputs the probabilities for the two classes. While the ap- proach taken is admittedly heuristic, we believe that it provides a disciplined method to specify a base case model. 4. Results We train our model using the examples from 1965-1989 and test it using those from 1990-2009. In this section we keep both the network configuration and weights fixed, but discuss later how these could be updated over time. 5 However, once we determine the specification of the stacked autoencoders we verify that this is a reasonable choice. 6 Our ongoing work suggests that additional layers may be useful when the number of features are increased. Table 1. Confusion Matrix Predicted 1 2 Actual 1 22.38% 27.45% 2 19.19% 30.97% 4.1. Classification performance Table 1 summarizes the results in a confusion matrix with the entries scaled by the total number of test examples. The model achieves an overall accuracy rate of 53.36%. The model is correct 53.84% of the time when it predicts class 1 and a somewhat lower 53.01% of the time when it predicts class 2. These probabilities alone, however, do not provide a complete picture of the model’s performance since in- vestors actually care more about returns in their objec- tive function. In particular, we would like to compare the realized returns for the stocks predicted to be in class 1 against those for stocks predicted to be in class 2. Pooling all months in the test set, the average one- month holding period return is 0.11% for stocks pre- dicted to be in class 1 and 1.50% for those predicted to be in class 2, or a di↵erence of 1.39%. Alternatively, we can use past 12 month returns (from month t 13 to t 2) and predict that examples with past returns below the median will be in class 1 and those above the median in class 2. This basic momentum strategy produces an average holding period return of 0.64% for stocks in class 1 and 1.20% for those in class 2, or a di↵erence of 0.55%. 4.2. Information content of class probabilities While these results appear promising, we have used only a portion of the information produced by the model. Figure 3 shows the relation between the es- timated probability of being in class 2 according to the model versus the holding period return that is ac- tually realized for the test set, where we use a Gaus- sian kernel regression to smooth the curve. We see an increasing relation indicating that a higher class 2 probability leads to higher realized returns on average. Since there is no requirement to hold every stock, an investor could clearly do better if he bought and sold stocks in the tails of the distribution rather than using the 50% threshold to form long and short portfolios. We rank all stocks each month by their class 2 proba- bilities and buy those in the top decile and sell those in the bottom decile. Next month we close out these posi- tions and form new long and short portfolios. Repeat-
  • 4. Applying Deep Learning to Enhance Momentum Trading Strategies in Stocks 0.20 0.25 0.30 0.35 0.40 0.45 0.50 0.55 0.60 0.65 −0.025 −0.020 −0.015 −0.010 −0.005 0 0.005 0.010 0.015 0.020 CLASS 2 PROBABILITY HOLDINGPERIODRETURN Figure 3. Holding period returns by class 2 probability Table 2. Average monthly momentum returns, 1990-2009. Strategy Decile 1 Decile 10 10 - 1 Enhanced -1.02% 2.33% 3.35% t-statistic -2.05 7.75 9.26 Basic 0.25% 1.35% 1.10% t-statistic 0.47 2.76 2.39 ing this process over the test set generates a monthly time series of investment returns. For comparison we also perform this analysis using past 12 month returns to form deciles. Table 2 presents the average returns for these two strategies, which we call enhanced and basic momentum, respectively. The enhanced strategy generates an average monthly return of 3.35% with a t-statistic of 9.26. In contrast, the basic strategy pro- duces a more modest, but still statistically significant, 1.10% per month.7 On an annualized basis, the returns from our model are a very impressive 45.93% versus 10.53% for basic momentum. Figure 4 shows the growth, on a logarith- mic scale, of $1 invested in each of the enhanced and basic strategies from 1990 to 2009. Ending wealth, be- fore considering implementation costs, is $7.41 for the basic strategy and $1,919, or 259 times higher, for the enhanced strategy. 4.3. Source of investment returns We now show that the enhanced strategy is, in fact, a momentum strategy in the sense that the decile 10 stocks have higher past 12 month returns than the decile 1 stocks. Table 3 shows the past 12 month (month t 13 to t 2) and past 20 day (month t) re- turns expressed as z-scores for the enhanced and basic 7 These returns are calculated as the arithmetic mean of the time series of monthly returns. 89 90 91 92 93 94 95 96 97 98 99 00 01 02 03 04 05 06 07 08 09 10 10 0 10 1 10 2 10 3 10 4 CumulativeWealth Enhanced strategy Basic strategy Figure 4. Log Growth in Cumulative Wealth strategies. We focus on these two features since they are highlighted in the finance literature (Jegadeesh & Titman, 1993) as being potential predictors of stock re- turns. By construction, the basic momentum strategy takes very extreme positions based on past 12 month returns with a 10 1 spread in this feature of more than 3 standard deviations. The enhanced strategy has a 10 1 spread of 0.62 showing that it is also making a bet based on past 12 month returns, but in a less ex- treme way than basic strategy. The lower half of the table shows that the enhanced strategy buys stocks that have had poor recent returns and sells those with high recent returns, consistent with the short-term re- versal e↵ect (Jegadeesh, 1990). The basic momentum strategy, however, has similar past 20 day returns in deciles 1 and 10. While we highlight these two features, we emphasize that the model is likely picking up other more subtle patterns in the historical price chart that are less in- tuitive to interpret. Table 3 shows that the enhanced strategy does not take overly extreme positions based on past 12 month and past 20 day returns as would be the case if we double sort on these features to form portfolios as is common practice in finance studies. We regard this finding, together with the size of the in- vestment returns, as encouraging for deep learning as it suggests that our model is not merely rediscovering known patterns in stock prices, but going beyond what humans have been able to achieve. 5. Discussion and Further Work This study represents one of the first, as far as we are aware, applications of deep learning to stock trading and makes two main contributions to the applied ma- chine learning literature. First, we show that stacked autoencoders constructed from RBMs can extract use- ful features even from low signal-to-noise time series
  • 5. Applying Deep Learning to Enhance Momentum Trading Strategies in Stocks Table 3. Stock characteristics by strategy. Decile 1 Decile 10 10 - 1 Past 12m ret - Enhanced -0.39 0.23 0.62 - Basic -1.05 2.03 3.08 Past 20d ret - Enhanced 0.41 -0.51 -0.92 - Basic -0.06 0.05 0.11 data such as financial asset prices if the inputs are appropriately preprocessed. Second, we illustrate the potential for deep learning to reduce the need for ex- tensive feature engineering in an application area (fi- nancial markets) that has long been of interest to ma- chine learning researchers. Our model easily accom- modates returns of di↵erent frequencies as well as non- return data and produces investment results that ex- ceed those of most strategies in the vast finance liter- ature on momentum strategies. In ongoing work, we are considering additional fea- tures such as industry and aggregate market returns as well as non-return data such as firm characteristics and macroeconomic indicators. An open question as we expand the number of inputs is whether separate autoencoders for various categories of features would perform better than combining all features in a single autoencoder. We are also examining the impact of updating the weights in our network over time. Our current method- ology, in which we train the model once and then hold parameters fixed for the entire test period, is unlikely to be optimal as investor behavior as well as the institutional framework of the market change over time. Furthermore, even if the data were station- ary, we could improve performance by training with all the available data at each date. An important im- plementation issue is computational cost, especially as the number of features and depth of the network in- crease. We are exploring a parallel implementation of the learning algorithm that could be run on GPUs. This approach should lead to a substantial decrease in training time as the algorithm can take advantage of parallelization at the data-level (since it uses mini- batches) as well as at the network layer level. Alter- natively, a more straightforward approach would be to retrain the classifier each month, but update the autoencoder less frequently in order to limit computa- tional costs. References Asness, Cli↵ord, Moskowitz, Tobias, and Pedersen, Lasse. Value and momentum everywhere. Journal of Finance, 68:929–985, 2013. Bengio, Yoshua, Courville, Aaron, and Vincent, Pas- cal. Representation learning: a review and new per- spectives. ArXiv e-prints, 2012. Fama, Eugene and French, Kenneth. Dissecting anomalies. Journal of Finance, 63:1653–1678, 2008. Hinton, Geo↵rey. A practical guide to training re- stricted Boltzmann machines. Technical Report MTML TR 2010-003, University of Toronto, 2010. Hinton, Geo↵rey and Salakhutdinov, Ruslan. Reduc- ing the dimensionality of data with neural networks. Science, 313:504–507, 2006. Jegadeesh, Narasimhan. Evidence of predictable be- havior of security returns. Journal of Finance, 45: 881–898, 1990. Jegadeesh, Narasimhan and Titman, Sheridan. Re- turns to buying winners and selling losers: implica- tions for stock market e ciency. Journal of Finance, 48:65–91, 1993. Ng, Andrew, Ngiam, Jiquan, Foo, Chuan Yu, Mai, Yifan, and Suen, Caroline. UFLDL Tutorial, 2013. URL http://ufldl.stanford.edu/wiki/ index.php/UFLDL_Tutorial.