1. Result
Conclusion
Method
Introduction
Avay Risal
*
, Kyoung Jae Lim
*
, Jonggun Kim
**
Dept. of Regional Infrastructures Engineering, Kangwon National University*
Institute of Agriculture and life Science, Kangwon National University**
Web based WERM_S module development for estimation
of spatially distributed USLE R Factor using RADAR
rainfall data in Jaun watershed of South Korea
WERM_S module is a very effective tool to automatically calculate the spatially
distributed R factors from 10 minute interval RADAR rainfall data in the form of asci
files.
Spatial R factor values are suggested to be used over mean monthly R factor values
The values of monthly and event based R factor as well as maximum 30 minutes
intensity presented in this research are based on the assumption that the raw input data
from RADAR are correct and require no correction before application.
Despite the development of new technologies, soil erosion modelling is still a very
complicated process since they vary considerably over space and time
Universal Soil Loss Equation is one of the oldest and popular model being used worldwide
and R factor is one of the six input parameters which accounts effect of rainfall in soil
erosion
Rain gauge data are being used for R factor calculation which is just representative value for
entire area but in actual R factor varies spatially thus we need to compute R factor of each
small area from spatial rainfall data.
The Jaun watershed was selected as a study
area to test WERM_S
The watershed is vulnerable to soil erosion
The RADAR rainfall data was available for the
area
Gauge rainfall data of three nearby weather stations
from Study Area
The 10 minute interval rain gauge data obtained
from KMA
WERM( Risal et al.,2016) used to obtain monthly and
event based R factor
Developer
Enterprise Electronics
Corporation (EEC), Enterpr
ise, Alabama
Signal Processor EDRP-9
Software tool EDGE 5.2.0-5
PRF(HZ) 322-1,282
long 250-550
Peak power 850kw
Transmission type Klystron
Frequency S Band
Beam width 1.0°
Antenna Gain 45dB
Station name Gwanak San
longitude(°E) 126°57'49.46"
latitude(°N) 37°26'39.42"
elevation(m) 580
Total number of observations 13
Observation angles(°)
0.0, 0.4, 0.8, 1.2, 1.6
2.0, 3.0, 4.2, 5.7
7.5, 9.8, 12.5, 15.8
Maximum scan speed 36°/s
Operation scan speed 15°/s
Time interval(Minute) 10
Station Latitude Longitude
July August
Monthly
precipitation
(mm)
Maximum 30
minute intensity
(mm/hr)
Monthly
precipitation
(mm)
Maximum 30
minute intensity
(mm/hr)
Hongcheon 37.68 127.88 198.5 31 114.5 59
Inje 38.05 128.16 235 32 118 42
Daegwallyeong 37.68 128.76 133 23 309 49
Jaun(RADAR) 39.70 128.40 303 35 239 31
Rainfall data
Source
July August
Max I30
(mm/hr)
R factor
(MJ.mm/ha/hr/
month)
Max I30
(mm/hr)
R factor
(MJ.mm/ha/hr/mo
nth)
RADAR
rainfall
35 648 31 432
Individual
Pixel
(cell-223)
118 4382 77 2257
Individual
Pixel
(cell-136)
28 599 91 6093
Individual
Pixel
(cell-422)
24 96.55 0 0
Individual
Pixel
(cell-412)
0 0 29 119
Objectivesof Study
Develop and test Web Erosivity Module- Spatial( WERM_S) to calculate spatial R factor
(500× 500 m resolution) using RADAR rainfall
Analyze R factor values derived from RADAR rainfall and raingauge rainfall of nearest
three weather stations
StudyArea
RADARrainfalldata
Background
RADAR installed in Gwanak Mountain(580 m amsl), Gyeonggi-do , South Korea
One of the 11 KMA network S band polarization RADAR
Raingaugedata
RfactorFormula
Comparisonof RADARrainfalldataversusraingaugedataof nearbystations
WERM_S module
The module takes the bulk of 10 minute interval
spatial RADAR ASCII files as input data
Consists 3 different modules inside namely Convert
module, R factor Calculation Module and R factor
ASCII module
The web module is free of access to public users
through given url: http://www.envsys.co.kr/~werm_s/
R =
𝟏
𝒏
𝒋=𝟏
𝒏
𝒌=𝟏
𝒎
(𝑬) ∙ (𝑰 𝟑𝟎) 𝒌
E =
𝒌=𝟏
𝒎
𝒆𝒌 ∙ 𝒅𝒌
𝒆𝒌 = 𝟎. 𝟏𝟏𝟗 + 𝟎. 𝟎𝟖𝟕𝟑 ∙ log 𝟏𝟎 𝒊𝒌
𝑛 = numbers of years
𝑚 = number of rainfall events
𝐸 = total storm kinetic energy
𝐼30= maximum of 30 min intensity
Where,
𝑒 𝑘= unit energy
𝑑𝑘 = amount of rainfall in k event
𝑖 𝑘 = rainfall intensity of each time
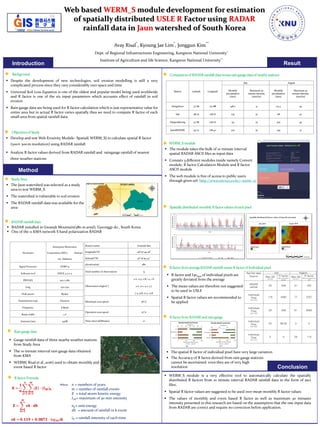
Spatiallydistributed monthlyRfactorvaluesofeachpixel
RfactorfromaverageRADARrainfallversusRfactorof Individual pixel
R factor and I30max of individual pixels are
greatly deviated from the average
The mean values are therefore not suggested
to be used in USLE
Spatial R factor values are recommended to
be applied
RfactorfromRADARandraingauge
The spatial R factor of individual pixel have very large variation
The Accuracy of R factor derived from rain gauge stations
cannot be ascertained even they are of very high
resolution