1. UNDERGRADUATE THESIS OPEN DAY, SESSION 2 2013
Energy Efficiency in Commercial
Buildings
RUSHIL CHHIBBER
A. Prof. Alistair Sproul; Gary Whatling
SCHOOL OF PHOTOVOLTAIC AND RENEWABLE ENERGY ENGINEERING, UNSW, SYDNEY 2052 AUSTRALIA
1. Introduction
Improving energy efficiency of commercial buildings in Australia is a huge task for
the commercial property industry. A large proportion of commercial properties in the
Australian state capitals and commercial business districts were constructed in the
1980’s and are now due for a significant engineering refit as plant and equipment
nears end of life cycle.
Retrofits provide opportunities for major gains in energy efficiency and reductions in
Greenhouse Gas emissions. They have relatively low costs and higher approval
rates and are accepted as one of the main methods for attaining sustainability in
the built environment.
2. Aim
To perform retrofits and system upgrades in an existing commercial office building
in Sydney, reduce its energy and water consumption and increase its NABERS
Energy and NABERS Water ratings.
3. Method
1) A building based in Sydney’s Central Business District was selected, with a
NABERS Energy rating of 2.5 stars. It is relatively old (constructed in 1979)
and consists of an energy sub-metering system.
2) The building’s current energy use characteristics were used for
analysis, comparison and normalisation. Systems with poor performance
and high energy intensity were identified.
3) Retrofit and upgrade options that promote energy conservation and
sustainability were selected and implemented.
4) A model was developed to calculate the new energy and water consumption
values, and the new NABERS ratings.
(20,000)
-
20,000
40,000
60,000
80,000
100,000
120,000
140,000
160,000
Jan Feb Mar Apr May Jun Jul Aug Sep Oct Nov Dec Jan Feb Mar Apr May Jun Jul Aug Sep Oct Nov Dec Jan Feb Mar Apr May Jun
2010 2011 2012
kWh
Site - Energy Consumption
Sum of Total Heat
Sum of Total Pumps
Sum of Total Transport
Sum of Total AC Fans
Sum of Total AC Cool
Sum of Total AC Heat
Sum of Total Non-Std LP
Sum of Total Std LP
Values
Year Month
Sum of Total Std LP Sum of Total Non-Std LP Sum of Total AC Heat Sum of Total AC Cool Sum of Total AC Fans Sum of Total Transport Sum of Total Pumps Sum of Total Heat
Rolling 12mths
0
20,000
40,000
60,000
80,000
100,000
120,000
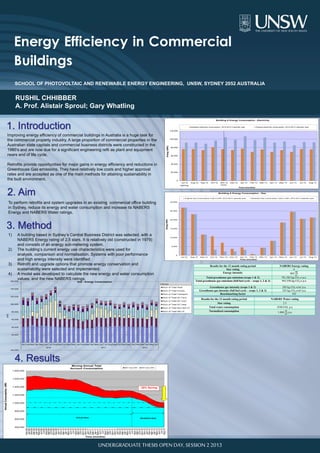
Jul-12 Aug-12 Sep-12 Oct-12 Nov-12 Dec-12 Jan-13 Feb-13 Mar-13 Apr-13 May-13 Jun-13 Jul-13 Aug-13
Energy(kWh)
Time (months)
Building A Energy Consumption - Electricity
Modelled electricity consumption, 2012-2013 Calender year Original electricity consumption, 2012-2013 Calender year
Lighting HVAC
4. Results
0
5,000
10,000
15,000
20,000
25,000
30,000
Jul-12 Aug-12 Sep-12 Oct-12 Nov-12 Dec-12 Jan-13 Feb-13 Mar-13 Apr-13 May-13 Jun-13 Jul-13 Aug-13
Energy(kWh)
Time (months)
Building A Energy Consumption - Gas
Original Gas Consumption Total in kWh, 2012-2013 calender year Modelled Gas Consumption Total in kWh, 2012-2013 calender year
400,000
600,000
800,000
1,000,000
1,200,000
1,400,000
1,600,000
1,800,000
Dec-08
Jan-09
Feb-09
Mar-09
Apr-09
May-09
Jun-09
Jul-09
Aug-09
Sep-09
Oct-09
Nov-09
Dec-09
Jan-10
Feb-10
Mar-10
Apr-10
May-10
Jun-10
Jul-10
Aug-10
Sep-10
Oct-10
Nov-10
Dec-10
Jan-11
Feb-11
Mar-11
Apr-11
May-11
Jun-11
Jul-11
Aug-11
Sep-11
Oct-11
Nov-11
Dec-11
Jan-12
Feb-12
Mar-12
Apr-12
May-12
Jun-12
Jul-12
Aug-12
Sep-12
Oct-12
Nov-12
Dec-12
Jan-13
Feb-13
Mar-13
Apr-13
May-13
Jun-13
Jul-13
Aug-13
AnnualConsumption,kWh
Time (months)
Moving Annual Total
Account Consumption MAT Gas kWh MAT Elec kWh
28% Saving
Actual data Modelled data
Jun Jul Aug Sep Oct Nov Dec Jan Feb Mar Apr May Jun Jul Aug Sep Oct Nov Dec Jan Feb Mar Apr May Jun
2010 2011 2012
Site - Energy Consumption
Sum of Total Heat
Sum of Total Pumps
Sum of Total Transport
Sum of Total AC Fans
Sum of Total AC Cool
Sum of Total AC Heat
Sum of Total Non-Std LP
Sum of Total Std LP
Values
LP Sum of Total AC Heat Sum of Total AC Cool Sum of Total AC Fans Sum of Total Transport Sum of Total Pumps Sum of Total Heat
Results for the 12 month rating period NABERS Energy rating
Star rating 4
Energy intensity 865
MJ
m
2
Total greenhouse gas emissions (scope 1 & 2) 781,582 kg CO2-e p.a.
Total greenhouse gas emissions (full fuel cycle – scope 1, 2 & 3) 943,550 kg CO2-e p.a
Greenhouse gas intensity (scope 1 & 2) 203 kg CO2-e/m2 p.a
Greenhouse gas intensity (full fuel cycle – scope 1, 2 & 3) 245 kg CO2-e/m2 p.a
Benchmarking factor 183
Results for the 12 month rating period NABERS Water rating
Star rating 2.5
Total water consumption 4108.0 kL p.a
Normalised consumption 1.068
kL
m2 p.a