Influence of chimney effect on the radon effective dose of the lung simulated...
Trajectoriesposter
1. The Impact of Non-Local Ammonia on Submicron Particulate
Matter and Visibility Degradation in Urban Shanghai
Roeland
Jansen,
Jianmin
Chen,
Yunjie
Hu
Department
of
Environmental
Science
&
Engineering,
Fudan
University,
Shanghai
200433,
China
Abstract
To
study
the
role
of
submicron
parHculate
maIer
on
visibility
degradaHon
in
urban
Shanghai,
mass
concentraHons
of
PM1,
secondary
inorganic
aerosol
(SIA)
in
PM1
and
mixing
raHos
of
SIA
precursor
gasses
were
on-‐line
monitored
during
a
4-‐week
intensive
campaign
in
December
2012.
During
the
4
weeks
of
measurements,
8
haze
periods
were
idenHfied
when
on
average
PM1
mass
increased
to
62.1±25.6
μg/m3
compared
to
30.7±17.1
μg/m3
during
clear
weather
periods.
The
sum
of
SIA
in
PM1
roughly
doubled
in
mass
concentraHon
during
the
haze
from
14.9±7.4
μg/m3
during
clear
periods
to
29.7±10.7
μg/m3
during
the
haze
periods.
CorrelaHon
coefficients
(R2)
of
the
visibility
as
funcHon
of
mass
concentraHons
of
SIA
species
in
PM1
show
negaHve
exponenHal
relaHons
implying
the
importance
of
the
SIA
species
in
visibility
reducHon.
The
important
role
of
ammonia
in
SIA
formaHon
is
recognized
and
demonstrated.
During
all
periods
ammonium
neutralizes
sulfate
and
nitrate
and
the
molar
equivalent
raHo
of
ammonium
vs.
the
sum
of
sulfate
and
nitrate
increases
during
the
haze
episodes
indicaHng
more
ammonium
is
bound
to
other
species
than
sulfate
and
nitrate
during
the
haze
compared
to
clear
weather.
Air
mass
backward
trajectories
introducing
the
haze
periods
are
studied
to
see
the
impact
of
non-‐local
air
pollutants
on
visibility
degradaHon.
Air
masses
arrived
Shanghai
passing
over
nearby
ammonia
rich
areas
where
the
air
masses
are
likely
enriched
with
ammonia
before
they
reach
urban
Shanghai.
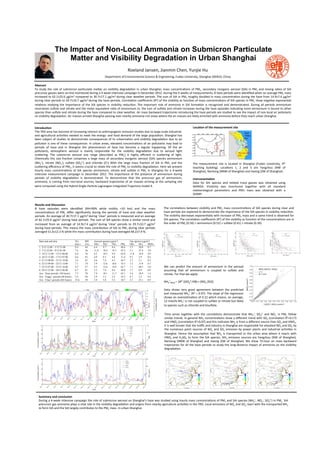
Loca+on
of
the
measurement
site
The
measurement
site
is
located
in
Shanghai
(Fudan
University,
4th
teaching
building).
LocaHons
1,
2
and
3
are
Yangzhou
(NW
of
Shanghai),
Nantong
(NNW
of
Shanghai)
and
Jiaxing
(SW
of
Shanghai).
Introduc+on
The
YRD
area
has
become
of
increasing
interest
to
anthropogenic
emission
studies
due
to
large-‐scale
industrial-‐
and
agricultural
acHviHes
needed
to
meet
the
energy-‐
and
food
demand
of
the
large
populaHon.
Shanghai
has
been
subject
of
studies
to
demonstrate
consequences
of
its
urbanizaHon
and
visibility
degradaHon
due
to
air
polluHon
is
one
of
these
consequences.
In
urban
areas,
elevated
concentraHons
of
air
pollutants
may
lead
to
periods
of
haze
and
in
Shanghai
the
phenomenon
of
haze
has
become
a
regular
happening.
Of
the
air
pollutants,
atmospheric
aerosol
is
mainly
responsible
for
the
visibility
degradaHon
due
to
aerosol
light
scaIering.
The
submicron
aerosol
size
range
(described
as
PM1)
is
highly
efficient
in
scaIering
of
light.
Chemically
this
size
fracHon
comprises
a
large
mass
of
secondary
inorganic
aerosol
(SIA)
species
ammonium
(NH4
+),
nitrate
(NO3
-‐),
sulfate
(SO4
2-‐)
and
chloride
(Cl-‐)
With
the
large
mass
fracHon
of
SIA
in
PM1
and
the
scaIering
efficiency
of
PM1,
it
seems
crucial
to
relate
the
role
of
PM1
to
visibility
degradaHon.
Here
we
present
hourly
mass
concentraHons
of
SIA
species
ammonium,
nitrate
and
sulfate
in
PM1
in
Shanghai
for
a
4-‐week
intensive
measurement
campaign
in
December
2012.
The
importance
of
the
presence
of
ammonium
during
periods
of
visibility
degradaHon
is
demonstrated.
To
demonstrate
that
the
precursor
gas
of
ammonium,
ammonia,
is
coming
from
non-‐local
sources,
backward
trajectories
of
air
masses
arriving
at
the
sampling
site
were
computed
using
the
Hybrid
Single-‐ParHcle
Lagrangian
Integrated
Trajectory
model
4.
Results
and
Discussion
8
haze
episodes
were
idenHfied
(RH<90%
while
visiility
<10
km)
and
the
mass
concentraHons
of
PM1
differ
significantly
during
the
periods
of
haze
and
clear
weather
periods.
An
average
of
30.7±17.1
μg/m3
during
‘clear’
periods
is
measured
and
an
average
of
62.1±25.6
μg/m3
during
haze
periods.
The
sum
of
SIA
species
show
a
similar
trend
and
increased
from
an
average
of
14.9±7.4
μg/m3
during
‘clear’
periods
to
29.7±10.7
μg/m3
during
haze
periods.
This
means
the
mass
contribuHon
of
SIA
to
PM1
during
clear
periods
averaged
51.0±12.3
%
while
the
mass
contribuHon
during
haze
averaged
48.2±7.9
%.
Summary
and
conclusion
During
a
4-‐week
intensive
campaign
the
role
of
submicron
aerosol
on
Shanghai’s
haze
was
studied
using
hourly
mass
concentraHons
of
PM1
and
SIA
species
(NH4
+,
NO3
-‐,
SO4
2-‐)
in
PM1.
SIA
precursor
gas
ammonia
plays
a
vital
role
in
the
visibility
degradaHon
and
origins
from
nearby
agriculture
acHviHes
in
the
YRD.
Local
emissions
of
NOx
and
SO2
react
with
the
transported
NH3
to
form
SIA
and
the
SIA
largely
contributes
to
the
PM1
mass
in
urban
Shanghai.
Instrumenta+on
Data
for
SIA
species
and
related
trace
gasses
was
obtained
using
MARGA.
Visibility
was
monitored
together
with
all
standard
meteorological
parameters
and
PM1
mass
was
obtained
with
a
SHARP.
Start and end time Vis.
(km.)
RH
(%)
Aerosol species (µg/m3
)
NH4
+
SO4
2-
NO3
-
PM1
Gas species (µg/m3
)
NH3 SO2 HNO3
1. 3/12 12.00 – 3/12 21.00 8.4 64 6.4 9.7 8.4 48.6 2.5 20.0 0.7
2. 7/12 22.00 – 9/12 01.00 7.6 56 11.0 10.9 19.3 93.2 5.1 47.4 2.0
3. 14/12 12.00 – 15/12 00.00 6.4 76 8.2 10.5 9.9 65.0 11.8 18.9 0.9
4. 16/12 15.00 – 17/12 07.00 6.6 83 4.9 8.5 4.8 31.4 9.5 2.9 0.4
5. 21/12 09.00 – 21/12 18.00 5.4 87 4.6 7.4 4.2 44.7 3.7 3.1 0.5
6. 22/12 09.00 – 22/12 14.00 7.1 74 7.9 12.6 10.6 54.3 3.2 15.9 0.7
7. 23/12 07.00 – 23/12 16.00 9.2 57 9.3 12.6 14.9 65.7 1.1 60.5 2.0
8. 29/12 23.00 – 30/12 06.00 6.7 81 5.5 7.9 8.4 48.0 1.7 8.9 0.8
Ave. ‘Haze periods’ (94 hours) 7.2 70 7.9 10.1 11.7 62.1 5.4 26.9 1.4
Ave. ‘Foggy’ periods (40 hours) 5.4 94 2.9 5.2 2.5 24.2 4.7 3.2 0.4
Ave. ‘Clear’ periods (483 hours) 25.6 59 3.9 5.8 5.2 30.7 3.3 23.1 0.9
1
The
correlaHons
between
visibility
and
PM1
mass
concentraHons
of
SIA
species
during
clear
and
haze
periods
are
explored
to
demonstrate
the
importance
of
the
SIA
species
in
visibility
reducHon.
The
visibility
decreases
exponenHally
with
increase
of
PM1
mass
and
a
same
trend
is
observed
for
SIA
species.
The
correlaHon
coefficients
(R2)
of
the
visibility
as
funcHon
of
the
concentraHons
are
in
the
order
of
PM1
(0.56)
>
ammonium
(0.52)
>
sulfate
(0.41)
>
nitrate
(0.39).
We
can
predict
the
amount
of
ammonium
in
the
aerosol
assuming
that
all
ammonium
is
coupled
to
sulfate
and
nitrate.
For
that
we
apply:
NH4
+
PRED
=
18*
((SO4
2-‐/48)
+
(NO3
-‐/62))
Data
shows
very
good
agreement
between
the
predicted
and
measured
NH4
+
(R2
=
0.97).
The
slope
of
the
regression
shows
an
overesHmaHon
of
0.12
which
means,
on
average,
12
mass%
NH4
+
is
not
coupled
to
sulfate
or
nitrate
but
likely
to
species
such
as
chloride
and
bisulfate.
Time
series
together
with
the
correlaHons
demonstrate
that
NH4
+,
SO4
2-‐
and
NO3
-‐
in
PM1
follow
similar
trends.
In
general
NH3
concentraHons
show
a
different
trend
with
SO2
(correlaHon
R2=0.17)
and
HNO3
(correlaHon
R2=0.07)
and
this
indicates
NH3
is
from
a
different
source
than
SO2
and
HNO3.
It
is
well
known
that
the
traffic
and
industry
in
Shanghai
are
responsible
for
elevated
NOx
and
SO2
by
the
numerous
point
sources
of
NOx
and
SO2
emission
by
power
plants
and
industrial
acHviHes
in
Shanghai.
Hence
the
assumpHon
that
NH3
is
transported
to
the
urban
area
where
it
reacts
with
HNO3
and
H2SO4
to
form
the
SIA
species.
NH3
emission
sources
are
Yangzhou
(NW
of
Shanghai),
Nantong
(NNW
of
Shanghai)
and
Jiaxing
(SW
of
Shanghai).
We
show
72-‐hour
air
mass
backward
trajectories
for
all
the
haze
periods
to
study
the
long-‐distance
impact
of
ammonia
on
the
visibility
degradaHon.