SlideShare a Scribd company logo
1 of 49
Why has the global population grown so fast?
What is this trying to show?
Terminology
Population pyramids: are an age sex graph
Ageing population: Proportion of the country is increasingly getting
older, especially over the age of 65
Youthful population: Large proportion under 20years
LIFE EXPECTANCY – average years lived
INFANT MORTALITY RATE - The number of deaths per 1000 of the
population under the age of 1
CHILDS MORTALITY RATE - The number of deaths per 1000 people
between the ages of 1 and 5.
Birth Rate – number of babies born per 1000 population
Death Rate – number of deaths per 1000 population
TED-Ed: Understanding the power of population pyramids
Complete the
following TED-
Ed Lesson as a
revision of this
video
https://www.youtube.com/watch?v=RLmKfX
wWQtE
Developing country shape: Pyramid shape
Developed country shape: Beehive or coffin shape
• An age-sex graph, commonly referred to as a population pyramid
even though the graph for some countries is not actually a pyramid
shape, displays a population's age and sex composition. Horizontal
bars represent the numbers or proportions of males and females in
each age group, or cohort. The sum of all the age-sex cohorts in the
population pyramid equals 100 percent of the population. Cohorts
may vary from single years to groups of years.
Population structure and population pyramids
• Population structure means the "make up" or composition of a
population. Looking at the population structure of a place shows how
the population is divided up between males and females of different
age groups.
Population Pyramid Shapes
Demographers use following terms to describe the
general shape of population pyramids:
EXPANSIVE
● describe populations that are young and
growing.
● characterized by their typical ‘pyramid’ shape,
which has a broad base and narrow top.
STATIONARY
● describe populations that are not growing.
● characterized by their rectangular shape,
displaying somewhat equal percentages across
age cohorts that taper off toward the top.
CONSTRICTIVE
● describe populations that are elderly and
shrinking.
● often look like beehives and typically have an
inverted shape with the graph tapering in at the
bottom.
EXPANSIVE STATIONARY CONSTRICTI
VE
Qatar – Over 70% are male
Population Pyramid Analysis
Looking at the two population pyramids from Bangladesh
above, annotate the two population pyramids as
demonstrated in the above ‘common population pyramids
shapes’ and then answer the following questions.
1. What was the biggest age group in 2012?
2. Which will be the biggest by 2042?
3. What is the life expectancy in Bangladesh?
4. How will the numbers of people over 80 change
between 2012 and 2042? What impact will this have
on society?
5. What factors might be contributing to such a large
proportion of children?
Notice how in the UK 2000 pyramid there is a noticeable bulge in the area of the 30-34
and 35-39 age groups, with the numbers thereafter reducing fairly steadily as the ages
increase. Compare this to the 2025 pyramid. Here the bulge extends much further,
covering the age groups 30-34, 35-39, 40-44, 45-49, 50-54, 55-59 and 60-64, with the
numbers beginning to reduce significantly only after 64.
• In this graph, notice that in 2000 the 0-4 age group contained the largest number
of people, with the numbers thereafter declining steadily as the ages increase.
The graph looks like a triangle or pyramid. In the second graph, the largest group
in Mozambique in 2025 is still the 0-4 age group, but there are nearly as many
people in the 5-9, 10-14, 15-19, 20-24 and 25-29 age groups. Now the population
pyramid looks less like a triangle or pyramid.
Key things to know about population pyramids:
• The shape of a population pyramid gives us information about birth
and death rates as well as life expectancy.
• A population pyramid tells us how many dependants there are living
in an area. There are two groups of dependants; young dependants
(aged below 15) and elderly dependants (aged over 65).
• Those of working age are classed as economically active. Dependants
rely upon the economically active for economic support.
How may a pyramid change over time?
• A population pyramid that is very triangular (eg Mozambique in 2000)
illustrates a population with a high number of young dependants and
a low life expectancy.
• A population pyramid that has fairly straight sides (more like a barrel)
illustrates a population with a falling birth rate and a rising life
expectancy.
• Over time, as a country develops, the shape of its population pyramid
changes from a triangular shape to a barrel-like shape with straighter
edges.
Armed with your knowledge of population pyramids
annotate both with geographic terminology:
Dependency ratios
• The population of a country can be divided into two categories
according to their contribution to economic productivity. Those aged
15-65 years are known as the economically active or working
population; those under 15 (the youth dependency ratio) and over 65
(the old age dependency ratio) are known as the non-economically
active population.
DEPENDENCY RATIOS: The population of a country can be divided into
two categories according to their contribution to economic productivity
0-14 + 65 (dependents) x 100
15-65 (working age) 1
e.g. UK 1971 (figures in millions):
13 387 + 7307 x100 = 65.45
31616
So for every 100 people of working age there were 65.45 people
dependent upon them
By 1999 the dependency ratio had changed to:
• 11 345 + 9 271 x 100 = 53.55
38 498
So although the number of elderly people had increased, this was
more than offset by the larger drop in the number of children (the
dependency ratio does not take into account those who are
unemployed). The dependency ratio for most developed countries is
between 50 and 70, whereas for less economically developed
countries it is often over 100.
The dependency ratio can be expressed as:
children (0-14)
and elderly (65 and over)x 100
those of working age
Dependency Ratios - Youthful & Ageing Populations
What is the dependency ratio?
● a measure showing the number
of dependents (economically
dependent)
○ aged zero to 14 and over
the age of 65,
● to the total population, aged 15
to 64 (economically active)
This indicator gives insight into the
amount of people of non-working age
compared to the number of those of
working age.
Making sense of the dependency ratio
A high ratio means those of working
age, and the overall economy, face a
greater burden in supporting the
youthful & ageing population.
● The young dependency ratio
includes those only under 15
● the elderly dependency ratio
focuses on those over 64.
As the percentage of non-working
citizens rises, those who are working
are likely subject to increased taxes to
compensate for the larger dependent
population.
The World Bank: Age dependency ratio (% of working-age population)
In 2016
Australia’s
dependency
ratio was
51.863%
The World Bank: Age dependency ratio (% of working-age population)
Calculating
Dependency Ratios
• Dependency ratio calculation is:
• No. of dependent people x 100
• No. of people of working age
• Use the data in the table opposite to
calculate the dependency ratio for each
country shown.
• EG. Australia:
• Total pop = 21.3 mill
• No. dep = (19+13)% of 21.3 mill =
6.8 mill
• No. working age = 68% of 21.3
mill = 14.5 mill
• Many developing countries have a high number of young
dependants, whilst many developed countries have a growing
number of elderly dependants.
How will the structure of population A impact on the provision of 2
social services? HSC Short Ans
• Due to population As structure the provision of social services is going to be
difficult. There is a small working age population to support the young average
population. This will make it difficult for Population A to raise enough tax
revenue to provide health and education services.
• How will the structure of population B impact on the provision of 2 social
services?
• Due to the ageing population structure of Population B this will impact on the
provision of social services. The provision of health and aged care facilities for
the ageing population will be difficult as the average age of Population B is
getting older. The proportionately smaller working age population will have
more dependents to support which will impact on the ability of the government
to raise tax money for the provision of social services.
The Economist 2060 and the world Population
• https://www.facebook.com/watch/?v=10154039743664060
Population structure
EQ: How can we describe the structure of a population?
Retrieval Quiz
1. What is meant by the term population distribution?
a) The concentration of people in particular areas
b) The total number of people who live in a country
c) The pattern of how people are spread within an area
2. Which of these continents is the most sparsely populated?
a) Asia
b) Antarctica
c) Africa
3. Which of these countries was thought to be the most populated
country during 2023?
a) India
b) USA
c) China
4. True or False: Sparsely populated areas tend to have fewer
resources.
Population structure
EQ: How can we describe the structure of a population?
Retrieval Quiz
Use your red pen to self assess and make any corrections 
1. What is meant by the term population distribution?
The pattern of how people are spread within an area
2. Which of these continents is the most sparsely populated?
Antarctica
3. Which of these countries was thought to be the most populated
country during 2023?
China
4. True or False: Sparsely populated areas tend to have fewer
resources.
True
EQ: How can we describe the structure of a population?
Population change
The size and structure of a population is influenced by the birth rate and death
rate.
The birth rate is the number of births per 1,000 of the country’s population
each year.
The death rate is the number of deaths per 1,000 of the country’s population
each year.
The difference between the birth rate and death rate is the natural increase or
natural decrease in a country’s population.
Task
1. For natural increase in a country’s population, what would the relationship
between birth rate and death rate have to be?
2. For natural decrease in a country’s population, what would the relationship
between birth rate and death rate have to be?
EQ: How can we describe the structure of a population?
Task
Complete the sentences below by choosing the most appropriate word.
1. For natural increase in a country’s population, the birth rate would have to
be ( higher / lower ) than the death rate.
2. For natural decrease in a country’s population, the birth rate would have to
be ( higher / lower ) than the death rate.
Population change
The size and structure of a population is influenced by the birth rate and death
rate.
The birth rate is the number of births per 1,000 of the country’s population
each year.
The death rate is the number of deaths per 1,000 of the country’s population
each year.
The difference between the birth rate and death rate is the natural increase or
natural decrease in a country’s population.
EQ: How can we describe the structure of a population?
Population change
The size and structure of a population is influenced by the birth rate and death
rate.
The birth rate is the number of births per 1,000 of the country’s population
each year.
The death rate is the number of deaths per 1,000 of the country’s population
each year.
The difference between the birth rate and death rate is the natural increase or
natural decrease in a country’s population.
Self Assessment
Tick each correct point in red pen 
1. For natural increase in a country’s population, the birth rate would have to
be higher than the death rate.
2. For natural decrease in a country’s population, the birth rate would have to
be lower than the death rate.
EQ: How can we describe the structure of a population?
A study by demographers shows that as country’s develop their population
growth rate passes through five different stages. A Demographic Transition
Model (DTM) was created to describe these differences.
EQ: How can we describe the structure of a population?
Task
To be successful at this task you need to make links to
the development topic.
Use the DTM to explain why compared with developing
countries, developed countries usually have a lower
death rate.
Modelled Answer
Use the modelled answer below
which explained why compared
with developing countries,
developed countries usually have
lower birth rates.
Developed countries have a lower
birth rate because of the
changing role of women in
society. This means that more
women work and use
contraception, therefore
increasing the working population
and reducing the amount of
children being born in a country.
Key Terms
 Economy
 Standard of living
 Life expectancy
 Healthcare
 Sanitation and clean water
EQ: How can we describe the structure of a population?
Peer Assessment
Read through your partners and comment on their work. You should use the following
questions to help your comments:
 Have they got a detailed explanation?
 Have they used key terms?
 Have they made links to the development topic?
 Have they used connectives?
Model Answer
Developed countries have a lower death rate because they have a better economy
which leads to a better standard of living due to greater investment in healthcare. This
leads to improvement in medicine, access to doctors and hospitals and improved
sanitation. Good sanitation and a clean water supply also create a healthier population
in developed countries. As a result the life expectancy is greater and there are less
people dying.
EQ: How can we describe the structure of a population?
Population pyramids
These are used to analyse the structure of populations by showing the age and
gender distribution of a given population. Gender is shown on the left and
right sides, age on the y-axis, and the percentage of population on the x-axis.
What are the benefits of analysing
a population structure?
EQ: How can we describe the structure of a population?
Pyramid A Pyramid B
Task
Use the population pyramids for two different countries below to complete the following
tasks in full sentences:
1. Which country has a high birth rate?
2. Which country has fewer children and many older people?
3. Which country will need to build more schools and housing in the future?
4. Which country will need more retirement homes and medical services?
5. From your analysis of these two population pyramids, which one do you think shows
the UK? Explain your answer by referring to the DTM.
EQ: How can we describe the structure of a population?
Self Assessment
Tick each correct point in red pen 
1. Country B has a high birth rate.
2. Country A has fewer children and many older people.
3. Country A will need to build more schools and housing in the future.
4. Country B will need more retirement homes and medical services.
5. The UK is country A because we are a developed country in stage 4 of the DTM with
a lower birth rate and a lower death rate.
EQ: How can we describe the structure of
a population?

More Related Content

Similar to 2022 Pop pyramid .pptx

Population Structure
Population  StructurePopulation  Structure
Population Structureljordan
 
Population Structure
Population StructurePopulation Structure
Population Structureljordan
 
Population-Growth-v1 (1).pptx
Population-Growth-v1 (1).pptxPopulation-Growth-v1 (1).pptx
Population-Growth-v1 (1).pptxRachnaKotiyal1
 
Population Structure
Population StructurePopulation Structure
Population Structurecheergalsal
 
Tellusant - Quick Read - Defining and Quantifying Socioeconomic Levels
Tellusant - Quick Read - Defining and Quantifying Socioeconomic LevelsTellusant - Quick Read - Defining and Quantifying Socioeconomic Levels
Tellusant - Quick Read - Defining and Quantifying Socioeconomic LevelsTellusant, Inc.
 
Population structure lesson4
Population structure lesson4Population structure lesson4
Population structure lesson4Ms Geoflake
 
Ageing and declining populations
Ageing and declining populationsAgeing and declining populations
Ageing and declining populationsMrs Coles
 
Datos de La población mundial 2018. (Population Reference Bureau) 2018 world-...
Datos de La población mundial 2018. (Population Reference Bureau) 2018 world-...Datos de La población mundial 2018. (Population Reference Bureau) 2018 world-...
Datos de La población mundial 2018. (Population Reference Bureau) 2018 world-...Juan Martín Martín
 
The Future of India's Economy
The Future of India's EconomyThe Future of India's Economy
The Future of India's EconomyEdward Hugh
 
GEOGRAPHY IGCSE: POPULATION STRUCTURE
GEOGRAPHY IGCSE: POPULATION STRUCTUREGEOGRAPHY IGCSE: POPULATION STRUCTURE
GEOGRAPHY IGCSE: POPULATION STRUCTUREGeorge Dumitrache
 
GEOGRAPHY IGCSE: POPULATION STRUCTURE
GEOGRAPHY IGCSE: POPULATION STRUCTUREGEOGRAPHY IGCSE: POPULATION STRUCTURE
GEOGRAPHY IGCSE: POPULATION STRUCTUREGeorge Dumitrache
 
JCEP workshop creating aging friendly communities barber jensen knudsen upda...
JCEP workshop creating aging friendly communities barber jensen  knudsen upda...JCEP workshop creating aging friendly communities barber jensen  knudsen upda...
JCEP workshop creating aging friendly communities barber jensen knudsen upda...University of Wiscsonsin-Madison
 
Demographic Transition 1- Construct a graph of birth and death rates i.docx
Demographic Transition 1- Construct a graph of birth and death rates i.docxDemographic Transition 1- Construct a graph of birth and death rates i.docx
Demographic Transition 1- Construct a graph of birth and death rates i.docxtheresar3
 
C6 POPULATION GROWTH (econdev)_20240306_214313_0000.pdf
C6 POPULATION GROWTH (econdev)_20240306_214313_0000.pdfC6 POPULATION GROWTH (econdev)_20240306_214313_0000.pdf
C6 POPULATION GROWTH (econdev)_20240306_214313_0000.pdfSARAHJOYLVELANTE
 
Introduction to population pyramids
Introduction to population pyramidsIntroduction to population pyramids
Introduction to population pyramidsYCIS Beijing
 

Similar to 2022 Pop pyramid .pptx (20)

Population Structure
Population  StructurePopulation  Structure
Population Structure
 
Population Structure
Population StructurePopulation Structure
Population Structure
 
Population-Growth-v1.pptx
Population-Growth-v1.pptxPopulation-Growth-v1.pptx
Population-Growth-v1.pptx
 
Population-Growth-v1 (1).pptx
Population-Growth-v1 (1).pptxPopulation-Growth-v1 (1).pptx
Population-Growth-v1 (1).pptx
 
Population Structure
Population StructurePopulation Structure
Population Structure
 
Tellusant - Quick Read - Defining and Quantifying Socioeconomic Levels
Tellusant - Quick Read - Defining and Quantifying Socioeconomic LevelsTellusant - Quick Read - Defining and Quantifying Socioeconomic Levels
Tellusant - Quick Read - Defining and Quantifying Socioeconomic Levels
 
Population structure lesson4
Population structure lesson4Population structure lesson4
Population structure lesson4
 
SociologyExchange.co.uk Shared Resource
SociologyExchange.co.uk Shared ResourceSociologyExchange.co.uk Shared Resource
SociologyExchange.co.uk Shared Resource
 
Ageing and declining populations
Ageing and declining populationsAgeing and declining populations
Ageing and declining populations
 
Datos de La población mundial 2018. (Population Reference Bureau) 2018 world-...
Datos de La población mundial 2018. (Population Reference Bureau) 2018 world-...Datos de La población mundial 2018. (Population Reference Bureau) 2018 world-...
Datos de La población mundial 2018. (Population Reference Bureau) 2018 world-...
 
The Future of India's Economy
The Future of India's EconomyThe Future of India's Economy
The Future of India's Economy
 
Population Structure
Population StructurePopulation Structure
Population Structure
 
GEOGRAPHY IGCSE: POPULATION STRUCTURE
GEOGRAPHY IGCSE: POPULATION STRUCTUREGEOGRAPHY IGCSE: POPULATION STRUCTURE
GEOGRAPHY IGCSE: POPULATION STRUCTURE
 
GEOGRAPHY IGCSE: POPULATION STRUCTURE
GEOGRAPHY IGCSE: POPULATION STRUCTUREGEOGRAPHY IGCSE: POPULATION STRUCTURE
GEOGRAPHY IGCSE: POPULATION STRUCTURE
 
Demography and the Market
Demography and the MarketDemography and the Market
Demography and the Market
 
JCEP workshop creating aging friendly communities barber jensen knudsen upda...
JCEP workshop creating aging friendly communities barber jensen  knudsen upda...JCEP workshop creating aging friendly communities barber jensen  knudsen upda...
JCEP workshop creating aging friendly communities barber jensen knudsen upda...
 
Demographic Transition 1- Construct a graph of birth and death rates i.docx
Demographic Transition 1- Construct a graph of birth and death rates i.docxDemographic Transition 1- Construct a graph of birth and death rates i.docx
Demographic Transition 1- Construct a graph of birth and death rates i.docx
 
C6 POPULATION GROWTH (econdev)_20240306_214313_0000.pdf
C6 POPULATION GROWTH (econdev)_20240306_214313_0000.pdfC6 POPULATION GROWTH (econdev)_20240306_214313_0000.pdf
C6 POPULATION GROWTH (econdev)_20240306_214313_0000.pdf
 
Introduction to population pyramids
Introduction to population pyramidsIntroduction to population pyramids
Introduction to population pyramids
 
Demography
DemographyDemography
Demography
 

Recently uploaded

Software Engineering Methodologies (overview)
Software Engineering Methodologies (overview)Software Engineering Methodologies (overview)
Software Engineering Methodologies (overview)eniolaolutunde
 
Painted Grey Ware.pptx, PGW Culture of India
Painted Grey Ware.pptx, PGW Culture of IndiaPainted Grey Ware.pptx, PGW Culture of India
Painted Grey Ware.pptx, PGW Culture of IndiaVirag Sontakke
 
Solving Puzzles Benefits Everyone (English).pptx
Solving Puzzles Benefits Everyone (English).pptxSolving Puzzles Benefits Everyone (English).pptx
Solving Puzzles Benefits Everyone (English).pptxOH TEIK BIN
 
Crayon Activity Handout For the Crayon A
Crayon Activity Handout For the Crayon ACrayon Activity Handout For the Crayon A
Crayon Activity Handout For the Crayon AUnboundStockton
 
Enzyme, Pharmaceutical Aids, Miscellaneous Last Part of Chapter no 5th.pdf
Enzyme, Pharmaceutical Aids, Miscellaneous Last Part of Chapter no 5th.pdfEnzyme, Pharmaceutical Aids, Miscellaneous Last Part of Chapter no 5th.pdf
Enzyme, Pharmaceutical Aids, Miscellaneous Last Part of Chapter no 5th.pdfSumit Tiwari
 
Science lesson Moon for 4th quarter lesson
Science lesson Moon for 4th quarter lessonScience lesson Moon for 4th quarter lesson
Science lesson Moon for 4th quarter lessonJericReyAuditor
 
ECONOMIC CONTEXT - LONG FORM TV DRAMA - PPT
ECONOMIC CONTEXT - LONG FORM TV DRAMA - PPTECONOMIC CONTEXT - LONG FORM TV DRAMA - PPT
ECONOMIC CONTEXT - LONG FORM TV DRAMA - PPTiammrhaywood
 
CARE OF CHILD IN INCUBATOR..........pptx
CARE OF CHILD IN INCUBATOR..........pptxCARE OF CHILD IN INCUBATOR..........pptx
CARE OF CHILD IN INCUBATOR..........pptxGaneshChakor2
 
The Most Excellent Way | 1 Corinthians 13
The Most Excellent Way | 1 Corinthians 13The Most Excellent Way | 1 Corinthians 13
The Most Excellent Way | 1 Corinthians 13Steve Thomason
 
18-04-UA_REPORT_MEDIALITERAСY_INDEX-DM_23-1-final-eng.pdf
18-04-UA_REPORT_MEDIALITERAСY_INDEX-DM_23-1-final-eng.pdf18-04-UA_REPORT_MEDIALITERAСY_INDEX-DM_23-1-final-eng.pdf
18-04-UA_REPORT_MEDIALITERAСY_INDEX-DM_23-1-final-eng.pdfssuser54595a
 
Organic Name Reactions for the students and aspirants of Chemistry12th.pptx
Organic Name Reactions  for the students and aspirants of Chemistry12th.pptxOrganic Name Reactions  for the students and aspirants of Chemistry12th.pptx
Organic Name Reactions for the students and aspirants of Chemistry12th.pptxVS Mahajan Coaching Centre
 
Biting mechanism of poisonous snakes.pdf
Biting mechanism of poisonous snakes.pdfBiting mechanism of poisonous snakes.pdf
Biting mechanism of poisonous snakes.pdfadityarao40181
 
SOCIAL AND HISTORICAL CONTEXT - LFTVD.pptx
SOCIAL AND HISTORICAL CONTEXT - LFTVD.pptxSOCIAL AND HISTORICAL CONTEXT - LFTVD.pptx
SOCIAL AND HISTORICAL CONTEXT - LFTVD.pptxiammrhaywood
 
Blooming Together_ Growing a Community Garden Worksheet.docx
Blooming Together_ Growing a Community Garden Worksheet.docxBlooming Together_ Growing a Community Garden Worksheet.docx
Blooming Together_ Growing a Community Garden Worksheet.docxUnboundStockton
 
Mastering the Unannounced Regulatory Inspection
Mastering the Unannounced Regulatory InspectionMastering the Unannounced Regulatory Inspection
Mastering the Unannounced Regulatory InspectionSafetyChain Software
 
Pharmacognosy Flower 3. Compositae 2023.pdf
Pharmacognosy Flower 3. Compositae 2023.pdfPharmacognosy Flower 3. Compositae 2023.pdf
Pharmacognosy Flower 3. Compositae 2023.pdfMahmoud M. Sallam
 
Paris 2024 Olympic Geographies - an activity
Paris 2024 Olympic Geographies - an activityParis 2024 Olympic Geographies - an activity
Paris 2024 Olympic Geographies - an activityGeoBlogs
 
ENGLISH5 QUARTER4 MODULE1 WEEK1-3 How Visual and Multimedia Elements.pptx
ENGLISH5 QUARTER4 MODULE1 WEEK1-3 How Visual and Multimedia Elements.pptxENGLISH5 QUARTER4 MODULE1 WEEK1-3 How Visual and Multimedia Elements.pptx
ENGLISH5 QUARTER4 MODULE1 WEEK1-3 How Visual and Multimedia Elements.pptxAnaBeatriceAblay2
 
Presiding Officer Training module 2024 lok sabha elections
Presiding Officer Training module 2024 lok sabha electionsPresiding Officer Training module 2024 lok sabha elections
Presiding Officer Training module 2024 lok sabha electionsanshu789521
 
Introduction to AI in Higher Education_draft.pptx
Introduction to AI in Higher Education_draft.pptxIntroduction to AI in Higher Education_draft.pptx
Introduction to AI in Higher Education_draft.pptxpboyjonauth
 

Recently uploaded (20)

Software Engineering Methodologies (overview)
Software Engineering Methodologies (overview)Software Engineering Methodologies (overview)
Software Engineering Methodologies (overview)
 
Painted Grey Ware.pptx, PGW Culture of India
Painted Grey Ware.pptx, PGW Culture of IndiaPainted Grey Ware.pptx, PGW Culture of India
Painted Grey Ware.pptx, PGW Culture of India
 
Solving Puzzles Benefits Everyone (English).pptx
Solving Puzzles Benefits Everyone (English).pptxSolving Puzzles Benefits Everyone (English).pptx
Solving Puzzles Benefits Everyone (English).pptx
 
Crayon Activity Handout For the Crayon A
Crayon Activity Handout For the Crayon ACrayon Activity Handout For the Crayon A
Crayon Activity Handout For the Crayon A
 
Enzyme, Pharmaceutical Aids, Miscellaneous Last Part of Chapter no 5th.pdf
Enzyme, Pharmaceutical Aids, Miscellaneous Last Part of Chapter no 5th.pdfEnzyme, Pharmaceutical Aids, Miscellaneous Last Part of Chapter no 5th.pdf
Enzyme, Pharmaceutical Aids, Miscellaneous Last Part of Chapter no 5th.pdf
 
Science lesson Moon for 4th quarter lesson
Science lesson Moon for 4th quarter lessonScience lesson Moon for 4th quarter lesson
Science lesson Moon for 4th quarter lesson
 
ECONOMIC CONTEXT - LONG FORM TV DRAMA - PPT
ECONOMIC CONTEXT - LONG FORM TV DRAMA - PPTECONOMIC CONTEXT - LONG FORM TV DRAMA - PPT
ECONOMIC CONTEXT - LONG FORM TV DRAMA - PPT
 
CARE OF CHILD IN INCUBATOR..........pptx
CARE OF CHILD IN INCUBATOR..........pptxCARE OF CHILD IN INCUBATOR..........pptx
CARE OF CHILD IN INCUBATOR..........pptx
 
The Most Excellent Way | 1 Corinthians 13
The Most Excellent Way | 1 Corinthians 13The Most Excellent Way | 1 Corinthians 13
The Most Excellent Way | 1 Corinthians 13
 
18-04-UA_REPORT_MEDIALITERAСY_INDEX-DM_23-1-final-eng.pdf
18-04-UA_REPORT_MEDIALITERAСY_INDEX-DM_23-1-final-eng.pdf18-04-UA_REPORT_MEDIALITERAСY_INDEX-DM_23-1-final-eng.pdf
18-04-UA_REPORT_MEDIALITERAСY_INDEX-DM_23-1-final-eng.pdf
 
Organic Name Reactions for the students and aspirants of Chemistry12th.pptx
Organic Name Reactions  for the students and aspirants of Chemistry12th.pptxOrganic Name Reactions  for the students and aspirants of Chemistry12th.pptx
Organic Name Reactions for the students and aspirants of Chemistry12th.pptx
 
Biting mechanism of poisonous snakes.pdf
Biting mechanism of poisonous snakes.pdfBiting mechanism of poisonous snakes.pdf
Biting mechanism of poisonous snakes.pdf
 
SOCIAL AND HISTORICAL CONTEXT - LFTVD.pptx
SOCIAL AND HISTORICAL CONTEXT - LFTVD.pptxSOCIAL AND HISTORICAL CONTEXT - LFTVD.pptx
SOCIAL AND HISTORICAL CONTEXT - LFTVD.pptx
 
Blooming Together_ Growing a Community Garden Worksheet.docx
Blooming Together_ Growing a Community Garden Worksheet.docxBlooming Together_ Growing a Community Garden Worksheet.docx
Blooming Together_ Growing a Community Garden Worksheet.docx
 
Mastering the Unannounced Regulatory Inspection
Mastering the Unannounced Regulatory InspectionMastering the Unannounced Regulatory Inspection
Mastering the Unannounced Regulatory Inspection
 
Pharmacognosy Flower 3. Compositae 2023.pdf
Pharmacognosy Flower 3. Compositae 2023.pdfPharmacognosy Flower 3. Compositae 2023.pdf
Pharmacognosy Flower 3. Compositae 2023.pdf
 
Paris 2024 Olympic Geographies - an activity
Paris 2024 Olympic Geographies - an activityParis 2024 Olympic Geographies - an activity
Paris 2024 Olympic Geographies - an activity
 
ENGLISH5 QUARTER4 MODULE1 WEEK1-3 How Visual and Multimedia Elements.pptx
ENGLISH5 QUARTER4 MODULE1 WEEK1-3 How Visual and Multimedia Elements.pptxENGLISH5 QUARTER4 MODULE1 WEEK1-3 How Visual and Multimedia Elements.pptx
ENGLISH5 QUARTER4 MODULE1 WEEK1-3 How Visual and Multimedia Elements.pptx
 
Presiding Officer Training module 2024 lok sabha elections
Presiding Officer Training module 2024 lok sabha electionsPresiding Officer Training module 2024 lok sabha elections
Presiding Officer Training module 2024 lok sabha elections
 
Introduction to AI in Higher Education_draft.pptx
Introduction to AI in Higher Education_draft.pptxIntroduction to AI in Higher Education_draft.pptx
Introduction to AI in Higher Education_draft.pptx
 

2022 Pop pyramid .pptx

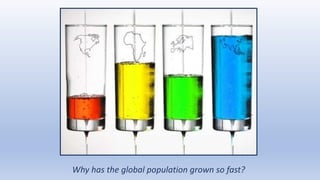
  • 1. Why has the global population grown so fast?
  • 2. What is this trying to show?
  • 3. Terminology Population pyramids: are an age sex graph Ageing population: Proportion of the country is increasingly getting older, especially over the age of 65 Youthful population: Large proportion under 20years LIFE EXPECTANCY – average years lived INFANT MORTALITY RATE - The number of deaths per 1000 of the population under the age of 1 CHILDS MORTALITY RATE - The number of deaths per 1000 people between the ages of 1 and 5.
  • 4. Birth Rate – number of babies born per 1000 population Death Rate – number of deaths per 1000 population
  • 5. TED-Ed: Understanding the power of population pyramids Complete the following TED- Ed Lesson as a revision of this video https://www.youtube.com/watch?v=RLmKfX wWQtE
  • 6. Developing country shape: Pyramid shape Developed country shape: Beehive or coffin shape
  • 7. • An age-sex graph, commonly referred to as a population pyramid even though the graph for some countries is not actually a pyramid shape, displays a population's age and sex composition. Horizontal bars represent the numbers or proportions of males and females in each age group, or cohort. The sum of all the age-sex cohorts in the population pyramid equals 100 percent of the population. Cohorts may vary from single years to groups of years.
  • 8. Population structure and population pyramids • Population structure means the "make up" or composition of a population. Looking at the population structure of a place shows how the population is divided up between males and females of different age groups.
  • 9. Population Pyramid Shapes Demographers use following terms to describe the general shape of population pyramids: EXPANSIVE ● describe populations that are young and growing. ● characterized by their typical ‘pyramid’ shape, which has a broad base and narrow top. STATIONARY ● describe populations that are not growing. ● characterized by their rectangular shape, displaying somewhat equal percentages across age cohorts that taper off toward the top. CONSTRICTIVE ● describe populations that are elderly and shrinking. ● often look like beehives and typically have an inverted shape with the graph tapering in at the bottom. EXPANSIVE STATIONARY CONSTRICTI VE
  • 10. Qatar – Over 70% are male
  • 11. Population Pyramid Analysis Looking at the two population pyramids from Bangladesh above, annotate the two population pyramids as demonstrated in the above ‘common population pyramids shapes’ and then answer the following questions. 1. What was the biggest age group in 2012? 2. Which will be the biggest by 2042? 3. What is the life expectancy in Bangladesh? 4. How will the numbers of people over 80 change between 2012 and 2042? What impact will this have on society? 5. What factors might be contributing to such a large proportion of children?
  • 12. Notice how in the UK 2000 pyramid there is a noticeable bulge in the area of the 30-34 and 35-39 age groups, with the numbers thereafter reducing fairly steadily as the ages increase. Compare this to the 2025 pyramid. Here the bulge extends much further, covering the age groups 30-34, 35-39, 40-44, 45-49, 50-54, 55-59 and 60-64, with the numbers beginning to reduce significantly only after 64.
  • 13. • In this graph, notice that in 2000 the 0-4 age group contained the largest number of people, with the numbers thereafter declining steadily as the ages increase. The graph looks like a triangle or pyramid. In the second graph, the largest group in Mozambique in 2025 is still the 0-4 age group, but there are nearly as many people in the 5-9, 10-14, 15-19, 20-24 and 25-29 age groups. Now the population pyramid looks less like a triangle or pyramid.
  • 14. Key things to know about population pyramids: • The shape of a population pyramid gives us information about birth and death rates as well as life expectancy. • A population pyramid tells us how many dependants there are living in an area. There are two groups of dependants; young dependants (aged below 15) and elderly dependants (aged over 65). • Those of working age are classed as economically active. Dependants rely upon the economically active for economic support.
  • 15. How may a pyramid change over time? • A population pyramid that is very triangular (eg Mozambique in 2000) illustrates a population with a high number of young dependants and a low life expectancy. • A population pyramid that has fairly straight sides (more like a barrel) illustrates a population with a falling birth rate and a rising life expectancy. • Over time, as a country develops, the shape of its population pyramid changes from a triangular shape to a barrel-like shape with straighter edges.
  • 16.
  • 17. Armed with your knowledge of population pyramids annotate both with geographic terminology:
  • 18.
  • 19. Dependency ratios • The population of a country can be divided into two categories according to their contribution to economic productivity. Those aged 15-65 years are known as the economically active or working population; those under 15 (the youth dependency ratio) and over 65 (the old age dependency ratio) are known as the non-economically active population.
  • 20. DEPENDENCY RATIOS: The population of a country can be divided into two categories according to their contribution to economic productivity 0-14 + 65 (dependents) x 100 15-65 (working age) 1
  • 21. e.g. UK 1971 (figures in millions): 13 387 + 7307 x100 = 65.45 31616 So for every 100 people of working age there were 65.45 people dependent upon them
  • 22. By 1999 the dependency ratio had changed to: • 11 345 + 9 271 x 100 = 53.55 38 498 So although the number of elderly people had increased, this was more than offset by the larger drop in the number of children (the dependency ratio does not take into account those who are unemployed). The dependency ratio for most developed countries is between 50 and 70, whereas for less economically developed countries it is often over 100.
  • 23. The dependency ratio can be expressed as: children (0-14) and elderly (65 and over)x 100 those of working age
  • 24. Dependency Ratios - Youthful & Ageing Populations What is the dependency ratio? ● a measure showing the number of dependents (economically dependent) ○ aged zero to 14 and over the age of 65, ● to the total population, aged 15 to 64 (economically active) This indicator gives insight into the amount of people of non-working age compared to the number of those of working age. Making sense of the dependency ratio A high ratio means those of working age, and the overall economy, face a greater burden in supporting the youthful & ageing population. ● The young dependency ratio includes those only under 15 ● the elderly dependency ratio focuses on those over 64. As the percentage of non-working citizens rises, those who are working are likely subject to increased taxes to compensate for the larger dependent population.
  • 25. The World Bank: Age dependency ratio (% of working-age population) In 2016 Australia’s dependency ratio was 51.863%
  • 26. The World Bank: Age dependency ratio (% of working-age population)
  • 27. Calculating Dependency Ratios • Dependency ratio calculation is: • No. of dependent people x 100 • No. of people of working age • Use the data in the table opposite to calculate the dependency ratio for each country shown. • EG. Australia: • Total pop = 21.3 mill • No. dep = (19+13)% of 21.3 mill = 6.8 mill • No. working age = 68% of 21.3 mill = 14.5 mill
  • 28. • Many developing countries have a high number of young dependants, whilst many developed countries have a growing number of elderly dependants.
  • 29.
  • 30.
  • 31.
  • 32.
  • 33.
  • 34.
  • 35. How will the structure of population A impact on the provision of 2 social services? HSC Short Ans • Due to population As structure the provision of social services is going to be difficult. There is a small working age population to support the young average population. This will make it difficult for Population A to raise enough tax revenue to provide health and education services. • How will the structure of population B impact on the provision of 2 social services? • Due to the ageing population structure of Population B this will impact on the provision of social services. The provision of health and aged care facilities for the ageing population will be difficult as the average age of Population B is getting older. The proportionately smaller working age population will have more dependents to support which will impact on the ability of the government to raise tax money for the provision of social services.
  • 36.
  • 37. The Economist 2060 and the world Population • https://www.facebook.com/watch/?v=10154039743664060
  • 38. Population structure EQ: How can we describe the structure of a population? Retrieval Quiz 1. What is meant by the term population distribution? a) The concentration of people in particular areas b) The total number of people who live in a country c) The pattern of how people are spread within an area 2. Which of these continents is the most sparsely populated? a) Asia b) Antarctica c) Africa 3. Which of these countries was thought to be the most populated country during 2023? a) India b) USA c) China 4. True or False: Sparsely populated areas tend to have fewer resources.
  • 39. Population structure EQ: How can we describe the structure of a population? Retrieval Quiz Use your red pen to self assess and make any corrections  1. What is meant by the term population distribution? The pattern of how people are spread within an area 2. Which of these continents is the most sparsely populated? Antarctica 3. Which of these countries was thought to be the most populated country during 2023? China 4. True or False: Sparsely populated areas tend to have fewer resources. True
  • 40. EQ: How can we describe the structure of a population? Population change The size and structure of a population is influenced by the birth rate and death rate. The birth rate is the number of births per 1,000 of the country’s population each year. The death rate is the number of deaths per 1,000 of the country’s population each year. The difference between the birth rate and death rate is the natural increase or natural decrease in a country’s population. Task 1. For natural increase in a country’s population, what would the relationship between birth rate and death rate have to be? 2. For natural decrease in a country’s population, what would the relationship between birth rate and death rate have to be?
  • 41. EQ: How can we describe the structure of a population? Task Complete the sentences below by choosing the most appropriate word. 1. For natural increase in a country’s population, the birth rate would have to be ( higher / lower ) than the death rate. 2. For natural decrease in a country’s population, the birth rate would have to be ( higher / lower ) than the death rate. Population change The size and structure of a population is influenced by the birth rate and death rate. The birth rate is the number of births per 1,000 of the country’s population each year. The death rate is the number of deaths per 1,000 of the country’s population each year. The difference between the birth rate and death rate is the natural increase or natural decrease in a country’s population.
  • 42. EQ: How can we describe the structure of a population? Population change The size and structure of a population is influenced by the birth rate and death rate. The birth rate is the number of births per 1,000 of the country’s population each year. The death rate is the number of deaths per 1,000 of the country’s population each year. The difference between the birth rate and death rate is the natural increase or natural decrease in a country’s population. Self Assessment Tick each correct point in red pen  1. For natural increase in a country’s population, the birth rate would have to be higher than the death rate. 2. For natural decrease in a country’s population, the birth rate would have to be lower than the death rate.
  • 43. EQ: How can we describe the structure of a population? A study by demographers shows that as country’s develop their population growth rate passes through five different stages. A Demographic Transition Model (DTM) was created to describe these differences.
  • 44. EQ: How can we describe the structure of a population? Task To be successful at this task you need to make links to the development topic. Use the DTM to explain why compared with developing countries, developed countries usually have a lower death rate. Modelled Answer Use the modelled answer below which explained why compared with developing countries, developed countries usually have lower birth rates. Developed countries have a lower birth rate because of the changing role of women in society. This means that more women work and use contraception, therefore increasing the working population and reducing the amount of children being born in a country. Key Terms  Economy  Standard of living  Life expectancy  Healthcare  Sanitation and clean water
  • 45. EQ: How can we describe the structure of a population? Peer Assessment Read through your partners and comment on their work. You should use the following questions to help your comments:  Have they got a detailed explanation?  Have they used key terms?  Have they made links to the development topic?  Have they used connectives? Model Answer Developed countries have a lower death rate because they have a better economy which leads to a better standard of living due to greater investment in healthcare. This leads to improvement in medicine, access to doctors and hospitals and improved sanitation. Good sanitation and a clean water supply also create a healthier population in developed countries. As a result the life expectancy is greater and there are less people dying.
  • 46. EQ: How can we describe the structure of a population? Population pyramids These are used to analyse the structure of populations by showing the age and gender distribution of a given population. Gender is shown on the left and right sides, age on the y-axis, and the percentage of population on the x-axis. What are the benefits of analysing a population structure?
  • 47. EQ: How can we describe the structure of a population? Pyramid A Pyramid B Task Use the population pyramids for two different countries below to complete the following tasks in full sentences: 1. Which country has a high birth rate? 2. Which country has fewer children and many older people? 3. Which country will need to build more schools and housing in the future? 4. Which country will need more retirement homes and medical services? 5. From your analysis of these two population pyramids, which one do you think shows the UK? Explain your answer by referring to the DTM.
  • 48. EQ: How can we describe the structure of a population? Self Assessment Tick each correct point in red pen  1. Country B has a high birth rate. 2. Country A has fewer children and many older people. 3. Country A will need to build more schools and housing in the future. 4. Country B will need more retirement homes and medical services. 5. The UK is country A because we are a developed country in stage 4 of the DTM with a lower birth rate and a lower death rate.
  • 49. EQ: How can we describe the structure of a population?

Editor's Notes

  1. Further information about these shapes can be found here
  2. Use data from Planet Geography p. 26 to calculate this data China =37.0% Iran =44.9% Japan = 46.8% PNG = 72.4% Singapore = 38.0% Uganda = 108% UK = 51.5% 37.0% 44.9% 46.8% 72.4% 38.0% 108% 51.5%
  3. More able task
  4. More able task
  5. Answers to both tasks
  6. More able task
  7. More able task
  8. More able task
  9. Answers to both tasks
  10. Answers to both tasks
  11. Answers to both tasks