
Recommended
More Related Content
Viewers also liked
Similar to epidemiology of burns in Nicaragua
Similar to epidemiology of burns in Nicaragua (20)
epidemiology of burns in Nicaragua
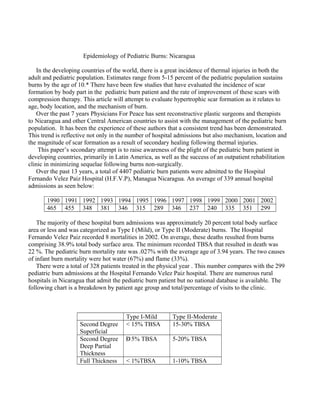
- 1. Epidemiology of Pediatric Burns: Nicaragua In the developing countries of the world, there is a great incidence of thermal injuries in both the adult and pediatric population. Estimates range from 5-15 percent of the pediatric population sustains burns by the age of 10.* There have been few studies that have evaluated the incidence of scar formation by body part in the pediatric burn patient and the rate of improvement of these scars with compression therapy. This article will attempt to evaluate hypertrophic scar formation as it relates to age, body location, and the mechanism of burn. Over the past 7 years Physicians For Peace has sent reconstructive plastic surgeons and therapists to Nicaragua and other Central American countries to assist with the management of the pediatric burn population. It has been the experience of these authors that a consistent trend has been demonstrated. This trend is reflective not only in the number of hospital admissions but also mechanism, location and the magnitude of scar formation as a result of secondary healing following thermal injuries. This paper’s secondary attempt is to raise awareness of the plight of the pediatric burn patient in developing countries, primarily in Latin America, as well as the success of an outpatient rehabilitation clinic in minimizing sequelae following burns non-surgically. Over the past 13 years, a total of 4407 pediatric burn patients were admitted to the Hospital Fernando Velez Paiz Hospital (H.F.V.P), Managua Nicaragua. An average of 339 annual hospital admissions as seen below: 1990 1991 1992 1993 1994 1995 1996 1997 1998 1999 2000 2001 2002 465 455 348 381 346 315 289 346 237 240 335 351 299 The majority of these hospital burn admissions was approximately 20 percent total body surface area or less and was categorized as Type I (Mild), or Type II (Moderate) burns. The Hospital Fernando Velez Paiz recorded 8 mortalities in 2002. On average, these deaths resulted from burns comprising 38.9% total body surface area. The minimum recorded TBSA that resulted in death was 22 %. The pediatric burn mortality rate was .027% with the average age of 3.94 years. The two causes of infant burn mortality were hot water (67%) and flame (33%). There were a total of 328 patients treated in the physical year . This number compares with the 299 pediatric burn admissions at the Hospital Fernando Velez Paiz hospital. There are numerous rural hospitals in Nicaragua that admit the pediatric burn patient but no national database is available. The following chart is a breakdown by patient age group and total/percentage of visits to the clinic. Type I-Mild Type II-Moderate Second Degree Superficial < 15% TBSA 15-30% TBSA Second Degree D Deep Partial Thickness < 5% TBSA 5-20% TBSA Full Thickness < 1%TBSA 1-10% TBSA
- 2. Due to the socioeconomic conditions within Nicaragua and specifically at Hospital Fernando Velez Paiz, the majority of these burns were allowed to heal via secondary intent. The healing times were generally in excess of 3 weeks. In many cases, complete skin closure did not occur until 2-3 months. This type of secondary healing is often the case in developing countries. Prolonged open wounds increase the chance of infection and allow proliferation of fibroblast activity. As a result, the pediatric patient is left with profound physical and psychological sequelae. The physical sequelae are manifested by contractures of joints, webbing around joint lines, loss of range of motion and strength. Deep thermal burns in the chest that affect the breast buds of growing girls can retard or stop breast development. Facial burns involving the ears, eyes, lips can also result in profound physical changes or loss of function entirely. The psychological problems associated with the primary burn and subsequent sequelae are profound and lifelong. The children often show clinical signs of depression, anger, and self-image issues. In Nicaragua, children often have difficulty returning to school. The long term issues are decreased vocational opportunities with an increased unemployment rate and greater burden on society in general. The use of compression therapies have been widely used and reported on with protocols for their use since early the 1970’s. One of the major purposes for the use of compression garments is prevention of complications that occur following thermal injuries. Rehabilitation often includes range of motion techniques, positioning, and splinting. Even with these interventions, surgical reconstruction and contracture releases are often needed. An outpatient rehabilitation clinic was established in April 2002 in Managua, Nicaragua. The purpose of this clinic is to provide these basic tenets of rehabilitation including compression therapies; Uvex masks, compression garments, and splints to the outpatient burned child. This clinic also provides physical and occupational burn rehabilitation as well. This outpatient clinic began compiling data June 2003 and recently celebrated its first year of operation. The summary of visits obtained June 2002-May 2003 is as follows: Total Number Of Patients Number of Patient Visits Compression Garments Splints Fabricated Uvex Masks Fabricated Total Number Orthotics 328 865 3210 293 39 3542 Clinic visits by Age: June 2002-May 2003 Visits by age group Percent by age group 0-11 months: 20 0-11 months: 2% 1-5 years: 333 1-5 years: 39% 6-10 years: 286 6-10 years: 33% 11-15 years: 131 11-15 years:15% 16-20 years: 21 16-20 years:21% 21+ years: 72 21+ years:8%
- 3. Seasonal trends are important to consider. Such trends would include weather and temperature, holiday celebration consistent with cultural norms (cooking, fireworks etc), childhood activities (school/vacation schedules, flying kites with resultant electrical burns). During this clinical year, the following volume was demonstrated: First Quarter 27% Second Quarter 29% Third Quarter 23% Fourth Quarter 31% The average number of patient visits to the clinic was 2.6 visits per child. This is a significant number to consider as it reflects the ability of the parents and patients to return for follow-up care and assessments. Due to numerous factors including the socioeconomic conditions in the developing countries compiled with the difficulty of traveling distances follow-up data collection is problematic. Other factors that complicate the management of these children is the level of parental education coupled with a lack of understanding of the potential sequelae associated with burns. Often the parents have psychological problems associated with their child’s burn and often effect compliance with follow-up patient visits and the daily use of the compression garments, masks and splints. The country of Nicaragua is 6 million people and roughly 50,000 square miles. Traveling is often difficult and time consuming. Managua is the capital with a population of 1.7 million people and was chosen as the primary treatment center for the outpatient rehabilitation center. The distribution of patient visits to the clinic by cities is as follows: City Visits Percentage Visit By City Boaco 20 .02 Costa Atlantica 29 .03 Carazo 9 .01 Chinandega 30 .04 Chontales 28 .03 Esteli 23 .03 Granada 18 .02 Jinotega 7 .01 Leon 17 .02 Managua 559 .65 Masaya 33 .04 Matagalpa 70 .08 Madrid 2 --- Nueva Segovia 3 --- Rio San Juan 6 .01 Rivas 11 .01 Total 865 ---
- 4. At this time, Physicians For Peace is trying to develop a mobile lab (i.e. a fully equipped van) to travel to outlying rural hospitals in the regions throughout Nicaragua to assist with follow-up management of known pediatric cases. This outreach program will also identify new pediatric burn cases that did not get admitted to Hospital Fernando Velez Paiz Hospital. This mobile lab will become “the vehicle” in a burn prevention and education campaign. Error: Reference source not found During the physical year that the outpatient clinic was established, it became apparent that the burn children were arriving with joint contractures and deformity immediately upon discharge from the hospital. This was the direct result of delayed, secondary healing. The known adage, “the position of comfort is the position of deformity”, was appreciated. The thermoplastic splinting program was then split into two components, an in-patient component and an outpatient component. As a result of this change, a better resting position of the extremities occurred resulting in better early discharge range of motion and as well as improved relationships between the medical providers and the patient and family members. Thermoplastic Splints Fabricated: Total-293 (both hospital and outpatient clinic) Thermoplastic Splints Fabricated bedside: 234 Location Total Casco 2 Cuello 9 Functional hand splint 105 Dynamic finger flexion splint 8 Neutral Wrist Splint 12 Ferula anatomica de la Mano 1 Extension de Codo 29 Braquiopalmar 7 Extension splints of fingers and hand 20 Kleinart splint 4 Thorax splint 1 Ferula en Avioneta 11
- 5. Lower extremity splint 30 Perineal region 5 Ferula anterior del pie 2 Ferula OTP 47 Total Number of Splints 293 Due to the many difficulties with patient follow up visits (poverty, travel, education etc) in developing countries there were a total of 159 patients treated that had sufficient data collected for review. Of the 159 patients, 57.2% were males and 42.8% female. These numbers correspond with other international studies* on pediatric burns. Sex Number by Gender Percent by Gender F 68 42.8% M 91 57.2% A further analysis of age and gender reveals that 50 percent of the patients treated in the outpatient clinic were children 5 years of age and younger. Age Group Gender Total Number of Patients Percent by Age and Gender 0-1 F 10 .06 0-1 M 15 .09 2-5 F 26 .16 2-5 M 31 .19 6-10 F 12 .08 6-10 M 21 .13 11-15 F 9 .06 11-15 M 12 .08 16+ F 11 .07 16+ M 12 .08 Of the 159 children treated in the outpatient clinic, the average age was 9.15 years.
- 6. Age group category Number of patients Age Group by Percentage 0-1 25 15.72% 2-5 57 35.85% 6-10 33 20.75% 11-15 21 13.21% 16+ 23 14.47% There were 7 identifiable causes of burns within these patients. The major causes of pediatric burns in the developing countries that have been previously reported are confirmed in Nicaragua. The leading causes of burns in the developing countries are hot water or flame. The majority of these burns are kitchen related accidents. Etiology of Burns Number of Patients Etiology by Percentage Unreported 1 0.63% Contact 8 5.03% Electrical 4 2.52% Scald 62 38.99% Friction 11 6.92% Flame 52 32.70% Immersion 13 8.18% Gunpowder 8 5.03% The total count of pediatric burn patients by gender, etiology and percentage of total clinic visits is represented below. Etiology of Burn Gender Count of Patients Percentage of Total Patient Visits Unreported M 1 .63% Contact F 5 3.14% Contact M 3 1.89% Electrical F 1 0.63% Electrical M 3 1.89% Scald F 33 20.75% Scald M 29 18.24% Friction F 5 3.14% Friction M 6 3.77% Flame F 20 12.58% Flame M 32 20.13%
- 7. Immersion F 4 2.52% Immersion M 9 5.66% Gunpowder M 8 5.03% The etiology of pediatric burns was looked at by age groups and compared with the total number of patients treated in the outpatient clinic setting. A further analysis of this data broken down by gender, mechanism and age group demonstrates no gunpowder/explosion burns to the female pediatric population. There was also twice the number of male flame related burns in the age group 2-5 years. There were triple the number of flame related burns in the age 11-15 year population for male children. Age Group Etiology Female Male Total Percentage Total by Age Group 0-1 Contact 1 1 2 .08 0-1 Scald 7 9 16 .64 0-1 Flame 2 2 4 .16 0-1 Immersion 0 3 3 .12 2-5 Contact 2 0 2 .04 2-5 Electrical 1 0 1 .01 2-5 Scald 13 12 25 .44 2-5 Friction 1 0 1 .02 2-5 Flame 6 12 18 .32 2-5 Immersion 3 6 9 .16 2-5 Gunpowder 0 1 1 .01 6-10 Unknown 0 1 1 .03 6-10 Scald 7 6 13 .39 6-10 Friction 1 2 3 .09 6-10 Flame 4 6 10 .30 6-10 Gunpowder 0 6 6 .19 11-15 Contact 1 0 1 .05 11-15 Electrical 0 1 1 .05 11-15 Scald 4 0 4 .19 11-15 Friction 1 3 4 .19 11-15 Flame 2 7 9 .42 11-15 Immersion 1 0 1 .05 11-15 Gunpowder 0 1 1 .05
- 8. 16+ Contact 1 2 3 .13 16+ Electrical 0 2 2 .09 16+ Scald 2 2 4 .17 16+ Friction 2 1 3 .13 16+ Flame 6 5 11 .48 Burns by Body Region Fingers 27% Hand 11% Forearm 10% Upper arm 13% Chest 7% Abdomen 5% Buttocks and Perineum 4% Thigh 10% Calf 8% Foot 5% Upper extremity burns comprised 68 percent of all burns. The fingers and hands accounted for 38 percent of the overall burn regions. There have numerous studies citing the benefits of compression therapy as well as analysis of the variables associated with scar formation. Race and age have all been cited as factors associated with burn scar formation. The greatest determinant for overall scar formation is the length of time required for the wound to heal. Wounds that heal within 10-14 days often had no problem with scar formation. Burns that took 14-21 days to heal had approximate 33 percent change of developing hypertrophic scar formation and if the burns took greater than 21 days to heal than 78 percent of the burn sites demonstrated hypertrophic scar formation.* These authors desired to evaluate the mechanism of burn and location of body part burned with the overall intake score and relative change with compression over time. Nearly 100 percent of these patients required greater than 3 weeks to heal. In 2001, the Vancouver burn index scale was created. This index includes the height of the scar, vascularity, and pliability. There has been concern raised with inter and intra-tester reliability. These authors have chosen to have all the children evaluated by a general physician and physical therapist separately. After each independent assessment, a mutually agreed upon total score was agreed upon. Every patient treated in the outpatient clinic had initial and follow-up digital photography. These authors have now modified
- 9. the Vancouver Index to include other variables and will perform this assessment in multiple countries. The authors will evaluate each individual subset and report the findings as well as determine the rate of change of the burn scar without any intervention. The average Vancouver scores by body part and the progress demonstrated with intervention are listed below. Body Region Vancouver Intake Score Average 3 month score Average 6 month score Average 9 month score Fingers 4.47 3.00 1.00 Hand 4.57 4.00 2.71 1.75 Forearm 4.98 4.29 2.93 1.40 Upper arm 5.23 4.59 3.08 2.50 Chest 4.76 3.79 3.43 2.00 Abdomen 5.23 4.83 5.75 2.00 Buttocks 5.25 3.75 6.00 Thigh 4.81 3.37 4.50 4.00 Calf 5.00 4.17 3.50 Foot 5.42 3.75 5.00 Face 4.92 4.06 3.11 3.00 Neck 6.00 4.33 1.50 These initial Vancouver scores are differentiated by mechanism of burn and by body part burned. Body Region unknown Contact electrical Scald friction flame immersion gunpowder Fingers 5.00 8.00 4.00 4.88 3.00 3.00 Hand 2.00 6.00 2.67 5.31 4.40 Forearm 5.25 5.00 3.17 8.00 6.00 4.00 4.00 Upper arm 5.00 4.00 4.41 6.00 5.93 5.00 4.00 Chest 5.00 3.96 5.50 6.31 3.00 Abdomen 5.18 8.00 5.71 3.00 4.00 Buttocks 7.33 8.00 3.71 7.00 Thigh 5.00 7.67 4.21 4.83 5.10 3.90 5.71 Calf 3.00 8.00 4.70 6.25 4.83 4.33 5.67 Foot 4.00 6.00 5.87 7.00 Face 3.00 4.14 5.00 5.62 4.00 4.00
- 10. Neck 6.00 Electrical burns resulted in the highest initial Vancouver scores followed by friction related and contact related burns respectively. Of interest, hot water accounted for the greatest causative factor of burns but had the lowest relative intake score. Patient’s scores were obtained at 3 month intervals. The 3 month Vancouver scores are differentiated by mechanism of burn and by body part burned. Body Contac Electrica Flas Frictio Immersio Powde Scal Region t l h n n r d Average Score for all etiologie s Fingers 3.00 3.00 Hand 4.57 3.00 1.00 2.86 Forearm 4.64 8.00 0.50 4.38 Upper 2.00 5.00 6.50 3.33 4.21 arm Chest 2.00 6.00 8.00 1.00 3.00 4.00 Abdome 7.00 2.50 5.67 5.06 n Buttocks 3.00 6.00 4.50 Thigh 2.83 3.50 2.67 3.00 5.20 2.87 Calf 3.00 4.50 3.63 Foot 4.11 7.00 3.75 3.75 Face 4.87 Neck 4.33 4.33 The 6 month Vancouver scores are differentiated by mechanism of burn and by body part burned. Body Contact Electrical Flash Frictio Region n Immersion Powder Scald Average Score for all etiologies Fingers 1.00 1.00 Hand 3.00 1.00 2.00 Forearm 3.36 1.33 2.35 Upper 2.00 3.83 2.40 2.74 arm Chest 2.00 3.50 3.75 3.08 Abdomen 7.00 5.33 6.17 Buttocks 6.00 6.00 Thigh 3.67 3.00 5.50 4.06
- 11. Calf 4.00 1.00 4.00 3.00 Foot 5.00 5.00 Face 3.83 1.67 2.75 Neck 1.50 1.50 The 9 month Vancouver scores are differentiated by mechanism of burn and by body part burned. Body Contac Electrica Flas Frictio Immersio Powde Scal Region t l h n n r d Average Score for all etiologie s Fingers Hand 2.33 2.33 Forearm 1.75 1.75 Upper 1.00 3.00 2.00 arm Chest 1.00 3.00 2.00 Abdome 2.00 2.00 n Buttocks Thigh Calf Foot Face 3.00 3.00 Neck Vancouver scores were recorded at 3, 6, 9 month follow up visits as demonstrated below: Body Part Burned Average Initial Vancouver Score Average 3 month Vancouver Score Percent Change Average 6 month Vancouver Score Overall Percent Change Average 9 month Vancouver Score Overall Percent Change Fingers 4.47 3.00 .32 1.00 .78 Hand 4.57 2.86 .37 2.00 .56 2.33 *.49 Forearm 4.98 4.38 .12 2.35 .53 1.75 .65 Upper 5.23 4.21 .20 2.74 .48 2.00 .62 arm
- 12. Chest 4.76 4.00 .16 3.08 .35 2.00 .58 Abdomen 5.23 5.06 .03 6.17 +.18 2.00 .62 Buttocks 5.25 4.50 .14 6.00 +.14 Thigh 4.81 2.87 .40 4.06 *.16 Calf 5.00 3.63 .27 3.00 .40 Foot 5.42 3.75 .31 5.00 *.08 Face 4.92 4.87 .01 2.75 .44 3.00 *.39 Neck 6.00 4.33 .38 1.50 .75 All Body 5.03 3.96 .22 3.30 .46 1.84 .56 Parts · There were 4 body parts that did not show improvement between the third and sixth month re-evaluation. Those body parts were the abdomen, buttocks, and thigh and foot. The abdomen did demonstrate significant overall improvement by the 9 month evaluation which was consistent with other body parts that 9 month data was obtained. · The forearm and hand were the most responsive to intervention with the lowest final Vancouver outcome score achieved. · The face demonstrated the poorest overall progress and greatest final Vancouver outcome score. · The neck demonstrated the highest initial Vancouver score with the second greatest change in score at the sixth month follow-up. Utilizing all available data, the timing of intervention directly affected the initial burn score, the rate of change, and the final outcome as demonstrated by the two graphs below.
- 13. Intervention Analysis: Early vs Late 5.25 3.52 2.3 5.4 3.9 3.4 6 5 4 3 2 1 0 1.5 months 4.5-4.9 months 7.5-7.9 months 10.5-10.9 months Vancouver Burn Score Phase I (intervention started 0-3 mos post burn) Phase II (intervention started 3-8 mos post burn) The progress that has been made in Nicaragua has been remarkable. Positive trends in overall outcomes and improved expectations of the patients and medical community have been realized. There has been less need for massive reconstructive procedures and amputations and a general need for lesser reconstructive procedures (z-plasties). Physicians For Peace and their international partners have now assisted with the development of a second burn compression program in the Dominican Republic and are planning on a third outpatient program in Guatemala. A multi-center study is now underway.