A poster I lead and presented at the 2017 annual meeting of the American Congress of Rehabilitation Medicine. It won the Early Career poster award from the Brain Injury Interdisciplinary Special Interest Group
Charbagh + Female Escorts Service in Lucknow | Starting ₹,5K To @25k with A/C...
Brown acrm poster 2017 25 aug 17_take 7
1. Sleep Apnea and BMI Trajectory:
A VA TBI Model Systems Study
Racine Marcus Brown, Ph.D.,1 Risa Nakase-Richardson, Ph.D.,1-4 Marc A. Silva, Ph.D.,1-3,5 Kayla LaRosa, M.S.,1-3,6 Xinyu Tang, Ph.D.,7 Marie Saylors, MPH,7
Daniel Schwartz, MD,8 Mo Modarres, Ph.D.9
1VA HSR&D Center of Innovation on Disability and Rehabilitation Research, Gainesville, FL & Tampa, FL; 2Mental Health and Behavioral Science, James A. Haley Veterans Hospital, Tampa, FL; 3Defense
and Veterans Brain Injury Center at James A. Haley Veterans Hospital, Tampa, FL; 4Department of Internal Medicine, University of South Florida; 5Department of Psychology, University of South Florida;
6Department of Pediatrics, University of South Florida, Tampa, FL; 7Biostatistics Program, Department of Pediatrics University of Arkansas for Medical Sciences, Little Rock, AR; 8Medical Service, Service,
James A Haley Veterans’ Hospital, Tampa, FL; 9RR&D Brain Rehabilitation Research Center, Malcom Randall VA Medical Center in Gainesville, FL
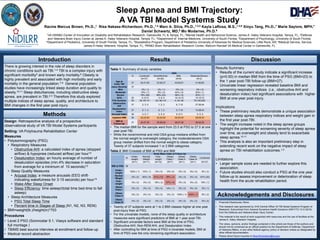
Table 1: Summary of study variables
• The median BMI for the sample went from 23.0 at PSG to 27.0 at one
year post-TBI.
• While the none/minimal and mild OSA group medians shifted from
the normal weight to overweight category, the moderate/severe OSA
group median shifted from the normal weight to obese category.
Twenty of 37 subjects increased 1 or 2 BMI categories
Table 2: BMI Crosstab of BMI at PSG and BMI
• Twenty of 37 subjects were at 1 to 2 BMI classes higher at one year
post-injury than at PSG.
• For the univariate models, none of the sleep quality or architecture
measures were significant predictors of BMI at 1 year post-TBI.
• Significant univariate factors were BMI at the time of PSG,
Obstructive AHI, Non-REM AHI, and Desaturation Index.
• After controlling for BMI at time of PSG in bivariate models, BMI at
time of PSG was the only remaining significant association.
Results
Acknowledgements and Disclosures
Introduction
There is growing interest in the role of sleep disorders in
chronic conditions such as TBI.1-4 TBI is a complex injury with
significant morbidity5 and known early mortality.6 Obesity is
highly prevalent and associated with high morbidity and early
mortality in the general population.7-9 General population
studies have increasingly linked sleep duration and quality to
obesity.10-11 Sleep disturbances, including obstructive sleep
apnea, are prevalent in TBI.2-3 Therefore this study explored
multiple indices of sleep apnea, quality, and architecture to
BMI changes in the first year post injury.
Methods
Design: Retrospective analysis of a prospective
observational study of VA TBI Model Systems participants
Setting: VA Polytrauma Rehabilitation Center
Measures
• Polysomnography (PSG)
• Respiratory Measures
• Obstructive AHI: a calculated index of apnea (stopped
airflow) & hypopnea (reduced airflow) per hour12
• Desaturation Index: an hourly average of number of
desaturation episodes (min.4% decrease in saturation
from average for a minimum of 10 seconds)13
• Sleep Quality Measures
• Arousal Index: a measure arousals (EEG shift-
indicating wakefulness for 3-15 seconds) per hour14
• Wake After Sleep Onset
• Sleep Efficiency: time asleep/(total time bed-time to fall
asleep)
• Sleep Architecture Measures
• PSG Total Sleep Time
• Percent time in Stages of Sleep (N1, N2, N3, REM)
• BMI=weight(lb.)/height(in)*703
Procedures
• Level 2 PSG (Somnostar 9.1, Viasys software and standard
full montage )
• TBIMS best source interview at enrollment and follow-up
• Medical record abstraction
Discussion
Results Summary
• Results of the current study indicate a significant increase
(p=0.00) in median BMI from the time of PSG (BMI=23) to
the 1 year post-TBI follow-up (BMI=27).
• Univariate linear regression revealed baseline BMI and
worsening respiratory indices (i.e., obstructive AHI and
desaturation index) had significant associations with higher
BMI at one-year post-injury.
Implications
• These preliminary results demonstrate a unique association
between sleep apnea respiratory indices and weight gain in
the first year post-TBI.
• The weight increase noted in the sleep apnea groups
highlight the potential for worsening severity of sleep apnea
over time, as overweight and obesity tend to exacerbate
sleep apnea.10-11
• This analysis is also an important preliminary step in
extending recent work on the negative impact of sleep
apnea on TBI rehabilitation outcomes.1-3
Limitations
• Larger sample sizes are needed to further explore this
association.
• Future studies should also conduct a PSG at the one year
follow-up to assess improvement or deterioration of sleep
health from the acute rehabilitation period.
• Financial Disclosures: None.
• This research was sponsored by VHA Central Office VA TBI Model Systems Program of
Research; Subcontract from General Dynamics Health Solutions (W91YTZ-13-C-0015)
from the Defense and Veterans Brain Injury Center;
• This material is the result of work supported with resources and the use of facilities at the
James A. Haley Veterans’ Hospital.
• The views, opinions, and/or findings contained in this article are those of the authors and
should not be construed as an official position by the Department of Defense, Department
of Veterans Affairs, or any other federal agency, policy or decision unless so designated by
other official documentation.
• Please direct future inquiries to Risa.Richardson@va.gov
Body Mass Index at Follow-Up
N
Under-
weight
Normal
Weight
Over-
weight
Obese
Class I
Obese
Class II
Obese
Class III
Combined
(N=1) (N=11) (N=16) (N=7) (N=1) (N=1) (N=37)
BMI at PSG 36
Under-
weight
100% ( 1) 10% ( 1) 0% ( 0) 0% ( 0) 0% ( 0) 0% ( 0) 6% ( 2)
Normal
Weight
0% ( 0) 90% ( 9) 81% (13) 29% ( 2) 0% ( 0) 0% ( 0) 67% (24)
Over-
weight
0% ( 0) 0% ( 0) 19% ( 3) 57% ( 4) 0% ( 0) 0% ( 0) 19% ( 7)
Obese
Class I
0% ( 0) 0% ( 0) 0% ( 0) 14% ( 1) 0% ( 0) 0% ( 0) 3% ( 1)
Obese
Class II
0% ( 0) 0% ( 0) 0% ( 0) 0% ( 0) 100% ( 1) 100% ( 1) 6% ( 2)
Obese
Class III
0% ( 0) 0% ( 0) 0% ( 0) 0% ( 0) 0% ( 0) 0% ( 0) 0% ( 0)
OSA
N Combined None/Minimal Mild Moderate/Severe
(N=37) (N=26) (N=9) (N=2)
Age at
Index TBI
37 24;31;50 23;26;37 43;50;51 41;50;60
Injury Severity 37
Mild 3% ( 1) 4% ( 1) 0% ( 0) 0% ( 0)
Moderate 19% ( 7) 8% ( 2) 44% ( 4) 50% ( 1)
Severe 78% (29) 88% (23) 56% ( 5) 50% ( 1)
GCS 25 6; 9;13 3; 6; 9 12;14;15 15;15;15
PTA Duration 29 20; 45;111 22; 46;110 4; 24; 65 70;140;209
Obstructive
AHI
37 2; 3; 5 1; 2; 3 6; 7;10 27;36;44
Desaturation
Index
37 0; 1; 3 0; 1; 2 3; 7;10 14;28;43
Arousal Index 36 4; 5; 7 3; 5; 6 5; 9;11 5; 5; 5
Inpatient BMI 36 22;23;25 22;23;25 22;24;25 26;29;32
BMI at
Follow-Up
37 24;27;30 22;26;29 26;27;30 29;32;35