
Recommended
More Related Content
Similar to Running head Research report11Research report13Business Resea.docx
Similar to Running head Research report11Research report13Business Resea.docx (16)
More from charisellington63520
More from charisellington63520 (20)
Recently uploaded
Recently uploaded (20)
Running head Research report11Research report13Business Resea.docx
- 1. Running head: Research report 11 Research report 13Business Research Project Part 5:Research Report Alexis Madera, Christopher Lauko, Cristina Linares, Marina Garcia, & Sarah Maokosy QNT/561 August 4, 2014 Jonathan Edelman Research Report Due to the new fitness and health awareness fad, gym memberships are growing rapidly. In order to better understand the demographics and cater to the needs of gym members, research is required. Fitness Gymnasium is a large fitness gym in Lincoln, Nebraska. Members of Learning Team A are a part of the management team. The management team has been tasked to provide health and wellness checkups for 40 random female gym members. The purpose of this research is to obtain an overall understanding of the female demographics of the gym. The results of this research will provide Fitness Gymnasium with enough information to create fitness programs based on the needs of its female members. Blood pressure is an important variable to consider before allowing customers to obtain gym memberships. Varying results have been observed amongst the Blood Pressure and Body Mass Index (BMI) of female gym members. Hypothesis H0: There is no correlation between an applicant's BP and their BMI. Ha: There is a correlation between an applicant's BP and their BMI. Study The purpose of this study is to find a correlation between Body Mass Index (BMI) and Blood Pressure (BP). Studies have shown
- 2. those who have an above average BMI are more likely to have long term health problems such as high BP or hypertension. BMI is the calculation of a person's weight and height, and provides a reliable indicator of body fat in a person (Centers for Disease Control, 2013).BP is the measurement of the force of blood running through veins and arteries, which is measured in two numbers as a ratio: Systolic and Diastolic (S/D) (American Heart Association, 2014). According to a past research study, those who increased their BMI also increased their BP, which put them at risk of hypertension (Droyvold, Midthjell, Nilsen, & Holmen, 2005). From this, Fitness Gymnasium will create a program with the needs and the well-being of its female members in mind. Population and Size The current population and size is the amount of gym members. Fitness Gymnasium’s population is the amount of all male and female gym members, which is 100 members. With that being said, the population for Fitness Gymnasium is all male and female gym members, and the size is 100 members. Target Population and Sample Size The current target population for the gym is female gym members. At Fitness Gymnasium, the current percentage of female members is 50% of 100 total gym members, which makes the target population 50 females. For Fitness Gymnasium, the sample size is 40 using a 95% confidence level, 5% margin of error with a target population of 40 females (Appendix A). Assessment/Survey Fitness Gymnasium created the following survey to observe the correlation between a member’s BMI and BP. The members that were surveyed were that of different age, nationality, height, and weight. This enabled Fitness Gymnasium to get a true sample based off of their female members. See survey in Appendix A. Simple Random Sampling With this type of research, simple random sampling would be
- 3. the best method since it deals with the observation of data from a small gym. Simple random sample is a sample of a larger population. The participants of the survey will be chosen randomly to ensure there is no preference involved other than female respondents. Data collection The assessment is a simple health and wellness checkup, and will not damage a respondent’s health in any way. The employee will check the gym membership card and number to ensure correct identification. The employee will also take the respondent’s height, weight, BP ratio, and BMI measurements to ensure it is accurate. Validity and Reliability Validity and reliability will be achieved through the monitoring and classification of data. The survey will be completed on a computer to ensure there is no data duplication. An employee of the gym will randomly ask 40 female gym members to complete the survey. Those who complete the survey will receive $25 off their next month’s membership. This will engage the respondents and ensure participation. Storage of Data All data from the assessment/survey will be stored on the company’s laptop. Both the laptop and the excel spreadsheet will be locked and will require a password for access. Only those who are conducting the research study will have the password. Sampling Design This sampling design will provide a researcher enough information to replicate the assessment/survey study Fitness Gymnasium has created. The purpose of this research study is to find the correlation between Body Mass Index (BMI) and Blood Pressure (BP) ratio. The information obtained will enable the gym to accommodate the needs of its female gym members through the creation of new programs. Data Analysis BMI (Body Mass Index)
- 4. Distribution: Is normally distributed Central Tendency: Mean = 25.740 Dispersion: Standard Deviation = 12.45 Number: 40 Min/Max: 17.7 and 44.9 Confidence Interval: BMI 23.768 to 27.712 See the histogram in Appendix B, scatterplot in Appendix C, and descriptive statistics in Appendix D Systolic – Blood Pressure Distribution: Is normally distributed Central Tendency: Mean = 110.80 Dispersion: Standard Deviation = 17.11 Number: 40 Min/Max: 89 and 181 Confidence Interval: Systolic 105.33 to 116.27 See the histogram in Appendix B, scatterplot in Appendix C, and descriptive statistics in Appendix D Diastolic – Blood Pressure Distribution: Is normally distributed Central Tendency: Mean = 67.43 Dispersion: Standard Deviation = 11.63 Number: 40 Min/Max: 41 and 102 Confidence Interval: Systolic 63.71 to 71.14 See the histogram in Appendix B, scatterplot in Appendix C, and descriptive statistics in Appendix D Interpretation Body Mass Index (BMI) The data was significantly skewed to the right. Forty subjects were randomly selected. Their overall BMI was observed between 17.7 and 44.9. Their average BMI was 25.740, with a variation of plus or minus 6. There is 95% confidence that the population BMI average is between 23.768 and 27.712.
- 5. Blood Pressure – Systolic (Top number measuring pressure in the arteries) The data was significantly skewed to the right. Forty subjects were randomly selected. Their systolic was observed between 89 and 181. Their average systolic was 110.80, with a variation of plus or minus 17. There is 95% confidence that the population systolic average is between 105.33 and 116.27. Blood Pressure – Diastolic (bottom number measuring pressure in the arteries) The data was skewed to the right. Forty subjects were randomly selected. Their diastolic was observed between 41 and 102. Their average diastolic was 67.43, with a variation of plus or minus 11. There is 95% confidence that the population diastolic average is between 63.71 and 71.14. ***Need to update LT A WK 5 paper after it has been graded and there is feedback*** ***NEED TO ADD WK 5 INDIVIDUAL ASSIGNMENT PAPER for highest team member grade*** (+350 words) Recommendations (100 words) Observations (200 words) solution Challenges (200 words) · Research challenges your team experienced in this study Minimization steps (200 words) · Steps to minimize challenges in future research Suggestions (200 words) · Suggested future research based on your research results, challenges, and implications Conclusion (100 words) Running head: RESEARCH REPORT
- 6. 1 Appendix A Fitness Assessment/Survey 1. Name: 2. Membership #: 3. Age: 4. Nationality: 5. Height: 6. Weight: 7. Blood Pressure (BP) ratio= Systolic/Diastolic: 8. Body Mass Index (BMI): Sample Size Calculation Z= Z score critical value N= population ME= Margin of Error p=probability 95% Confidence Level= 1.96 N=50 ME= 5%= 0.05 p=50%= 0.5 n= sample size n= [ (N(Z^2)*(p(1-p)) / ((N-1)ME^2+((Z^2)* (p(1-p))] n= [ (50(1.96^2)*(0.5(1-0.5)) / ((100- 1)0.05^2+((1.96^2)*(0.5(1-0.5))] n= [ (50((3.8416)*(0.5*0.5)) / ((99*0.0025)+(3.8416*(0.5*0.5))] n= [ (50(3.8416*0.25) / (0.2475+(3.8416*0.25))] n= [ (50*0.9604) / (0.2475+0.9604)] n= [ 48.02 / 1.2079] n= 39.7549466 (round to the nearest whole number) n= 40 Appendix B Raw data used in the analysis . Appendix C
- 7. Charts and Tables Appendix D Descriptive Statistics References American Heart Association. (2014). High blood pressure. Retrieved from http://www.heart.org/HEARTORG/Conditions/HighBloodPressu re/AboutHighBloodPressure/misunderstandings_301764_Article .jsp Centers for Disease Control and Prevention. (2013). Body mass index. Retrieved from http://www.cdc.gov/healthyweight/assessing/bmi/ Droyvold, W.B., Midthjell, K., Nilsen, T.I.L., & Holmen, J. (2005, 06). Change in body mass index and its impact on blood pressure: a prospective population study. International Journal of Obesity, 29(6), 650-655. ProQuest.
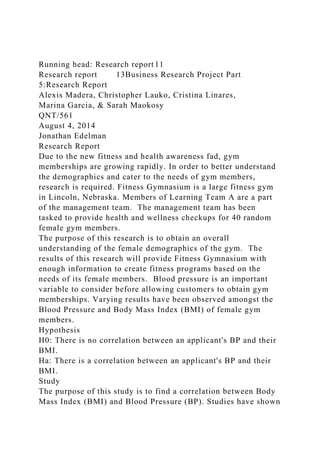
- 8. Histogram 15 20 25 30 35 40 44.999000000000009 17.5 35 30 10 2.5 5 BMI Percent Histogram 80 90 100 110 120 130 140 150 160 170 180 189.99 2.5 20 35 25 10 2.5 0 2.5 0 0 2.5 SYS Percent Histogram 40 50 60 70 80 90 100 109.99000000000002 7.5 12.5 40 25 12.5 0 2.5 DIAS Percent Scatterplot BMI versus Systolic 19.600000000000001 23.8 19.600000000000001 29.1 25.2 21.4 22 27.5 33.5 20.6 29.9 17.7 24 28.9 37.700000000000003 18.3 19.8 29.8 29.7 31.7 23.8 44.9 19.2 28.7 28.5 19.3 31 25.1 22.8 30.9 26.5 21.2 40.6 21.9 26 23.5 22.8 20.7 20.5 21.9 104 99 102 114 94 101 108 104 123 93 89 112 107 116 181 98 100 127 107 116 97 155 106 110 105 118 133 113 113 107 95 108 114 104 125 124 92 119 93 106 BMI
- 9. SYS Scatterplot BMI versus Diastolic 19.600000000000001 23.8 19.600000000000001 29.1 25.2 21.4 22 27.5 33.5 20.6 29.9 17.7 24 28.9 37.700000000000003 18.3 19.8 29.8 29.7 31.7 23.8 44.9 19.2 28.7 28.5 19.3 31 25.1 22.8 30.9 26.5 21.2 40.6 21.9 26 23.5 22.8 20.7 20.5 21.9 61 64 65 76 58 66 61 41 72 61 56 62 48 62 102 61 53 74 67 71 64 85 59 70 69 82 83 75 66 67 59 72 79 73 73 85 46 81 64 64 BMI DIAS Running head: formulation of the research problem 1 formulation of the research problem2Business Research Project Part 1:Formulation of the Research Problem Alexis Madera, Christopher Lauko, Cristina Linares, Marina Garcia, & Sarah Maokosy QNT/561 July 7, 2014 Jonathan Edelman Formulation of the Research Problem Fitness Gymnasium is a large fitness gym in Lincoln, Nebraska. Members of Learning Team A are a part of the management team. The management team has been tasked to provide health and wellness checkups for 41 random female gym members. The purpose of this research is to obtain an overall understanding of the female demographics of the gym. The results of this
- 10. research will provide Fitness Gymnasium with enough information to create fitness programs based on the needs of its female members. Blood pressure is an important variable to consider before allowing customers to obtain gym memberships. Varying results have been observed amongst the Blood Pressure and Body Mass Index (BMI) of female gym members. Research Question: Does a female’s Body Mass Index (BMI) have an effect on their blood pressure? Independent Variable (IV): The independent variable in this scenario is a female’s Body Mass Index (BMI). Dependent Variable (DV): The dependent variable in this scenario is a female’s Blood Pressure. Hypothesis Statements: Ho: There is no correlation between an applicant's BP (DV) and their BMI (IV). H1: There is a correlation between an applicant's blood pressure (DV) and their BMI (IV). You have the basics here with a good back story. However, it might be a good idea to explain why these are the specific management questions and hypothesis you are researching. This helps the reader to understand why these and not other potential issues are the focus of your research. It is a good beginning but it needs further detail to gain full clarity – grade = 89
- 11. Sampling Data Population: Amount of gym members Size: 100 gym members total Target Population: 50 female gym members Sample Size: 40 female gym members Z= Z score critical value N= population ME= Margin of Error p=probability 95% Confidence Level= 1.96 N=50 ME= 5%= 0.05 p=50%= 0.5 n= sample size n= [ (N(Z^2)*(p(1-p)) / ((N-1)ME^2+((Z^2)* (p(1-p))] n= [ (50(1.96^2)*(0.5(1-0.5)) / ((100- 1)0.05^2+((1.96^2)*(0.5(1-0.5))] n= [ (50((3.8416)*(0.5*0.5)) / ((99*0.0025)+(3.8416*(0.5*0.5))] n= [ (50(3.8416*0.25) / (0.2475+(3.8416*0.25))] n= [ (50*0.9604) / (0.2475+0.9604)] n= [ 48.02 / 1.2079] round to the nearest whole number) n= 40
- 12. Population and Size The current population and size is the amount of gym members. Fitness Gymnasium’s population is the amount of all male and female gym members, which is 100 members. With that being said, the population for Fitness Gymnasium is all male and female gym members, and the size is 100 members. Target Population and Sample Size The current target population for the gym is female gym members. At Fitness Gymnasium, the current percentage of female members is 50% of 100 total gym members, which makes the target population 50 females. For Fitness Gymnasium, the sample size is 40 using a 95% confidence level, 5% margin of error with a target population of 50 females. Z= Z score critical value N= population ME= Margin of Error p=probability 95% Confidence Level= 1.96 N=50 ME= 5%= 0.05 p=50%= 0.5 n= sample size n= [ (N(Z^2)*(p(1-p)) / ((N-1)ME^2+((Z^2)* (p(1-p))] n= [ (50(1.96^2)*(0.5(1-0.5)) / ((100- 1)0.05^2+((1.96^2)*(0.5(1-0.5))] n= [ (50((3.8416)*(0.5*0.5)) / ((99*0.0025)+(3.8416*(0.5*0.5))] n= [ (50(3.8416*0.25) / (0.2475+(3.8416*0.25))] n= [ (50*0.9604) / (0.2475+0.9604)] n= [ 48.02 / 1.2079] n= 40 2 Assessment/Survey
- 13. Name: Membership #: Age: Nationality: Height: Weight: Blood Pressure (BP) ratio= Systolic/Diastolic: Body Mass Index (BMI): *SIMPLE RANDOM SAMPLING* Assessment/Survey Fitness Gymnasium created the following survey to observe the correlation between a member’s BMI and BP. The members that were surveyed were that of different age, nationality, height, and weight. This enabled Fitness Gymnasium to get a true sample based off of their female members. Simple Random Sampling With this type of research, simple random sampling would be the best method since it deals with the observation of data from a small gym. Simple random sample is a sample of a larger population. The participants of the survey will be chosen randomly to ensure there is no preference involved other than female respondents. 3 Collection Plan Data Collection: Check ID and Gym Membership for verification Complete Survey: height, weight, age, etc.
- 14. Take measurements of BMI and BP (SYS/DIAS) Validity and Reliability: Monitoring and Classification of data Survey given on computer to ensure no duplication $25 off next month’s membership to entice participants Storage of Data: All data stored on company laptop Locked computer w/password only access Locked spreadsheet w/password only access Data collection The assessment is a simple health and wellness checkup, and will not damage a respondent’s health in any way. The employee will check the gym membership card and number to ensure correct identification. The employee will also take the respondent’s height, weight, BP ratio, and BMI measurements to ensure it is accurate. Validity and Reliability Validity and reliability will be achieved through the monitoring and classification of data. The survey will be completed on a computer to ensure there is no data duplication. An employee of the gym will randomly ask 40 female gym members to complete the survey. Those who complete the survey will receive $25 off their next month’s membership. This will engage the respondents and ensure participation. Storage of Data All data from the assessment/survey will be stored on the company’s laptop. Both the laptop and the excel spreadsheet will be locked and will require a password for access. Only those who are conducting the research study will have the
- 15. password. 4